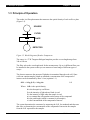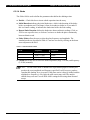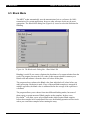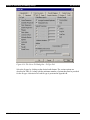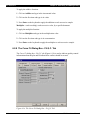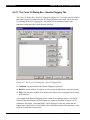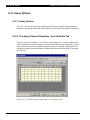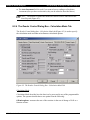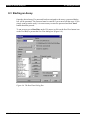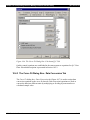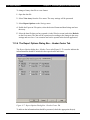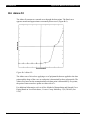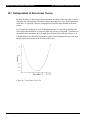
1
Absorbance ² Plate Washing ² Luminescence ² Automated Processing ² Revelation Program User Manual for MRX Software DYNEX Technologies, Inc. 14340 Sullyfield Circle, Chantilly, VA 20151-1683 Phone: (703) 631-7800 FAX: (703) 803-1441 www.dynextechnologies.com Ò This page is intentionally left blank Revelation Software User’s Guide IMPORTANT: Please read this manual carefully before using the program Notice: The RevelationTM application program is covered by a software license (a copy of which is enclosed in this manual). Part Number 99001830 Rev. 10-19-04 DYNEX Technologies, Inc. reserves the right to make technical improvements to this program and documentation without notice as part of a continuous program of product development. This manual supersedes all previous editions. If this manual is provided to an end user, it is with the understanding that the material included herein is proprietary to DYNEX Technologies, Inc. The user may not provide this material to a third party without the written permission of DYNEX Technologies. Questions or comments regarding the content of this manual can be directed to: DYNEX Technologies 14340 Sullyfield Circle Chantilly VA 20151-1683 Phone: Toll Free: Fax: Internet: (800) 288-2354 (703) 631-7800 (703) 803-1441 www.dynextechnologies.com Part Number 99001830 2001, DYNEX Technologies, Inc. This document is the copyright of DYNEX Technologies, and must not be reproduced in any form without prior consent. MRX is a registered trademarks of DYNEX Technologies. Revelation is a trademark of DYNEX Technologies. Microsoft, Windows and Excel are registered trademarks of Microsoft Corporation. Revelation Software License Agreement Revelation Software License Agreement This software license agreement, including the Warranty and Special Provisions set forth on the separate sheet included in this package, is a legal agreement between you (either an individual or an entity, hereinafter “End User”) and the manufacturer (DYNEX Technologies, Inc.) of the system containing software product. By using the system in which software program(s) have been preinstalled (“SOFTWARE”), you are agreeing to be bound by the terms of this agreement. 1 GRANT OF LICENCE. This License Agreement permits you to use the SOFTWARE as preinstalled on the system. 2 INTELLECTUAL PROPERTY. MRX Revelation contains intellectual property, i.e., software programs, that are licensed for the end user customer’s use (hereinafter “End User”). This is not a sale of such intellectual property. The end user shall not copy, disassemble, reverse engineer, or decompile the software program. 3 COPYRIGHT. Windows SOFTWARE is owned by Microsoft Corporation or its suppliers and is protected by United States copyright laws and international treaty provisions and all other applicable national laws. Revelation SOFTWARE is owned by DYNEX Technologies, or its suppliers and is protected by United States copyright laws and international treaty provisions and all other applicable national laws. Therefore, you must treat the SOFTWARE like any other copyrighted material (e.g. a book or musical recording). 4 U.S. GOVERNMENT RESTRICTED RIGHTS. The SOFTWARE and documentation are provided with RESTRICTED RIGHTS. Use, duplication, or disclosure by the United States Government is subject to restrictions as set forth in subparagraph (c)(1)(ii) of The Rights in Technical Data and Computer Software clause at DFARS 252.227-7013 or subparagraphs (c)(1) and (2) of the Commercial Computer Software – Restricted Rights at 48 CFR 52.227-19, as applicable. Manufacturers of the respective software are Microsoft Corporation/One Microsoft Way/Redmond, WA 98052-6399 and DYNEX Technologies, 14340 Sullyfield Circle, Chantilly VA 20151. Please use the Warranty and Special Provisions for information concerning governing law. Product support for the SOFTWARE is not provided by Microsoft Corporation or its subsidiaries. DYNEX Technologies only provides support for DYNEX Technologies software products. Should you have any questions concerning this Agreement, or if you desire to contact DYNEX Technologies for any reason, please refer to the address listed in this documentation. FOR THE LIMITED WARRANTY AND SPECIAL PROVISIONS PERTAINING TO YOUR COUNTRY, PLEASE REFER TO THE WARRANTY AND SPECIAL PROVISIONS SHEET INCLUDED IN THIS PACKAGE. MRX Revelation Manual i Revelation Software License Agreement Warranty and Special Provisions Limited Warranty LIMITED WARRANTY. DYNEX Technologies, Inc. warrants that: 1 the SOFTWARE will perform substantially in accordance with the accompanying written materials for a period of ninety (90) days from the date of receipt. Any implied warranties on the SOFTWARE are limited to ninety (90) days. Some states/jurisdiction do not allow limitations on duration of an implied warranty, so the above limitation may not apply to you. CUSTOMER REMEDIES. DYNEX Technologies and its suppliers’ entire liability and your exclusive remedy shall be, at DYNEX Technologies option, either: 1 return of the price paid, or 2 repair or replacement of the SOFTWARE that does not meet the above Limited Warranty and which is returned to DYNEX Technologies with a copy of your receipt. This Limited Warranty is void if failure of the SOFTWARE has resulted from accident, abuse or misapplication. Any replacement SOFTWARE will be warranted for the remainder of the original warranty period or thirty (30) days, whichever is longer. NO OTHER WARRANTIES. THE MICROSOFT SOFTWARE PROGRAMS ARE PROVIDED TO THE END USER “AS IS” WITHOUT WARRANTY OF ANY KIND, EITHER EXPRESSED OR IMPLIED, INCLUDING BUT NOT LIMITED TO, WARRANTIES OF MERCHANTABILITY AND FITNESS FOR A PARTICULAR PURPOSE. THE ENTIRE RISK OF THE QUALITY AND PERFORMANCE OF THE SOFTWARE PROGRAM IS WITH YOU. NO LIABILITY FOR CONSEQUENTIAL DAMAGES. DYNEX TECHNOLOGIES SUPPLIERS SHALL NOT BE HELD TO ANY LIABILITY FOR ANY DAMAGES SUFFERED OR INCURRED BY THE END USER (INCLUDING BUT NOT LIMITED TO, GENERAL, SPECIAL, CONSEQUENTIAL OR INCIDENTAL DAMAGES INCLUDING DAMAGES FOR LOSS OF BUSINESS PROFITS, BUSINESS INTERRUPTION, LOSS OF BUSINESS INFORMATION AND THE LIKE), ARISING FROM OR IN CONNECTION WITH THE DELIVERY, USE OR PERFORMANCE OF THE SOFTWARE PROGRAM. Special Provisions This Software Licence Agreement and Warranty are governed by the laws of the States of Washington, U.S.A and Virginia U.S.A. IMPORTANT WARRANTY INFORMATION FOR REVELATION MRXS Do not install any applications other than Revelation on a Revelation Reader with a built in PC, as this may affect the reliability of assays and will invalidate the warranty. Do not attach non-DYNEX Technologies approved monitors, keyboards or mice to the Reader, as this will invalidate the warranty. ii MRX Revelation Manual Table of Contents Table of Contents Revelation Software License Agreement..........................................................................................i Chapter 1 Introduction ...................................................................................................... 1-1 1.1 1.2 1.3 1.4 1.5 Overview............................................................................................................................... 1-1 Modes of Operation and System Features ............................................................................ 1-3 Principle of Operation........................................................................................................... 1-4 MRX Revelation Application Software ......................................................................... 1-5 Contents of this Manual ........................................................................................................ 1-6 Chapter 2 Getting Started ................................................................................................. 2-1 2.1 Overview............................................................................................................................... 2-1 2.2 Powering Up the System....................................................................................................... 2-2 2.3 Setting the System Configuration ......................................................................................... 2-5 2.3.1 Setting the Reader Type.............................................................................................. 2-5 2.3.2 Configuring an Internal MRX Reader ..................................................................... 2-5 2.3.2.1 The Reader Tab.............................................................................................. 2-6 2.3.2.2 The Maintenance Tab .................................................................................... 2-7 2.3.2.3 The RS-232 Tab............................................................................................. 2-9 2.4 Initial Testing of the System ............................................................................................... 2-10 Chapter 3 Introduction to the Operating Program.......................................................... 3-1 3.1 3.2 3.3 3.4 Overview............................................................................................................................... 3-1 Conventions in this Manual .................................................................................................. 3-2 The Main Window ................................................................................................................ 3-5 File Types ............................................................................................................................. 3-6 Chapter 4 Commands........................................................................................................ 4-1 4.1 Overview............................................................................................................................... 4-1 4.2 The Menu Bar ....................................................................................................................... 4-2 4.2.1 The File Menu............................................................................................................. 4-2 4.2.1.1 New Assay ..................................................................................................... 4-2 4.2.1.2 Open............................................................................................................... 4-3 4.2.1.3 Close .............................................................................................................. 4-3 4.2.1.4 Save Assay..................................................................................................... 4-3 4.2.1.5 Save Assay As ............................................................................................... 4-3 4.2.1.6 Import ............................................................................................................ 4-4 4.2.1.7 Run Plate........................................................................................................ 4-4 4.2.1.8 Print ............................................................................................................... 4-4 4.2.1.9 Print Preview ................................................................................................. 4-4 4.2.1.10 Print Setup .................................................................................................... 4-4 4.2.1.11 Exit................................................................................................................ 4-5 4.2.2 The Settings Menu ...................................................................................................... 4-5 4.2.3 The View Menu .......................................................................................................... 4-5 4.2.4 The Utility Menu ........................................................................................................ 4-5 4.2.4.1 Plate-Plate Statistics....................................................................................... 4-6 4.2.4.2 Plate Reproducibility ..................................................................................... 4-7 4.2.4.3 Language........................................................................................................ 4-8 4.2.4.4 Configure Reader ........................................................................................... 4-8 4.2.4.5 Plate In ........................................................................................................... 4-9 4.2.4.6 Plate Out ........................................................................................................ 4-9 4.2.4.7 Read Calibration Plate ................................................................................... 4-9 MRX Revelation Manual iii Table of Contents 4.2.4.8 Selftest ......................................................................................................... 4-11 4.2.4.9 Spectrum ...................................................................................................... 4-12 4.2.4.10 Sample ID Entry ........................................................................................ 4-13 4.2.4.11 Results Font ............................................................................................... 4-16 4.2.4.12 Options....................................................................................................... 4-16 4.2.4.13 Password ..................................................................................................... 4-22 4.2.5 Window..................................................................................................................... 4-22 4.2.6 Help .......................................................................................................................... 4-23 4.3 The Tool Bar....................................................................................................................... 4-24 4.4 Status Bar............................................................................................................................ 4-26 Chapter 5 Running an Assay ............................................................................................ 5-1 5.1 5.2 5.3 5.4 Overview............................................................................................................................... 5-1 Powering up the System........................................................................................................ 5-2 Selecting the Assay Conditions............................................................................................. 5-5 To Initiate the Run ................................................................................................................ 5-8 Chapter 6 Generating and Editing Assays ...................................................................... 6-1 6.1 Overview............................................................................................................................... 6-1 6.2 Generating a New Assay - Assay Title Dialog Box............................................................... 6-2 6.3 The Reader Control Dialog Box ........................................................................................... 6-4 6.3.1 Configuration of the Tabs on the Reader Control Dialog Box ................................... 6-4 6.3.2 Reader Options Tab .................................................................................................... 6-6 6.3.2.1 Read Mode..................................................................................................... 6-6 6.3.2.2 Multi-Wavelength Mode................................................................................ 6-7 6.3.2.3 Wavelengths .................................................................................................. 6-7 6.3.2.4 Shake ............................................................................................................. 6-8 6.3.3 Start Mode - Start/Stop Mode Tab.............................................................................. 6-9 6.3.4 Kinetic Time Interval.................................................................................................. 6-9 6.3.5 Calculation Mode........................................................................................................ 6-9 6.3.6 Kinetic Graphs ............................................................................................................ 6-9 6.3.7 Agglutination Parameters............................................................................................ 6-9 6.3.8 Agglutination Options............................................................................................... 6-10 6.3.9 The Reader Control Dialog Box - Transmission Graphs Tab ................................... 6-10 6.4 Template Window............................................................................................................... 6-11 6.5 Blank Mode......................................................................................................................... 6-14 6.6 Quality Control Raw Data................................................................................................... 6-18 6.7 Threshold ............................................................................................................................ 6-19 6.8 Curve Fit ............................................................................................................................. 6-20 6.8.1 Introduction to Curve Fitting .................................................................................... 6-20 6.8.2 The Curve Fit Dialog Box - Fits Tab ........................................................................ 6-21 6.8.3 The Curve Fit Dialog Box - Standards Tab .............................................................. 6-21 6.8.4 The Curve Fit Dialog Box - Fit Type Tab ................................................................ 6-24 6.8.4.1 Calculation Options ..................................................................................... 6-27 6.8.5 The Curve Fit Dialog Box - Graph Tab .................................................................... 6-28 6.8.5.1 Horizontal Axis (Vertical Axis)................................................................... 6-29 6.8.6 The Curve Fit Dialog Box - Sample Selection Tab .................................................. 6-29 6.8.7 The Curve Fit Dialog Box - Dilutions Tab ............................................................... 6-30 6.8.8 The Curve Fit Dialog Box - Fit Q.C. Tab ................................................................. 6-32 6.8.9 The Curve Fit Dialog Box - Calculated Q.C. Tab..................................................... 6-34 6.8.10 The Curve Fit Dialog Box - Data Conversion Tab ................................................. 6-35 6.8.11 The Curve Fit Dialog Box - Results Flagging Tab ................................................. 6-36 6.8.12 Curve Fit - Output Format Tab ............................................................................... 6-38 6.9 Ratio.................................................................................................................................... 6-39 6.10 Spreadsheet ....................................................................................................................... 6-40 6.10.1 Spreadsheet Mode - Spreadsheet Tab ..................................................................... 6-40 6.11 Report Options .................................................................................................................. 6-41 6.12 Assay Options ................................................................................................................... 6-42 iv MRX Revelation Manual Table of Contents 6.12.1 6.12.2 6.12.3 6.13.4 Assay Options ......................................................................................................... 6-42 The Assay Options Dialog Box - Assay Statistics Tab........................................... 6-42 Assay Options Dialog Box - Processing Order Tab................................................ 6-43 Assay Options Dialog Box - Sample ID Setup Tab ................................................ 6-44 Chapter 7 Endpoint Analyses ........................................................................................... 7-1 7.1 Overview............................................................................................................................... 7-1 7.2 Generating an Assay for an Endpoint Analysis .................................................................... 7-2 7.3 Starting an Assay .................................................................................................................. 7-4 Chapter 8 Kinetic Analyses............................................................................................... 8-1 8.1 Overview............................................................................................................................... 8-1 8.2 Generating an Assay for a Kinetic Analysis ......................................................................... 8-2 8.2.1 Basic Assay Information............................................................................................. 8-2 8.2.2 Start/Stop Mode .......................................................................................................... 8-2 8.2.3 The Reader Control Dialog Box - Kinetic Time Interval ........................................... 8-3 8.2.4 The Reader Control Dialog Box - Calculation Mode Tab.......................................... 8-5 8.2.5 Kinetic Graphs Tab..................................................................................................... 8-8 8.3 Starting an Assay ................................................................................................................ 8-11 8.4 During the Assay................................................................................................................. 8-15 Chapter 9 Agglutination Analyses and TCG Mode......................................................... 9-1 9.1 Agglutination ........................................................................................................................ 9-1 9.1.1 Introduction to Agglutination Testing......................................................................... 9-1 9.1.2 The Agglutination Measurement ................................................................................ 9-1 9.1.3 Agglutination Calculations ......................................................................................... 9-4 9.1.4 Formula Calculation ................................................................................................... 9-4 9.1.5 Rules Calculation........................................................................................................ 9-5 9.1.6 Setting Rules and Formulae ........................................................................................ 9-5 9.2 Tissue Culture Growth (T.C.G) Measurements .................................................................... 9-6 9.2.1 Introduction to Tissue Culture Growth Measurements ............................................... 9-6 9.3 Generating an Agglutination Assay ...................................................................................... 9-7 9.3.1 Basic Assay Information............................................................................................. 9-7 9.3.2 The Reader Control Dialog Box - Start Mode Tab ..................................................... 9-7 9.3.3 The Reader Control Dialog Box - Agglutination Parameters Tab .............................. 9-8 9.3.4 The Reader Control Dialog Box - Agglutination Options Tab ................................. 9-11 9.3.5 The Reader Control Dialog Box - Transmission Graphs Tab ................................... 9-13 9.4 Starting an Assay ................................................................................................................ 9-14 9.5 During the Assay................................................................................................................. 9-18 Chapter 10 Incorporating Decision Making Protocols into the Assay ....................... 10-1 10.1 Overview........................................................................................................................... 10-1 10.2 Quality Control ................................................................................................................. 10-2 10.2.1 Role of Quality Control .......................................................................................... 10-2 10.2.2 Creating Quality Control Equations........................................................................ 10-4 10.2.3 Typical Equations ................................................................................................... 10-7 10.3 Threshold .......................................................................................................................... 10-8 10.3.1 The Threshold Dialog Box...................................................................................... 10-8 10.3.2 Threshold Equations Tab ........................................................................................ 10-9 10.3.2.1 ++++/+++/++/+/– Equations...................................................................... 10-9 10.3.3 The Pos/Neg Q.C. Tab .......................................................................................... 10-10 10.3.4 Threshold Q.C....................................................................................................... 10-12 10.3.5 Output Format....................................................................................................... 10-13 10.4 Curve Fit ......................................................................................................................... 10-16 10.4.1 Introduction to Curve Fitting ................................................................................ 10-16 10.4.2 Curve Fit Dialog Box - Calculated Q.C. Tab........................................................ 10-16 10.4.3 The Curve Fit Dialog Box - Data Conversion Tab ............................................... 10-17 MRX Revelation Manual v Table of Contents 10.4.4 The Curve Fit Dialog Box - Results Flagging Tab ............................................... 10-18 10.5 Ratio................................................................................................................................ 10-21 10.5.1 Ratio Equations..................................................................................................... 10-21 10.5.2 Ratio Dialog Box - Results Flagging Tab ............................................................. 10-23 10.6 Spreadsheet ..................................................................................................................... 10-24 10.6.1 Spreadsheet Dialog Box - Results Flagging Tab .................................................. 10-24 Chapter 11 Formating Reports and Exporting Data ..................................................... 11-1 11.1 Overview........................................................................................................................... 11-1 11.2 Laboratory Information..................................................................................................... 11-2 11.3 Report Options .................................................................................................................. 11-3 11.3.1 The Report Options Dialog Box - Report Layout Tab............................................ 11-3 11.3.2 The Report Options Dialog Box - Raw Data Tab ................................................... 11-4 11.3.3 The Report Options Dialog Box - Export to File Data Tab .................................... 11-6 11.3.3.1 ASCII Format ............................................................................................ 11-7 11.3.3.2 Sanguin ...................................................................................................... 11-8 11.3.3 Exporting Data Using Revelation........................................................................ 11-9 11.3.3.1 Retrieval of Data...................................................................................... 11-10 11.3.4 The Report Options Dialog Box – Header-Footer Tab ......................................... 11-10 11.4 The Event Log File ......................................................................................................... 11-11 Appendix A Using an External Computer .......................................................................A-1 A.1 Overview..............................................................................................................................A-1 A.2 The Personal Computer Configuration ................................................................................A-2 A.3 Interfacing the Computer to the MRX Reader ..................................................................A-3 A.3.1 Electrical and Communications Interface ..................................................................A-3 A.4 Installing the Software .........................................................................................................A-5 A.5 Setting the System Configuration ........................................................................................A-6 A.5.1 Selecting the External Configuration .........................................................................A-6 A.5.2 Setting System Parameters.........................................................................................A-8 A.5.2.1 The Reader Tab.............................................................................................A-8 A.5.2.2 The RS232 Tab .............................................................................................A-9 A.6 Differences Between Internal and External Operation.......................................................A-13 Appendix B Mathematical Relationships ........................................................................B-1 B.1 Overview ..............................................................................................................................B-1 B.2 Linear Regression.................................................................................................................B-2 B.3 Polygon Fitting.....................................................................................................................B-4 B.4 Quadratic, Cubic and Quartic Regression ............................................................................B-5 B.5 Cubic Spline Curve Fitting...................................................................................................B-7 B.6 Akima Fit .............................................................................................................................B-8 B.7 Extrapolation of Non-Linear Curves ....................................................................................B-9 B.8 Sigmoid Equation...............................................................................................................B-10 B.9 Michaelis-Menton Curve Fit ..............................................................................................B-11 B.10 Using Logarithmic Curve Fitting .....................................................................................B-13 B.10.1 Semi-Log Fit ..........................................................................................................B-13 B.10.2 Log-Log Fit ............................................................................................................B-13 Index...................................................................................................................................... I-1 vi MRX Revelation Manual Chapter 1 Introduction 1.1 Overview Chapter 1 Introduction 1.1 Overview The Revelation application program is used with the DYNEX Technologies MRX Microplate Absorbance Reader (Figure 1-1). This instrument is an automated microplate reader that is designed to automatically read the absorbance of 96-well plates in research and clinical applications. Figure 1-1 The DYNEX Technologies MRX Microplate Absorbance Reader MRX Revelation Manual 1-1 1.1 Overview Chapter 1 Introduction The reader is computer driven and includes Revelation application software to establish assays as well as to collect, process and report data in a format that meets the needs of the laboratory. An MS-DOS computer is integrated into the MRX optical compartment. The user plugs the mouse, keypad and printer into the instrument. Note… The MRX Reader can be interfaced to an external computer via an RS232 port. A discussion of use of the reader with external control is presented in Appendix A. 1-2 MRX Revelation Manual Chapter 1 Introduction 1.2 Modes of Operation and System Features 1.2 Modes of Operation and System Features Revelation provides the following modes of operation: ! Endpoint measurements - the reaction forming the chromophore is allowed to go to completion before the plate is read. The observed O.D. is used to determine the concentration of the compound of interest. ! Kinetic measurements - the reaction forming the chromophore takes place in the well. The change in O.D. as a function of time is used to determine the concentration of the compound of interest. ! Agglutination measurements - are used for monitoring cell growth, identification of bacteria and determining red cell types. Agglutination is caused by the addition of antibodies to the sample to fuse with the antigens on the cell surface. The O.D. is measured at different areas of the well to collect information about the cell. Features of the System include: ! Quick read times (less than 4 seconds for a 96 well plate) ! Dynamic Range -0.1 to 4.0 O.D. ! Excellent Linearity and Precision ! Built-in temperature control (optional) from ambient to 63 oC A verification plate (optional) is used to test for: ! Plate alignment (X-axis, Y-axis and Skew) ! Linearity of O.D. measurements ! Filter accuracy ! Optical channel matching ! Photometric accuracy MRX Revelation Manual 1-3 1.3 Principle of Operation Chapter 1 Introduction 1.3 Principle of Operation The reader is a filter photometer that measures the optical density of each well in a plate (Figure 1-2). SOURCE FILTER PLATE DETECTOR Figure 1-2 Block Diagram of Reader Components The source is a 75 W Tungsten-Halogen lamp that provides a wavelength range from 340 to 850 nm. The filter selects the wavelength used for the measurement. Up to six different filters can be installed in the system so that you can measure a broad range of different types of assays. The detector measures the amount of light that is transmitted through each well. Since wells can contain samples, blanks or standards, concentration of the compound of interest can be determined by Beer’s Law (equation 1-1). O.D. = -k log (Io /I) = k log abc 1-1 Where: O.D. is the optical density k is the absorptivity coefficient. Io is the intensity of light when a blank is read I is the intensity of light when the sample is read a is a constant that is dependent on the nature of the compound b is the path length (which is constant for all samples) c is the concentration of the compound of interest The system determines the constant a by measuring the O.D. for standards and then uses that value to determine the concentration of the compound of interest in the samples from the O.D. reported for the samples. 1-4 MRX Revelation Manual Chapter 1 Introduction ® 1.4 MRX Revelation TM Application Software 1.4 MRX® RevelationTM Application Software The MRX Revelation application software is a Microsoft® Windows® 95/98/NT application that is used for general system control, data acquisition, data processing, data storage and reporting. The program follows general Windows protocols. Note… There are small differences in the mode of operation between the use of an external computer and an internal computer. The body of this manual describes the use of an internal computer. A discussion of the use of an external computer is presented in Appendix A. Operation of Revelation includes two types of commands: ! General system commands - which are used to set parameters that are global in nature (e.g. configure the reader) or perform basic operations (e.g. moving the plate in or out of the reader). ! Commands that are specific to a given analytical procedure - these commands are incorporated into an assay. To employ an assay, the user accesses it and then runs it. In this manual, we will assume that the user is familiar with the general mode of Windows operation. For the sake of brevity, this manual will not describe: ! Standard Windows operations (e.g. it will be assumed that the OK button on a dialog box will perform the desired operation). ! Windows dialog boxes that perform standard Windows operations (e.g. the Open dialog box is similar to that employed with other Windows programs). MRX Revelation Manual 1-5 1.5 Contents of this Manual Chapter 1 Introduction 1.5 Contents of this Manual This manual is divided into two sections: Basic Operation of the Reader Using Revelation Software describes how the system is used on a routine basis to collect data using an existing assay. ! Installation (Chapter 2) describes how the software is configured to meet the needs of the laboratory and includes a quick test to ensure that it is working in an acceptable manner. ! The Main Window (Chapter 3) introduces the user to the operating program, describes the contents of the Main Window and explains how you navigate between various elements of the program. ! Commands (Chapter 4) describes the command structure of the program ! Running an Assay (Chapter 5) discusses the steps used to initiate an assay and the nature of the report that is generated. Generating an Assay, Reporting and Exporting Data describes how the analyst develops an assay to collect, process and report analytical data. In addition, this section describes how data reports can be generated and how data can be ported to external programs. ! General Assay Information (Chapter 6) describes the structure of an assay and the role of the Assay Wizard, which leads the analyst through the generation of an assay. ! Endpoint Analyses (Chapter 7) discusses the details of the generation of an assay for an endpoint analysis. ! Kinetic Analyses (Chapter 8) discusses the details of the generation of an assay for a kinetic analysis. ! Agglutination Analyses (Chapter 9) discusses the details of the generation of an assay for an agglutination analysis. ! Incorporating Decision Making Protocols into the Assay (Chapter 10) describes how you can develop protocols to determine and report acceptable (unacceptable) data in the report. ! Generating Reports and Exporting Data (Chapter 11) explains how you can customize the report format and export data to an external program. Appendices which describe use of the reader with an external computer, and a mathematical discussion of data reduction are included. In addition to the printed manual, an extensive on-line help system is included with the program. Context sensitive help can be obtained by pressing F1 or pressing the Help button on a dialog box. 1-6 MRX Revelation Manual Chapter 2 Getting Started 2.1 Overview Chapter 2 Getting Started 2.1 Overview This section describes how to power up an MRX® Reader with RevelationTM application software. The application software is loaded on the hard drive of the internal computer and the system will automatically start Revelation when the reader is powered up. If the system includes an external computer, refer to Appendix A. MRX Revelation Manual 2-1 2.2 Powering Up the System Chapter 2 Getting Started 2.2 Powering Up the System To Power the System Up: 1 Make sure that the instrument is switched off. The power switch is ON when it is flush with the front panel and OFF when it stands out from the panel. 2 Turn on the power switch for the printer and verify that the printer completes its selftest successfully. 3 Turn on the power switch on the front panel of the MRX reader. 4 Click on the Revelation icon on the Windows desktop. 5 The monitor will present a welcome screen and the Reader Serial Number dialog box (Figure 2-1). Enter the serial number and press OK. Figure 2-1 The Reader Serial Number Dialog Box 6 A series of self tests will be automatically performed and the results will be indicated in the workspace of the Revelation screen. The self-test checks the items indicated in Table 2-1 and a sample report is presented in Figure 2-2 (the report is presented in the workspace of the main Revelation window, which is described in Chapter 3). Note… When the reader is operating under the control of an internal computer, the keypad on the front panel reader will not operate. 2-2 MRX Revelation Manual Chapter 2 Getting Started 2.2 Powering Up the System Table 2-1 Self Test Diagnostics Test Action A/D Status Begins conversion and checks that the status line goes high and low. Verifies that hardware can be detected and chosen. Plate Motor Moves the plate to Out position and then to the In position. Verifies that the plate carrier position sensors are operating correctly. Checks motor and sensors. Background Light Checks for light leakage into the reading compartment. Bulb Verifies that current is flowing through the bulb when it is switched on. Checks that the bulb has not blown. Filter Motor Moves the filter motor to the first position. Checks the filter motor and optical alignment. Transmission Levels Verifies that all fibers are capable of transmitting at least 33% of the maximum transmission level. Checks for blocked channels or broken diodes. Filters Checks that gains can be selected for all filters. Checks for damaged or missing filters. SELF-DIAGNOSTIC SEQUENCE Reader Serial # 2CXC2549 Date Time Test Test Test Test Test Test Test 1 2 3 4 5 6 7 : : : : : : : : : Technologist: 2/17/01 11:15:02 AM A/D Plate motor Background light levels Bulb Filter motor Transmission levels Filters Pass Pass Pass Pass Pass Pass Pass Self-Diagnostic Summary Reader Status : Ready Figure 2-2 Sample Self-Test Report MRX Revelation Manual 2-3 2.2 Powering Up the System Chapter 2 Getting Started We recommend that you print a copy of the report on a periodic basis (e.g. once a month) by selecting the Print command on the File menu and save the reports to monitor the performance of the reader on a long-term basis. 7 Check that the time and date is properly indicated on the report. If the time/date are not correct, click on the time on the bottom right corner to present the Date/Time Properties dialog box (Figure 2-3) and edit these parameters as appropriate. Figure 2-3 Date/Time Properties Dialog Box 8 The system is now ready to collect data. 2-4 ! If this is the initial use of the system, or it is necessary to change the system configuration (e.g. you have installed a new filter) refer to Section 2.3. ! If you want to use the verification plate to check the system, see Section 2.4; otherwise continue to Chapter 3. MRX Revelation Manual Chapter 2 Getting Started 2.3 Setting the System Configuration 2.3 Setting the System Configuration 2.3.1 Setting the Reader Type If this is an initial installation or you want to change various configuration parameters, select Configure Reader on the Utility menu to present the Reader Type dialog box (Figure 2-4). You MUST close out of Self-Test, all assays and all data screens, so that only the top task bar is showing with the rest of the window blank before Revelation will allow you to chose the correct reader type and then change the activate the setup button. Figure 2-4 The Reader Type Dialog Box Select the reader type Internal MRX and press Setup to access the Setup Internal MRX dialog box (see Section 2.3.2). 2.3.2 Configuring an Internal MRX® Reader Once the parameters have been set, it will not be necessary to configure the system unless you need to change a parameter. To access the Setup Internal MRX dialog box (Figure 2-5), highlight Internal MRX and press Setup. Note… If this is an original installation, a message will be presented to alert the user to enter an integer between 2 and 6 (instead of the above dialog box). This message is used to indicate that the present value for the Number of Filters field is not valid and must be edited. Click OK to access the dialog box (which will include the value of 0 for the Number of Filters field). MRX Revelation Manual 2-5 2.3 Setting the System Configuration Chapter 2 Getting Started 2.3.2.1 The Reader Tab The Setup Internal MRX dialog box - Reader tab is presented in Figure 2-5. Figure 2-5 The Setup Internal MRX Dialog Box Filters Indicate the number of filters that you have installed in the reader. The corresponding number of filter fields will be activated and you can enter the wavelength for each filter. Note… Filters must be installed in increasing order. If desired, the other options on this dialog box can be set at this point (they can be set at any time). Data Conversion OVER Limit The OVER limit entry is used to create an upper and lower range for expected readings. For example, if you enter an OVER limit of 3.500, RevelationTM will classify any readings above 3.500 as OVER and any readings below –0.100 as UNDER. 2-6 MRX Revelation Manual Chapter 2 Getting Started 2.3 Setting the System Configuration OVER/UNDER Conversion If O.D. values fall outside the OVER or UNDER limits, they cannot be passed to QC equations (see Section 10.2) unless they are converted into numerical values. If you wish to convert OVER or UNDER readings into values that can be input into quality control equations, check this box. OVER Value Enter the value that all OVER values will be converted to (this field is active only if you checked the OVER/UNDER Conversion box). The range is from 0.000 to 9.999. UNDER Value Enter the value that all UNDER values will be converted to (this field is active only if you checked the OVER/UNDER Conversion box). The range is from - 9.999 to 0.000. Miscellaneous Options Repeatability Mode The value for Repeatability Mode indicates the number of times RevelationTM will read each individual well. If the value is greater than 1, Revelation will average the repeated readings into a single result for each well. This means that the result is slightly more accurate, but it does lengthen the reading time significantly. The range is from 1 (no repeats) to 4. Sleep Mode The sleep mode interval determines how long the plate carrier can be left out before it is automatically retracted. Automatic retraction prevents the plate carrier from collecting dust and being damaged. It will not work if the reader failed any part of its self-test. The range is 0 minutes (no automatic retraction) to 32767 minutes. 2.3.2.2 The Maintenance Tab The Setup Internal MRX dialog box - Maintenance tab is presented in Figure 2-6. MRX Revelation Manual 2-7 2.3 Setting the System Configuration Chapter 2 Getting Started Figure 2-6 The Setup Internal MRX Dialog Box - Maintenance Tab Self Test The Print Self-Test check box is used to indicate that the self-test report is automatically printed. The Retest Before Every Read check box is used to indicate that the self-test should be performed prior to reading the plate. This provides greater assurance that the data is valid, but is time consuming. Maintenance Frequency The Maintenance Frequency region is used to allow the user to indicate how often the maintenance reminder is displayed on power up. Click the desired radio button. Maintenance procedures are described in the MRX® manual. 2-8 MRX Revelation Manual Chapter 2 Getting Started 2.3 Setting the System Configuration 2.3.2.3 The RS232 Tab The Setup Internal MRX dialog box - RS232 tab (Figure 2-7) is generally not used for internal computer systems. If you install an external computer, click the Enabled check box to activate the various selections, then configure the computer communications mode that you will use (See Appendix A). The Default button selects the configuration that is most frequently employed for serial communication. Note… Make certain that the COM port assignment does not conflict with any other serial port assignment on the computer. Figure 2-7 The Setup Internal MRX Dialog Box - External RS232 Tab Set the appropriate transmission parameters. The Default button selects the configuration that is most frequently employed for serial communication. Note… Make certain that the COM port assignment does not conflict with any other serial port assignment on the computer. MRX Revelation Manual 2-9 2.4 Initial Testing of the System Chapter 2 Getting Started 2.4 Initial Testing of the System An MRX® is ready to operate after the self-test has been completed and you have set-up the system. To verify that the system is functioning properly, DYNEX Technologies offers a verification plate accessory, at an additional charge (part number 20098-visible range) which can be used as described below. The optional verification plate (which is used to check that various aspects of the system conform to specifications) consists of neutral density filters and colored glass filters that extend over one or more wells. A test plate is used to carry out the following tests and can be used as an external source of verification that the MRX is performing according to manufacturer specifications. 2-10 ! Alignment: Consists of three alignment checks, X-alignment; Y-alignment; and Skew, which are directions of movement of the plate carrier. An instrument passes this test if the x-alignment is +/-0.6mm, y-alignment is +/- 0.8mm, skew is +/-0.8mm. ! Linearity: An area of a test plate is set aside for a series of wells that should (in theory) give a straight line plot of O.D. against concentration. The Linearity test measures the deviation of these O.D. readings from this straight line. To determine Linearity, Revelation calculates the slope, y-intercept and t-value of the line (where tvalue is a statistical measure of how well the plate readings match the theoretical straight line). High t-values indicate good linearity at high O.D.s; low t-values indicate that the instrument will only have good linearity at low O.D.s. An instrument passes this test if the t-value for each filter is greater than or equal to 8.61 (for filters that transmit wavelengths above 400 nm). ! Filter Test: This test verifies proper filter installation in the filter holder. This test only determines an incorrect filter set-up if the filters installed in an instrument differ by more than 60 nm from the filter test wells on the plate. The data will indicate if a filter is failing. ! Optic Channel Matching: Readings are taken for each optical channel and are compared with each other to check for consistent performance. The printout will indicate if this test produces a failure. An overall test summary will be given. ! Accuracy: Determines if an instrument is within specification by comparing the readings with pre-determined factory values (printed on the test plate calibration certificate included with every plate at time of manufacture or yearly re-certification). The values in the plate data should be compared to those on the certificate of calibration. MRX Revelation Manual Chapter 2 Getting Started 2.4 Initial Testing of the System To use the Verification Plate: 1 Select Plate Out on the Utility menu. The plate carrier is ejected from the instrument. 2 Insert the 12-way verification plate into the plate carrier, with the numbers on the white tag on the left, arrow pointing up. 3 Select Read Calibration Plate from the Utility menu. RevelationTM presents the system password dialog box. Enter the password (the default password is DYNEX) and press OK. 4 The Calibration Plate dialog box (Figure 2-8) will be presented. This dialog box is used to verify the serial number of your MRX® reader and the serial number of the 12-way verification plate you will be using. Make any changes in either serial number. Figure 2-8 The Calibration Plate Dialog Box 5 Click the Read Plate button. A dialog box indicating "Status" with the message "Checking Alignment" will be presented. The plate carrier will move at 4 times less than its normal speed into the optical reading chamber. 6 After the alignment tests are completed, the message "Reading (wavelength x)", which will show all filter wavelengths being checked will be presented. 7 When Revelation is finished reading the verification plate, the plate carrier will be ejected, and a report with data with pass/fail notations will be presented (e.g. Figure 2-9). MRX Revelation Manual 2-11 2.4 Initial Testing of the System Chapter 2 Getting Started Figure 2-9 Test Report 2-12 MRX Revelation Manual Chapter 3 Introduction to the Operating Program 3.1 Overview Chapter 3 Introduction to the Operating Program 3.1 Overview The RevelationTM operating program controls all aspects of the DYNEX Technologies MRX® Microplate Reader. This chapter describes the overall structure of the program and explains how the program is used. Other chapters in this manual describe the use of the program from an operational perspective and will show how you can run an assay, process stored data and perform a variety of other operations. MRX Revelation Manual 3-1 3.2 Conventions in this Manual Chapter 3 Introduction to the Operating Program 3.2 Conventions in this Manual This program is a Microsoft® Windows® application and closely follows the general approach of commonly used Windows applications. In this manual, we assume that the reader has some general understanding of the use of Windows. For the sake of clarity and brevity, we have employed the following conventions: 1 We will mention (but will not describe) dialog boxes that have a format that is similar to that of commonly used Windows applications such as Microsoft Word. As an example, the Open dialog box allows the operator to select a broad range of files including Assay Files (*.asy), Plate Files (*.dat), Spectrum Files (*.spc), Self Tests (*.tst), Sample ID Files (*.sid) and Event Logs (*.log). The desired file is selected in the same manner as other Windows files (e.g. Microsoft Word). 2 We will not describe standard Windows commands such as OK, Cancel, Apply and Open unless they provide a unique feature in the program. 3 Standard Windows operations will not be described. These include: • Selection of the order of items in a list via the Move Up and Move Down buttons • In some dialog boxes (e.g. the selection of Report Options, Figure 3-1), a list of all options is present in a field (the Check list field). The operator can select the desired items via the Add button or Add All button to place them in a list (the Check list field). In the same vein, items can be deselected by the Remove or Clear button. 3-2 MRX Revelation Manual Chapter 3 Introduction to the Operating Program 3.2 Conventions in this Manual Figure 3-1 The Reader Options Dialog Box – Report Layout Tab • Commands will be indicated in bold face, while dialog boxes and fields within a dialog box will be indicated in italics. 4 In some dialog boxes, the commands are organized in a region that relates to a specific task. As an example, Figure 3-2 includes boxes around parameters that relate to the Read Mode, Multi-Wavelength Mode, etc. In this manual, these regions will be called out by an underline (e.g. Read Mode) and each of the commands (selections, etc) in the region will be indicated in bold face and described immediately below the descriptor of the region. MRX Revelation Manual 3-3 3.2 Conventions in this Manual Chapter 3 Introduction to the Operating Program Figure 3-2 The Reader Control Dialog Box - Reader Option Tab The Reader Control dialog box will be described as follows: Read Mode ! Single/Dual Wavelength - used to collect … ! Multi-Wavelength - used to collect … ! Agglutination/T.G.C. - used to collect … Multi-Wavelength Mode ! Linear Regression - describes how data is processed… 5 There are several configurations of the system. Some features are optional and are not included in all system configurations (e.g. Agglutination). This manual describes a “complete” program and indicates when a feature is available only in some configurations. 6 Some features are not active in a given situation (e.g. the radio buttons in the MultiWavelength Mode region are not active unless a previous command has been selected (Multi-Wavelength in Read Mode). 7 Some dialog boxes include tabs (e.g. Figure 3-1) and edits can be made on various tabs. Any change to the parameters will not be entered until the OK button is pressed to close the dialog box (simply moving to another tab will not enter the data). 3-4 MRX Revelation Manual Chapter 3 Introduction to the Operating Program 3.3 The Main Window 3.3 The Main Window The Main window of the program is presented in Figure 3-3. TITLE BAR MENU BAR TOOL BAR WORKSPACE STATUS BAR Figure 3-3 The Main Window The Main Window includes: ! Title Bar - indicates the name of the assay and its path. ! Menu Bar - contains a series of drop down menus that contain commands (Section 4.2). ! Tool Bar - icons that serve as short cuts for commonly used commands and assays (Section 4.3). ! Workspace - region for display of dialog boxes and data (when the program is opened, the workspace will be empty). ! Status Bar - indicates the present status of the system (Section 4.4). MRX Revelation Manual 3-5 3.4 File Types Chapter 3 Introduction to the Operating Program 3.4 File Types A number of file types are associated with the RevelationTM program. Some files (e.g. the assay file is user generated, while others are automatically created/edited by the operating system. Each file type can be opened via the Open dialog box, accessed from the File menu. 1 Assay files (*.asy) - An assay file include the complete description of the protocol that should be used when a series of samples is analyzed. The assay file includes data collection, data processing and reporting parameters. A detailed discussion of the assay is presented in Chapters 6-11. 2 Plate Data files (*.dat) - A plate data file contains the analytical results from a given plate. These files cannot be edited. 3 Spectrum files (*.spc) - A spectrum file contains data obtained from absorbtion measurements at different wavelengths (see Section 4.2.4.9) and is used to find the optimum wavelength for a given analysis. 4 Self Test files (*.tst) - A self test file is the report that is generated when the instrument is powered up. The file can be saved by the user via the Save (Save As) command. It is worthwhile to save these files as an ongoing demonstration that the system is working on an acceptable basis. 5 Sample ID files (*.sid) - A Sample ID file presents the information that you have used to define a sample ID (see Section 6.1.3.4). This file is not editable from this screen. 6 Event Log files (*.log) - An event log file is automatically generated every time the system is powered up and includes a list of all activities. The file name is created from the date and the number of times that the system has been powered up on that day (e.g. 03010101 refers to the first time the system was powered up on March 1, 2001). 3-6 MRX Revelation Manual Chapter 4 Commands 4.1 Overview Chapter 4 Commands 4.1 Overview The RevelationTM menu bar is used to access all commands that are included in the program. Two types of commands are provided: ! General system commands - which are used to set parameters that are global in nature (e.g. configure the reader) or perform basic operations (e.g. moving the plate in or out of the reader). ! Commands that are specific to a given analytical procedure - these commands are incorporated into an assay. To employ an assay, the user accesses it and then runs it. This chapter describes the various commands that are included in the program. Chapter 5 describes how the commands are used to perform a series of analyses using an assay, while Chapter 6-10 describes how an assay is generated. MRX Revelation Manual 4-1 4.2 The Menu Bar Chapter 4 Commands 4.2 The Menu Bar 4.2.1 The File Menu The File menu (Figure 4-1) includes a variety of commands related to opening, generating and executing assays. Figure 4-1 The File Menu 4.2.1.1 New Assay New Assay accesses the Assay Type dialog box (Figure 4-2), which is used to select the desired type of assay. Figure 4-2 Assay Type Dialog Box 4-2 MRX Revelation Manual Chapter 4 Commands 4.2 The Menu Bar ! Endpoint measurements - the reaction forming the chromophore is allowed to go to completion (or may be stopped) before the plate is read. The observed O.D. is used to determine the concentration of the compound of interest. ! Kinetic measurements - the reaction forming the chromophore takes place in the well. The change in O.D. as a function of time is used to determine the concentration of the compound of interest. When an assay type is selected, the temporary name Assayx (where x is the lowest unused number, e.g. Assay1) is assigned. The default conditions for the selected assay type are set and the assay is displayed in the workspace (Figure 3-3). The conditions for the assay can be changed as described in Chapter 6-11. 4.2.1.2 Open Open presents a standard Windows dialog box which is used open various file types including Assay Files (*.asy), Plate Files (*.dat), Spectrums (*.spc), Self Tests (*.tst), Sample ID Files (*.sid) and Event Logs (*.log). The desired file is selected in the same manner as other Windows files (e.g. Microsoft Word). 4.2.1.3 Close Close shuts the open file (e.g. the Assay file). If any changes have been made to the file, the user will be prompted to save the changes. 4.2.1.4 Save Assay Save Assay is used to save the active assay using the present name. It is active only when you have made a change to the active assay and should be employed before you run an assay that you have edited. 4.2.1.5 Save Assay As Save Assay as presents a standard Windows Save As dialog box to allow the user to assign a name to the file (rather than the default name). In addition, it can be used to assign a new name to an assay that has been edited. An assay that has been edited should be saved before it is used. MRX Revelation Manual 4-3 4.2 The Menu Bar Chapter 4 Commands 4.2.1.6 Import Import presents the Import Data Files dialog box, which is used to import a file from an external software package. If the reader is connected to a sample preparation device, the program can periodically interrogate the device software for sample IDs or data files. This feature is initiated via the Polling button that presents the Define Polling Options dialog box (Figure 3-6). Check the Enable Polling box, type in the anticipated location of the file(s) and enter a polling interval (1 - 30000 minutes). Figure 4-3 The Define Polling Options Dialog Box 4.2.1.7 Run Plate Run Plate initiates the run using the active assay. A detailed description of how an assay is run is presented in Chapter 5. 4.2.1.8 Print Print presents the Print dialog box that is used to select the print conditions (the nature of this dialog box is dependent on the printer connected to the system). 4.2.1.9 Print Preview Print Preview displays the report on the monitor. 4.2.1.10 Print Setup Print Setup presents the Print Setup dialog box (the nature of this dialog box is dependent on the printer connected to the system). 4-4 MRX Revelation Manual Chapter 4 Commands 4.2 The Menu Bar 4.2.1.11 Exit Exit closes the program. If you have made any changes to the assay, a dialog box will be presented to ask if you want to save the changes. Note… The last four assays that have been accessed are presented on the File menu for convenience in retrieving recently used assays. 4.2.2 The Settings Menu The Settings menu is activated when an assay has been opened (either an existing assay or a new assay) and is used to generate/edit the assay protocol. A detailed description of the Settings menu is presented in Chapters 6-11. 4.2.3 The View Menu The View menu (Figure 4-4) is used to configure the Main window. Figure 4-4 The View Menu The Toolbar and the Status bar can be presented on the Main window by clicking on the appropriate command. When the item is selected, a checkmark is placed to the left of the command. A typical status bar is described in Section 3.6. 4.2.4 The Utility Menu The Utility Menu (Figure 4-5) is used to access a variety of commands that relate to system configuration, system testing, etc. MRX Revelation Manual 4-5 4.2 The Menu Bar Chapter 4 Commands Figure 4-5 The Utility Menu Note… If an external reader is used, the Plate In, Plate Out, Read Calibration Plate and Selftest entries are not presented. 4.2.4.1 Plate-Plate Statistics Plate-Plate Statistics presents the Plate-Plate Statistics dialog box (Figure 4-6), which is used to compare data from one plate to data from another plate and use the plate data from one test with the data processing options of another test. The Plate-Plate statistics command allows you to compare plate data to find out the mean, standard deviation, coefficient of variation and standard error mean for designated types or areas of wells. Figure 4-6 The Plate-Plate Statistics Dialog Box 4-6 MRX Revelation Manual Chapter 4 Commands 4.2 The Menu Bar Assay The information in data files is stored as raw Endpoint data or Kinetic data. When you open a file, the program provides the option of processing the data using the assay that was originally run to create the file or via another assay. Use Original Assay - opens all the data files on the checklist using the original assays that were used to create them. Select New Assay - lets you open a file and process the data using the blanking options and calculation mode options from a different assay. Note… RevelationTM cannot reprocess an Endpoint data file using a Kinetic assay, or a non-Agglutination data file using an Agglutination assay. Plates Select lists all of the data files in the active directory. Check list includes the data files that have been selected for the statistical analysis. To compare a set of plates: 1 Select the plate data file. 2 Click Select New Assay and select the new assay you want to use. 3 Click OK. The program will open each data file and calculate the results using the blanking options and calculation mode options of the new assay. It will then calculate the mean, standard deviation, standard error mean and coefficient of variation for these results and display them on the screen. 4.2.4.2 Plate Reproducibility Plate Reproducibility presents the Plate Reproducibility dialog box (Figure 4-7), which allows you to run a plate several times and check the reproducibility of results for each well. MRX Revelation Manual 4-7 4.2 The Menu Bar Chapter 4 Commands Figure 4-7 The Plate Reproducibility Dialog Box Number of readings refers to the number of times the test should be performed. The default value (20) is a reasonable value. Test (Ref) Wavelength refers to the test filter wavelength and the reference filter wavelength (if employed). The installed filters can be viewed via the drop down list (an asterisk indicates that no filter is employed). To begin the operation, click OK (or press Enter on the keyboard). The program will read the plate and calculate a mean, standard deviation and coefficient of variation value for each well and for each the readings. The individual well results are displayed as a matrix showing either the mean, the standard deviation (SD) or the coefficient of variation (CV). You can switch between these viewing modes using the View menu. The mean, SD and CV values for all the plates are shown below the matrix. 4.2.4.3 Language Language presents a dialog box to be used to select the choice of language. At the present time, English is the only option. This option is presented only if no assays are open. 4.2.4.4 Configure Reader ! If no assays are open (e.g. the system has just been powered up and the initial selftest is closed), the Reader Type dialog box (Figure 4-8) is presented; the user should check that the appropriate system type is selected and then press Setup. Figure 4-8 The Reader Type Dialog Box 4-8 MRX Revelation Manual Chapter 4 Commands 4.2 The Menu Bar The Setup button accesses the Configuration Information dialog box. This dialog box is described in Section 2.7 (these parameters are normally set during installation and rarely changed once they are established). ! If an assay has been opened, the Configuration Information dialog box is presented. This dialog box is described in Section 2.7 (these parameters are normally set during installation and rarely changed once they are established). 4.2.4.5 Plate In Plate In draws the plate into the reader. 4.2.4.6 Plate Out Plate Out ejects the plate from the reader. 4.2.4.7 Read Calibration Plate Read Calibration Plate performs the system calibration using the 12-way verification plate (optional). Role of the Calibration Plate The Calibration plate consists of neutral density and colored glass that extend over one or more wells which are used to carry out five different tests: Alignment, Linearity, Filter Test, Optical Channel Matching, and Accuracy. A verification plate is used as an external source of verification that the MRX® is performing according to manufacturer specifications. Alignment: Consists of three alignment checks, X-alignment; Y-alignment; and Skew, which are directions of movement of the plate carrier. An instrument passes this test if the x-alignment is +/-0.6 mm, y-alignment is +/- 0.8 mm, skew is +/-0.8 mm. Linearity: An area of a test plate is set aside for a series of wells that should (in theory) give a straight line plot of O.D. against concentration. The Linearity test measures the deviation of these O.D. readings from this straight line. To determine Linearity, RevelationTM calculates the slope, y-intercept and t-value of the line (where t-value is a statistical measure of how well the plate readings match the theoretical straight line). High t-values indicate good linearity at high O.D.; low t-values indicate that the instrument will only have good linearity at low O.D. An instrument passes this test if the t-value for each filter is greater than or equal to 8.61, for filters that transmit wavelengths above 400 nm. MRX Revelation Manual 4-9 4.2 The Menu Bar Chapter 4 Commands Filter Test: This test verifies proper filter installation in the filter holder. This test only determines an incorrect filter set-up if the filters installed in an instrument differ by more than 60 nm from the filter test wells on the plate. The data will indicate if a filter is failing. Optic Channel Matching: Readings are taken for each optical channel and are compared with each other to check for consistent performance. The print-out will indicate if this test produces a failure. An overall test summary will be given. Accuracy: Determines if an instrument is within specification by comparing the observed readings with pre-determined factory values (printed on the test plate calibration certificate included with every plate at time of manufacture or yearly recertification). The values in the plate data should be compared to those on the certificate of calibration. b) The Calibration Protocol To use the calibration plate: 1 Select Plate Out on the Utility menu to drive the plate carrier from the instrument. 2 Insert the 12-way verification plate into the plate carrier, with the numbers on the white tag on the left, arrow pointing up. 3 Select Read Calibration Plate on the Utility menu. 4 The Password pop - up box will be presented to allow the user to enter the system password (the default password is DYNEX and can be changed as described in Section 4.2.4.14). 5 The Calibration Plate pop - up box will be presented, which is used to indicate the serial number of your MRX® reader and the serial number of the 12-way verification plate you will be using. Make any changes in either serial number. 6 Click Read Plate. The Status pop-up box will be presented with the message Checking Alignment. The plate carrier will move at 4 times less than its normal speed into the optical reading chamber. The message Reading (wavelength x)), will then appear, which will show all filter wavelengths that are being checked. When Revelation is finished reading the verification plate, the plate carrier will come out and data with pass/fail notations will be presented (Figure 4-9). 4-10 MRX Revelation Manual Chapter 4 Commands 4.2 The Menu Bar Figure 4-9 The Verification Report 4.2.4.8 Selftest Selftest performs the self-diagnostic sequence and presents the results in the workspace (Figure 4-10). MRX Revelation Manual 4-11 4.2 The Menu Bar Chapter 4 Commands SELF-DIAGNOSTIC SEQUENCE Reader Serial # 2CXC2549 Date Time Test Test Test Test Test Test Test 1 2 3 4 5 6 7 : : : : : : : : : Technologist: 2/17/01 11:15:02 AM A/D Plate motor Background light levels Bulb Filter motor Transmission levels Filters Pass Pass Pass Pass Pass Pass Pass Self-Diagnostic Summary Reader Status : Ready Figure 4-10 Sample Self-Test Report 4.2.4.9 Spectrum Spectrum is used to produce a spectral response curve for a specified well and suggests appropriate test and reference filter wavelengths. When this option is selected, the Spectral Response Curve dialog box (Figure 4-11) is presented. Figure 4-11 The Spectral Response Curve Dialog Box The operator should enter the well location that should be used. When OK is pressed, the program reads the well using all the installed filters and then displays the spectral response curve with suggested test and reference filters. A typical report is shown in Figure 4-12. Note… At least two filters must be installed for this test 4-12 MRX Revelation Manual Chapter 4 Commands 4.2 The Menu Bar Figure 4-12 Spectrum Report 4.2.4.10 Sample ID Entry Sample ID Entry - Sample ID files are stored in the SID directory by default and are identified by the .SID file extension. When you run a plate, the program can be set up to automatically search for a sample ID file to attach to the data. For this to work, the sample ID file must have the same name as the plate ID. The Sample ID Entry dialog box is presented in Figure 4-13. MRX Revelation Manual 4-13 4.2 The Menu Bar Chapter 4 Commands Figure 4-13 The Sample ID Entry Dialog Box Plate ID The Plate ID fields are used to identify the plates that can be used. A number of plate ID’s can be identified. When a plate type is saved, via the Save button, it will be indicated in the large box as shown above. Plates can be saved, deleted, etc. As an alternative, click Barcode to scan the barcode on the microplate (if a barcode reader is present). ! Delete removes the currently open SID file that is shown in the Enter Plate ID box. Click on Delete to delete this SID file. ! Delete All removes all SID files. ! Import presents a dialog box to import a file from an external system (Figure 3-4). After the file type has been selected, a dialog box is presented to allow for selection of the specific file (see Section 4.2.16). Note… Revelation may not be able to import files from external software if they do not follow certain file format conventions. 4-14 MRX Revelation Manual Chapter 4 Commands 4.2 The Menu Bar Sample ID Sample IDs can be assigned in two different ways: ! By well: Revelation displays all the wells and you can assign sample IDs to as many of the wells as desired. ! By sample: The program displays the assay template, sample by sample and you can assign IDs to as many of these as you want. To use this option check the Use assay template box, (see Use Assay Template, below). The Sample IDs list box contains two columns. The left column shows the well locations or sample ID’s (depending on how you are assigning ID’s), and the list on the right shows the assigned sample ID’s. By default, Revelation assigns the IDs as T1-96. To change an ID, click on the ID, type a new ID into the Enter Sample ID box and then press the Enter button on the keyboard. Sample IDs may be any number of characters in length, but in printouts or results in matrix format, long sample IDs will be shortened to fit into the available space. Use Assay Template is used to enter the ID’s on a sample by sample basis, as opposed to a well by well basis. The program will change the list on the right of the sample IDs list box to show samples instead of well locations. By default, the program displays a list of 96 test samples. To change to a different assay template, click on Change Assay. Revelation displays the Open dialog box, allowing you to select the required assay. Auto Increment is used to automatically increment the sample IDs. To use this option: 1 Highlight the sample ID where you want to begin incrementing. 2 Check the Auto Increment box. 3 Type the first sample ID into the Enter Sample ID box and then press the Enter key on the keyboard. Each time you press Enter, the cursor will move down one sample ID and increment the end number. 4 When the sample IDs are correct, click on OK. If you have made changes to any of the sample ID files without saving them, the program will prompt you if you wish to save or lose these changes. MRX Revelation Manual 4-15 4.2 The Menu Bar Chapter 4 Commands 4.2.4.11 Results Font The Font dialog box (Figure 4-14) is used to select the desired Font, Font Style, Font Size, etc. for the report. This is a standard Windows dialog box and Windows fonts will be presented (additional fonts may be presented if other programs are loaded on the computer). Figure 4-14 The Font Dialog Box 4.2.4.12 Options The Options dialog box (Figure 4-15) is used to allow the operator to customize a number of features. 4-16 MRX Revelation Manual Chapter 4 Commands 4.2 The Menu Bar Figure 4-15 The Options Dialog Box - Buttons Tab 1 Buttons Tab The Buttons tab is provided to assign a short-cut button for an assay. The button(s) will appear directly below the tool bar. To create a short-cut assay button: 1 Click Enabled. 2 Enter the name of the desired button (e.g. 111) in the Button Text field. The name will be presented in the highlighted line of the Buttons field as you enter the name. 3 Click Select to access the Select Assay/Worklist dialog box that is used to select the assay for which the button should refer. 4 Select the desired assay (e.g. Assay 2) and click Open on the Select Assay/Worklist dialog box. The Options dialog box-button tab will be presented again. The selected button name and assay will be indicated (e.g. 111 Assay2) in the Button field. A button will be presented on the main window (Figure 4-16) when you close the dialog box. MRX Revelation Manual 4-17 4.2 The Menu Bar Chapter 4 Commands Figure 4-16 The Assay Short Cut Button When the button labelled 111 is pressed, Assay 2 will be automatically loaded. You can create up to eight different short-cut buttons, which will be displayed just below the Tool Bar. When you click on a short-cut button, the program displays the Run Plate dialog box. To run a plate you normally have to create an assay checklist, but if you program the assays into a short-cut button, they will automatically appear on the checklist; saving you the time and trouble of opening up the required assays. 2 Preferences Tab The Preferences tab (Figure 4-17) is used indicate a broad range of miscellaneous items, as described below. Figure 4-17 The Options Dialog Box - Preferences Tab 4-18 MRX Revelation Manual Chapter 4 Commands 4.2 The Menu Bar Run Plate Defaults ! Auto save enabled - plate data is automatically saved as a file with the file name being the plate ID entered in the Run Plate dialog box which pops up right before the plate is read. To switch this option off, un-check the Auto save enabled box. ! Auto print enabled - plate data is automatically printed as soon as the plate is read, when the data file is created. To switch this option off, un-check the Auto print enabled box. ! Search for Sample ID’s enabled - the program automatically searches for a sample ID file when it runs the plate. The Sample ID file MUST have been previously created and stored as a *.sid file. The plate ID entered into the Run Plate dialog box MUST match the name of the sample ID file. ! Auto barcode read enabled – the plate barcode is automatically read when the plate is run, if an internal barcode readser is installed on the instrument. To switch this option off, un-check the Auto barcode read enabled box. ! Ask for lot specific data - data that has been entered for specific lots of reagents are automatically retrieved when the assay is run. To switch this option off, un-check the Ask for lot specific data box. ! Multiple assays More than one assay can be run per plate. To switch this option off, un-check the Multiple assays box. ! Orientation Lock fills replicates for all well types in the same direction. Select the direction in which they are to be filled (Columns only or Rows only). Default Plate IDs Each time you run a plate, you should assign a plate ID to the data, under which the file can be saved. If you do not want to type in a plate ID or scan a barcode every time you run a plate, you can create default IDs. ! Enabled - To switch default ID on, and enter the plate ID format in the text box. The program uses the same format for every plate ID and increments the end number with each new data file. For example, if you set the default ID format as plt_001, the first plate ID RevelationTM offers will be plt_000, the second will be plt_001 and so on. ! Display overwrite warning - the program can store a maximum of 1000 default plate IDs before it has to start overwriting IDs and the data they hold. If you want the program to warn you before it begins overwriting data, check the Display overwrite warning box. ! Reset Counter to zero – used to reset the default plate ID counter to 0 by pressing the Reset Counter to zero buttons. MRX Revelation Manual 4-19 4.2 The Menu Bar Chapter 4 Commands 3 Colours The Colours tab (Figure 4-18) is used to assign colors to the various well types indicated in the table. Figure 4-18 The Options Dialog Box - Colours Tab To select a color: 1 Click the radio button corresponding to the item for which you want to change the color. 2 Move the slide bars for Red, Blue and Green. The color of the word Text will change to show the currently selected color of the well type. The program will display the colors you have chosen on the template and in printouts (if you have a color printer). If you do not have a color printer, all colors will be printed as black. Note… Windows normally has use of a limited number of colors (depending on the graphics board that is installed in the computer), so it will pick the closest color to the one you have created. 4-20 MRX Revelation Manual Chapter 4 Commands 4.2 The Menu Bar 4 Directories The Directories tab (Figure 4-19) is used to indicate the default directory for each type of file that is used in the program. Figure 4-19 The Options Dialog Box - Directories Tab To select the desired directory, type in the name or use the Browse button to view the directories. ! Laboratory Information The Laboratory Information tab (Figure 4-20) is used to include identification to be placed on the report. MRX Revelation Manual 4-21 4.2 The Menu Bar Chapter 4 Commands Figure 4-20 The Options Dialog Box - Laboratory Information Tab 4.2.4.13 Password Password accesses a dialog box which is used to enter a password to lock the assay. If the password is not entered when the assay is opened, the operator can use the assay but cannot edit it. 4.2.5 Window The Window menu (Figure 4-21) is a standard Windows feature which is used to format the workspace. Figure 4-21: The Window Menu The bottom region indicates all open windows and the check mark indicates the active window. 4-22 MRX Revelation Manual Chapter 4 Commands 4.2 The Menu Bar 4.2.6 Help The Help menu (Figure 4-22) accesses the on-line help program and a dialog box with version number information Figure 4-22 The Help Menu In addition, you can get help by clicking F1 or by dragging the Help icon (Section 4.3). MRX Revelation Manual 4-23 4.3 The Tool Bar Chapter 4 Commands 4.3 The Tool Bar The Tool Bar (Figure 4-23) contains a series of icons that are used to rapidly access various features of the program. Figure 4-23 The Tool Bar Accesses the Assay Type dialog box (Section 4.2.1.1). Accesses the Open dialog box (Section 4.2.1.2). Accesses the Save Assay dialog box (Section 4.2.1.4). Initiates the Run Plate activity (Section 4.2.1.7). Prints the run (Section 4.2.1.8). Shows the Print Format on the display. Accesses the Assay Wizard (Section 6.1). Accesses the Assay Title dialog box (Section 6.2). Accesses the Reader Options dialog box (Section 6.3.1). Accesses the Template tab (Section 6.4). Accesses the Blanking dialog box (Section 6.5). 4-24 MRX Revelation Manual Chapter 4 Commands 4.3 The Tool Bar Accesses the Quality Control dialog box (Section 10.2). Accesses the Threshold dialog box (Section 10.3). Accesses the Curve Fit dialog box (Section 10.4). Accesses the Ratio dialog box (Section 10.5). Accesses the Spreadsheet dialog box (Section 10.6). Accesses the Report Options dialog box (Section 11.3). Accesses the Assay Options dialog box (Section 6.12). Accesses the About Revelation dialog box (Section 4.xx) Provides Help (drag to item where you want help). MRX Revelation Manual 4-25 4.4 Status Bar Chapter 4 Commands 4.4 Status Bar The Status Bar (Figure 4-24) is located at the bottom of the window. CAPS MESSAGE BAR Figure 4-24 The Status Bar TEMPERATURE CONTROL STATUS SCROLL LOCK NUMBER LOCK The Message Bar region presents information about the current pull down menu option or the status of the reader. The Temperature Control region indicates the temperature of the thermal chamber if you are running a Temperature Control Option. Caps Lock, Number Lock and Scroll Lock are standard commands selected by the keyboard. 4-26 MRX Revelation Manual Chapter 5 Running an Assay 5.1 Overview Chapter 5 Running an Assay 5.1 Overview In this chapter, we describe the steps that the analyst should perform so that data can be collected on a routine basis. This discussion assumes that the appropriate assay and related information has been established (if this is not the case, refer to Chapters 6-10). MRX Revelation Manual 5-1 5.2 Powering up the System Chapter 5 Running an Assay 5.2 Powering up the System To Power up the System: 1 Turn on the power switch for the printer and verify that the printer completes its selftest successfully. 2 Turn on the power switch on the front panel. 3 Click on the Revelation icon on the Windows desktop. 4 The monitor will present a welcome screen and the Reader Serial Number dialog box (Figure 5-1). Enter the serial number and press OK. Figure 5-1 The Reader Serial Number Dialog Box 5 A series of self-tests will be automatically performed and the results will be indicated in the workspace of the Revelation screen. The self-test checks the items indicated in Table 5-1 and a sample report is presented in Figure 5-2 (the report is presented in the workspace of the main Revelation window (which is described in Chapter 3). Note… When the reader is operating under the control of an internal computer, the keyboard on the front panel reader will not operate. The display will indicate the serial number of the instrument and the version of the firmware. 5-2 MRX Revelation Manual Chapter 5 Running an Assay 5.2 Powering up the System Table 2-1 Self-Test Diagnostics Test Action A/D Status Plate Motor Background Light Bulb Begins conversion and checks that the status line goes high and low. Verifies that hardware can be detected and chosen. Moves the plate to Out position and then to the In position. Verifies that the plate carrier position sensors are operating correctly. Checks motor and sensors. Checks for light leakage into the reading compartment. Verifies that current is flowing through the bulb when it is switched on. Checks that the bulb has not blown. Moves the filter motor to the first position. Checks the filter motor and optical alignment. Verifies that all filters are capable of transmitting at least 33% of the maximum transmission level. Checks for blocked channels or broken diodes. Checks that gains can be selected for all filters. Checks for damaged or missing filters. Filter Motor Transmission Levels Filters SELF-DIAGNOSTIC SEQUENCE Reader Serial # 2CXC2549 Date Time Test Test Test Test Test Test Test 1 2 3 4 5 6 7 : : : : : : : : : Technologist: 2/17/01 11:15:02 AM A/D Plate motor Background light levels Bulb Filter motor Transmission levels Filters Pass Pass Pass Pass Pass Pass Pass Self-Diagnostic Summary Reader Status : Ready Figure 5-2 Sample Self-Test Report MRX Revelation Manual 5-3 5.2 Powering up the System Chapter 5 Running an Assay We recommend that you print a copy of the report on a periodic basis (e.g. once a month) by selecting the Print command on the File menu and save the reports to monitor the performance of the reader on a long-term basis. 6 Check that the time and date is properly indicated on the report. If the time/date are not correct, click on the time on the bottom right corner to present the Date/Time Properties dialog box (Figure 5-3) and edit these parameters as appropriate. Figure 5-3 Date/Time Properties Dialog Box 7 Select the Run Plate command on the File menu. The Run Plate dialog box is described in Section 5.4. 5-4 MRX Revelation Manual Chapter 5 Running an Assay 5.3 Selecting the Assay Conditions 5.3 Selecting the Assay Conditions To select assay conditions, press Run Plate on the File menu to present the Run Plate dialog box (Figure 5-4). Figure 5-4 The Run Plate Dialog Box To run an assay: 1 Enter the Plate ID (if applicable). The plate ID is used as a temporary filename for the plate data file which is created when the assay ends. If you have selected Default Plate IDs in the assay, a default ID will appear in the Plate ID field box; otherwise you will have to assign the ID manually. Plate IDs can be assigned either by typing a name into the Plate ID text box, or by scanning a barcode on the side of the microplate. If you are using the Barcode option, you should make sure the scanner is set up to decode the correct type of barcode. For additional information, refer to the Barcode Program User Manual. • Scan Bar Code before run - To automatically read the plate barcode before the plate is run, place a check mark in the Scan Barcode before run box. As an alternative, you can read the barcode at any by pressing the Read Barcode Now button. 2 Select the Desired Option(s) • Auto save - The Auto save command is linked to the plate ID option. When you enter a plate ID or scan a barcode, RevelationTM displays the resulting filename in the Options dialog box along with the default destination. The default destination is determined by the Options command on the Utility menu. If you intend to recall plate data at a later date, you should always assign the ID as a permanent filename. • Print Results - If you do not want the data to be printed automatically, un-check the Print Results check box (stored data can be printed using the Print command on the File menu after collection). • Search - If you created a sample ID file using the Sample ID (SID) entry on the Utility menu, Revelation can automatically search for this file. Sample ID files are saved by default in the SID directory. If you want to search for the file automatically, you should make sure it has the same name as the plate ID. To link sample IDs to the template, click on Use Template. MRX Revelation Manual 5-5 5.3 Selecting the Assay Conditions Chapter 5 Running an Assay 3 Select the Desired Assay An assay list is used to indicate the assay(s) to be run. Assay lists may contain a single assay or a number of assays. If you place more than one assay on a plate, you can either over-lap some assays (so that more than one assay will run on the overlapped wells) or you can run each assay on different wells. The Select list box contains a list of all your assays. • Open - Presents the Open dialog box with a listing of all previously saved assay checklists. • Save - Saves an assay checklist. Checklists are saved by default in the main Revelation l directory (using the .LST extension). If the checklist has not been saved before, Revelation displays the standard Save As dialog box. • Add - Places the highlighted assay in the Select field into the Selected Assays field. • Remove - Removes the highlighted assay from the Selected Assays field. • Clear - delete all the assays from the Selected Assays field. • First well location - Select an assay in the Selected Assay(s) field and type in the well location when you want this assay to start. • Number of wells – Enter 96 for this value for each assay. Note… The program allows you to assign fewer wells to an assay than were originally programmed into the assay template. For example, if your assay contains 96 Test samples, but this run only requires 10 test samples, you can assign 10 wells to the assay. RevelationTM will reduce the template to fit into 10 wells. The program reduces templates by removing Test samples from the end of the template until the required number of wells is left. All non-Test samples are left in the same positions relative to the end of the plate. If it is not possible to reduce the template, the program prints an error message and will not reduce the template. • Orientation - If you have assigned less than 96 wells to any assay on the plate, you must select Columns or Rows, to specify the plate orientation. As an example if Assay 1 contains 12 wells and starts at A1 and you select Columns, the program will place the assay in wells A1 to H1 and A2 to D2 (if you select Rows, Revelation will place the assay in wells A1 to A12). Note… The selected orientation applies to the whole plate and not just the highlighted assay. If you change the orientation when some assays have already been positioned on the plate, you will have to change the First well assignments, as these depend on the template orientation. 5-6 MRX Revelation Manual Chapter 5 Running an Assay 5.3 Selecting the Assay Conditions 5.4 To Initiate the Run 1 Place the microplate in the reader. 2 Press Start to initiate the assay. In a few instances, the assay will not be automatically initiated: ! If a Shake operation is in included in the assay, the program will shake the plate before reading it. ! If the assay requires that the assay temperature is not the ambient temperature, the reader will check that the plate is at the appropriate temperature. If the temperature is not correct, a dialog box will be presented indicating that the present temperature and programmed temperature. The operator will be given the option to Read Now or Abort the Assay. The temperature will be driven to the set point, and you can wait until the present temperature is at (near the desired temperature) before starting the assay. ! In some cases, the analyst will be prompted to enter additional information before proceeding (e.g. sample names) based on the selection made in the assay. At the conclusion of the assay, the desired report will be presented in the desired format along with the calculations that were included in the assay. In addition, data will be saved and or exported as indicated in the assay. MRX Revelation Manual 5-7 This page is intentionally left blank Chapter 6 Generating and Editing Assays 6.1 Overview Chapter 6 Generating and Editing Assays 6.1 Overview An assay is a complete set of instructions for the operation of the microplate reader. It includes information about the various data collection, calculation and reporting processes to be performed on a microplate. If you want to develop a new assay, select New Assay on the File menu. A dialog box will be presented to select if you want to perform an Endpoint assay (single read) or a Kinetic assay (multiple readings over a period of time). After you have selected the desired mode of operation, the menu bar will include two additional items, View and Window. A new assay can be readily generated using the Assay Wizard, which is accessed by the Assay Wizard command on the Settings menu. The Assay Wizard presents a series of dialog boxes that the analyst completes to indicate the desired parameters for the assay. As an alternative, an assay can be generated by selecting each setting parameter separately from the drop-down Settings menu and saved. If desired, you can edit an existing assay by selecting Open from the File menu and then access the desired dialog box(es) via the Settings menu. After an assay has been created or edited, it can be saved via the Save command on the File menu. Assays can be retrieved via the Open command on the File menu (Section 3.4.1) and edited via the various commands on the Settings menu. In order to execute an assay, select the Read Plate command on the File menu. MRX Revelation Manual 6-1 6.2 Generating a New Assay - Assay Title Dialog Box Chapter 6 Generating and Editing Assays 6.2 Generating a New Assay - Assay Title Dialog Box When the Assay Wizard command is selected, the Assay Title dialog box (Figure 6-1) is presented. Figure 6-1 The Assay Title Dialog Box The Assay Title dialog box includes the following fields: ! Assay Title - The name of the assay, which can be any alphanumeric name that you like. This title can (but need not) be the filename that is used to save and retrieve the assay. ! Written By - The name of the individual who created the assay. ! Password - The password is an alphanumeric series of characters (e.g. ABC123) which is required to edit the assay. When an assay is opened, a dialog box is presented that requests the operator to enter the password. If the user wants to execute the program (but does not want to edit it) it is not necessary to enter the password, a discussion of the Password dialog box is presented in Section 4.2.4.13). When the assay is set-up, the password is entered twice to ensure that the desired series of characters is entered. While a password can contain an unlimited number of characters, it is best to keep them quite short (so they will be easier to remember). In order to maintain security, the password is indicated as *** on the assay report (regardless of the actual password length). 6-2 MRX Revelation Manual Chapter 6 Generating and Editing Assays ! 6.2 Generating a New Assay - Assay Title Dialog Box Assay Code - used to indicate the plate code for plates to be used with this assay. If you entered a prefix, the program will check the start of the barcode or plate ID against the prefix at run time. If you entered a suffix, the program will check the end of the barcode or plate ID against the prefix at run time. If the prefix or suffix is not correct, the program will display a warning message, asking whether or not to continue the assay. ! Finish - indicates that all desired editing of the assay has been completed. The assay will be presented in the workspace, but is not saved at this point. If you want to save the assay, select Save Assay on the File menu and enter the desired name (which can, but need not be the same as the assay title). MRX Revelation Manual 6-3 6.3 The Reader Control Dialog Box Chapter 6 Generating and Editing Assays 6.3 The Reader Control Dialog Box 6.3.1 Configuration of the Tabs on the Reader Control Dialog Box The Reader Control dialog box (Figure 6-2) is used to set a broad range of parameters for the assay. This screen tells the reader how and when to read your plate. The tabs that are presented in this dialog box depend on the assay type (Figure 6-2 describes the dialog box for an endpoint assay). The various configurations for this dialog box are summarized in Table 6-1. A discussion of systems with external control is presented in Appendix A. Figure 6-2 The Reader Control Dialog Box (Internal MRX System/Endpoint Assay) 6-4 MRX Revelation Manual Chapter 6 Generating and Editing Assays 6.3 The Reader Control Dialog Box Table 6-1 Configurations of the Reader Control Dialog Box Tab Reader Options (Section 6.3.2) Start Mode (Section 7.2) Start/Stop Mode (Section 8.2) Kinetic Time Interval (Section 8.2.3) Calculation Mode (Section 8.2.4) Kinetic Graphs (Section 8.2.5) Agglutination Parameters (Section 9.3.3) Agglutination Options (Section 9.3.4) Transmission Graphs (Section 9.3.5) Endpoint Assay * Kinetic Assay * * * * * * * * * * * Some commands in the Reader Control dialog box are general and are used in most assays, while others are used for specific activities (e.g. endpoint analyses or generating reports and exporting data). This chapter describes the general commands; commands that are used in specific activities are considered in separate chapters as described below: ! Endpoint Analyses (Chapter 7) discusses the details of the generation of an assay for an endpoint analysis. ! Kinetic Analyses (Chapter 8) discusses the details of the generation of an assay for a kinetic analysis. ! Agglutination Analyses (Chapter 9) discusses the details of the generation of an assay for an agglutination analysis. ! Incorporating Decision Making Protocols into the Assay (Chapter 10) describes how you can develop protocols to determine and report acceptable (unacceptable) data in the report. ! Generating Reports and Exporting Data (Chapter 11) explains how you can customize the report format and export data to an external program. MRX Revelation Manual 6-5 6.3 The Reader Control Dialog Box Chapter 6 Generating and Editing Assays 6.3.2 Reader Options Tab The Reader Control dialog box - Reader Options tab is presented in Figure 6-3. Figure 6-3 Reader Control Dialog Box - Reader Options Tab 6.3.2.1 Read Mode The Read Mode field is used to indicate the type of measurement to be made. 6-6 ! In Single/Dual Wavelength mode, one reading is taken in Single mode where a test filter is used to read the plate. In Dual mode; a test filter and a reference filter are used for extra accuracy and reduction of minor background contribution by the microplate. ! In Multi-Wavelength Mode, the plate is read at two different wavelengths. If any O.D. in the primary reading is above the OVER limit (Section 2.3.2.1), the reading from the secondary test filter reading will be used and the secondary value will replace the OVER value in the results. This value is converted into the primary reading range using one of three calculation modes. ! In Agglutination mode, a filter is used in the same manner as in Single/Dual Wavelength mode (see Chapter 9 for details). MRX Revelation Manual Chapter 6 Generating and Editing Assays 6.3 The Reader Control Dialog Box 6.3.2.2 Multi-Wavelength Mode The Multi-Wavelength Mode field is activated when the Multi-wavelength radio button is selected in the Read Mode field. This mode is used to read the absorbance peak if wells are very dark in color or if it is likely that the O.D will be over the set O.D. limit. It provides three options: ! Linear Regression indicates that Revelation uses a line of best fit calculated from the two sets of data. ! Well Type uses the ratio between the primary and secondary readings for a specified sample. The user indicates the sample. ! Value multiples the readings by a fixed value. The user can enter the multiplier. 6.3.2.3 Wavelengths The MRX® can read in single wavelength mode (using one filter) or in dual wavelength mode (using two filters). The first filter is the test filter, the second is the reference filter. A reference filter is commonly used to reduce errors caused by dirt and scratches on the bottom of the wells, but a single filter is suitable for most applications. ! If Single/Dual Wavelength mode is selected, a primary test filter and, if necessary, a primary reference filter must be selected. ! If Multi-Wavelength mode is selected, a primary and a secondary test filter and, if necessary primary and secondary reference filters must be selected. ! If Agglutination/T.C.G. mode is selected, a primary test filter must be selected. Agglutination/T.C.G. assays cannot be run with a reference filter. To select the appropriate filter(s), click the drop-down menu and select the desired filter from the list. If no reference filter is required, select the Single/Dual Wavelength option and run the test in single wavelength mode. Note… The list of available filters is generated from values that you entered using the Configure Reader Filters dialog box (Section 2.3.2. MRX Revelation Manual 6-7 6.3 The Reader Control Dialog Box Chapter 6 Generating and Editing Assays 6.3.2.4 Shake The Shake field is used to define the parameters that define the shaking action. ! Enable.... Check this box to insert a shake operation into the assay. ! Initial Duration indicates the initial shake time, which is the duration of the shake before an endpoint read. The Range is from 0 seconds (no shake) to 59 seconds. If this is a kinetic reading, it indicates the shake time before the first reading. ! Repeat Shake Duration defines the shake time between kinetic readings. Click on Fixed to set a specific time, or click on Continuous to shake the plate continuously between kinetic reads. ! Shake Modes allow the user to select the plate frequency and amplitude. The standard modes are described in Table 6-2 and are accessed by clicking on the down arrow adjacent to the field. Table 6-2 Standard Shake Modes Mode 1 2 3 ! Frequency 14 Hz (+/– 2Hz) 9 Hz (+/– 2Hz) 8 Hz (+/– 2Hz) Amplitude 1.7 mm 3.0 mm 3.0 mm Custom allows the user to select the shake amplitude (range 1-10 mm) and frequency (5-20 Hz) manually. Note… Custom shake mode is intended for experimental purposes and may not produce the exact amplitude and frequency specified. It will, however, produce reproducible shaking for a given unit. If the plate carrier is heavily loaded, and the amplitude or frequency is very high, the plate carrier may stall. The analyst should always test run Custom Shake Mode settings before using them in actual assays. 6-8 MRX Revelation Manual Chapter 6 Generating and Editing Assays 6.3 The Reader Control Dialog Box 6.3.3 Start Mode - Start/Stop Mode Tab If you have selected an endpoint assay, the Reader Control dialog box (Figure 6-2) will include a Start Mode tab, which includes parameters that are used to indicate when data collection should begin. This tab is discussed in Section 7.2. If you have selected a kinetic assay, the Reader Control dialog box (Figure 6-2) will include the Start/Stop Mode tab, which includes parameters that are used to indicate when data collection should begin and end. This tab is discussed in Section 8.2. 6.3.4 Kinetic Time Interval The Reader Control dialog box - Kinetic Time Interval tab is used to indicate when data should be collected when a Kinetic Assay is being performed. This dialog box is described in detail in Section 8.2.3. 6.3.5 Calculation Mode The Reader Control dialog box - Calculation Mode tab is used to specify the calculation mode and other miscellaneous calculation options for kinetic assays. This tab is discussed in Section 8.2.4. 6.3.6 Kinetic Graphs The Reader Control dialog box - Kinetic Graphs tab (is used to define the kinetics plots that will be output in the results and presents a matrix denoting the plate wells. This tab is discussed in Section 8.2.5. 6.3.7 Agglutination Parameters The Reader Control dialog box - Parameters tab is used to set a variety of operating parameters for measuring the agglutination of red blood cells. This tab is discussed in Section 9.3.3. MRX Revelation Manual 6-9 6.3 The Reader Control Dialog Box Chapter 6 Generating and Editing Assays 6.3.8 Agglutination Options The Reader Control dialog box - Agglutination Options tab is used to set a variety of data presentation parameters for agglutination measurements. This tab is discussed in Section 9.3.4. 6.3.9 The Reader Control Dialog Box - Transmission Graphs Tab The Reader Control dialog box - Transmission Graphs tab is used to specify that an Agglutination graph is desired for a given well(s). This tab is discussed in Section 9.3.5. 6-10 MRX Revelation Manual Chapter 6 Generating and Editing Assays 6.4 Template Window 6.4 Template Window The Template window (Figure 6-4) is provided to allow the user to indicate the sample positions and types of samples that will be contained by the plate. Figure 6-4 The Template Dialog Box The template is used to indicate the type of sample that will be placed in the various wells. To define the type of sample that will be placed in a specific well, click on the radio button for the desired well type, then double click on the well position. If a given position is not to be used, select the Delete radio button and click on the well. Before a well type can be assigned to any well, the existing template must be CLEARED by clicking on the Clear button at the bottom right of the dialog box. MRX Revelation Manual 6-11 6.4 Template Window Chapter 6 Generating and Editing Assays Well Type When a well type is defined, the well will be labelled to denote the type and the lowest unused number for that type. As an example in Figure 6-4, all positions are defined as Tests (T1-T96). If position A1 should be a blank, click on the Blank radio button and then click on position A1. The position will be indicated B1 and the Blank entry on the Well Type field will indicate B2 (indicating that the next Blank to be assigned will be B2). In most cases, a fairly structured order is used (e.g. every 24th sample is a blank, every 8th sample is standard, every 16th sample is a control, etc.), but the template allows the operator to define the wells on a completely random basis. If desired, you can change the labelling for a well type by selecting the well type to be edited and then selecting the Change Label button to present the Change Label dialog box (Figure 6-5). Select the desired format (1, 2, 3 or A, B, C) and then indicate the label type. As an example, if you wanted to use the label XX, select A, B, C and enter XX in the Label field. Figure 6-5 The Change Label Dialog Box Standard, Control and Test types are standard well types whose names cannot be changed. Replicates The Replicates feature is used to indicate that a given sample is to be placed in two (or more wells). The number of wells that the sample is to be deposited in is indicated in the number field. As an example, if you indicate 4 replicates, the Column orientation (see below), the Standard radio button and click in A1, wells A1, B1, C1 and D1 will be indicated S1. The number of replicates can range from 1-96. Replicates can be averaged into a single sample value or treated separately, by selecting the appropriate option in the Output Format dialog box (Chapter 10). The Define button, which is only active for Agglutination assays is discussed in Chapter 9. 6-12 MRX Revelation Manual Chapter 6 Generating and Editing Assays 6.4 Template Window To assign a sample with random replicates: 1 Select the well type. 2 Select the number of replicates. 3 Select Random orientation. 4 Click on the well locations for each replicate. Note… Samples are assigned according to available space. If you select a format that does not fit into the available space, RevelationTM will not assign the samples. Orientation ! Orientation - used to indicate the desired orientation of replicates if a sample is arranged in a group of more than one replicate. Fill Direction ! Fill Direction - used with the Fill command to define the direction in which the program will fill the template. ! Fill - places a sample in each position starting in the upper left corner (A1) and finishing in the lower right corner (H12). The type of sample is dependent on the radio button selected in the Well Type field. The orientation (row or column) is dependent on the selection in the Fill Direction field. ! Randomize - places a sample in each position similar to fill, but the locations are set up on a random basis. The type of sample is dependent on the radio button selected in the Well Type field. ! Renumber - numbers all samples on a sequential basis if there are gaps due to deletion of samples. ! Clear - clears all the existing well assignments, so that you can redefine the template from scratch. MRX Revelation Manual 6-13 6.5 Blank Mode Chapter 6 Generating and Editing Assays 6.5 Blank Mode The MRX® reader automatically uses the transmission of air as a reference for 100% transmission. For certain applications, however, other reference levels may be more appropriate. The Blank Mode dialog box (Figure 6-6) is used to select the definition for blanking. Figure 6-6 The Blank mode Dialog Box - Blank Mode Tab Blanking is useful if you want to eliminate the absorbance of a reagent solution from the result. The program can store the O.D. value of this reagent solution in memory as a Blank value and subtract it from the other well values on the plate. The program always subtracts the Blank value from individual well values before any other processing calculation is made. If any of the non-Blank samples are arranged in multiple replicates, the blank value is subtracted before the average of the replicates is calculated. The program allows you to choose from nine different blanking modes, but some of them require a certain amount of Blank samples on the template. In these cases RevelationTM will allow you to select a Blank mode which requires Blank samples, before these samples have been defined. However, the blanking operation will not work unless you create these samples before running the assay. 6-14 MRX Revelation Manual Chapter 6 Generating and Editing Assays 6.5 Blank Mode ! None - indicates that the transmission of air should be used as the reference level for 100% transmission. This is the default blanking mode and Blank samples do not need to be defined in the template. ! Previous - Each time the system finishes reading a plate, it stores the last Blank value in memory. Previous blanking mode uses the last value stored as a Blank for every well on the current plate. If the last plate did not use any blanking, then the transmission of air is the blank value. This value will be used as the previous blank value. No Blank samples are required for this mode. ! Plate - the data matrix from a previously read plate is used as a blank matrix for the current plate. The plate ID for the plate you wish to use is indicated in the field adjacent to this option. The program subtracts the 96 values in the data file from the 96 wells on the current plate on a well - for - well basis. No Blank samples are required for this mode. ! Individual - involves defining a number of blanks on the plate. When the software encounters a blank, it updates the stored blank value. This value is subtracted from all subsequent readings, until the program finds another Blank or until the whole plate has been read. It is possible to arrange the template so that the program reads one Blank value straight after another, for example if a Blank sample contains multiple replicates arranged in columns. If this happens, the program stores only the last blank value it reads. It will read the first replicate and update the blank value, move to the next replicate and update the blank value again. This will continue until it reaches a well containing a non-Blank sample. It will then subtract the Blank from the reading for this well and move on to the next well. ! Average - requires one or more Blank sample on the template. All the Blank ODs are averaged, and the averaged value is subtracted from all other readings on the plate. ! Row - treats each row separately. If there are any Blank samples in a particular row, the program averages all the Blank values into a single value and subtracts this value from every reading in the row. If no blanks were assigned to a row, RevelationTM does not use any blanking. ! Column - treats each column separately. If there are any Blank samples in a particular column, the program averages all the Blank values into a single value and subtracts this value from every reading in the column. If no blanks were assigned to a column, Revelation does not use any blanking. ! Paired - used when each Test, Standard, or Control sample uses an individual blank (i.e. the number of Blank samples on the template must equal the total number of all the other samples). MRX Revelation Manual 6-15 6.5 Blank Mode Chapter 6 Generating and Editing Assays Blank samples are assigned to different well types in the following order: 1 Tests 2 Standards 3 Controls 4 Positive Controls 5 Negative Controls 6 Cut-off Controls 7 User Well Types 1 to 8 As an example: If a plate contains 3 Standard samples and 8 Test samples, 11 Blank samples are required. The blanking process will be performed in the following manner: • Revelation will assign the Blanks to the other samples. Blanks 1-8 will be assigned to Test samples 1-8. Blanks 9-11 will be assigned to Standard samples 1-3. • If the Blank samples are arranged in multiple replicates, RevelationTM will average the replicates to produce a total of 11 Blank values. • The Blank values will be subtracted from the assigned samples. Blank value 1 will be subtracted from Test 1, Blank value 2 will be subtracted from Test 2, etc. If any of the Test or Standard samples contain more than one replicate, the Blank value will be subtracted from each replicate rather than from the whole sample average. ! 6-16 Custom - similar to Paired blanking, except that you can assign Blank samples to whichever non-Blank sample you want. To define the Custom blank mode settings, select the Custom radio button and access the Custom tab (Figure6-7). MRX Revelation Manual Chapter 6 Generating and Editing Assays 6.5 Blank Mode Figure 6-7 The Blank Mode Dialog Box - Custom Tab Each Blank sample is listed in the Blanks list box and every non-Blank sample is listed in the Subtract list box. ! Add All - assigns the Blank highlighted in the Blanks list box to all samples on the plate (all samples will be displayed in the Check list box when this Blank is highlighted to indicate that a blank has been assigned). ! Add - assigns the Blank highlighted in the Blanks list box to the sample highlighted in the Subtract list box. (This sample will be displayed in the Check list field when the specified blank is highlighted.) ! Remove - clears the sample highlighted in the Check list box and returns the sample to the Subtract From: list box for the Blank highlighted in the Blanks list box. ! Clear - clears all samples in the Check list box for the Blank highlighted in the Blanks list box. Assigning a Blank to a Sample: 1 Highlight the required Blank. 2 Highlight the samples you want to assign the Blank to. 3 Click on Add. The samples will appear in the Check list box and will continue to be displayed until you click on a different Blank. MRX Revelation Manual 6-17 6.6 Quality Control Raw Data Chapter 6 Generating and Editing Assays 6.6 Quality Control Raw Data Quality Control (Q. C.) equations are used to place criteria on the raw assay data, threshold data or curve fit data. If the criteria are not met, the data will be processed as normal but the results report will contain a message showing that the data failed Q. C. Quality Control Calculations are described in Chapter 10. 6-18 MRX Revelation Manual Chapter 6 Generating and Editing Assays 6.7 Threshold 6.7 Threshold The Threshold dialog box is used to indicate ranges for samples that are going to be qualitatively determined to be positive or negative, according to the assay parameters. If there is a large neutral area between positive and negative, you may define segments or break points within this neutral area. This feature is described in Section 10.3. MRX Revelation Manual 6-19 6.8 Curve Fit Chapter 6 Generating and Editing Assays 6.8 Curve Fit 6.8.1 Introduction to Curve Fitting Standard wells MUST be designated on your template before a standard curve can be set up. RevelationTM CANNOT draw a curve unless the wells used to create the x and y-axis have been labelled with an “S” on the template (see Section 6.4.). When Curve Fit processing is used, the program measures the O.D. for a series of standard samples of known concentrations and uses the readings to generate a graph which is used to calculate the concentrations of test samples (experimental unknowns) . The numbers entered for the known standards are used to draw the x-axis of the graph and the O.D.s from the known standards are used to draw the y-axis. The Curve Fit dialog box (Figure 6-8) includes ten tabs, which are used to present options for various aspects of the curve fitting protocol. Figure 6-8 Curve Fit Dialog Box - Fits Tab 6-20 MRX Revelation Manual Chapter 6 Generating and Editing Assays 6.8 Curve Fit 6.8.2 The Curve Fit Dialog Box - Fits Tab The Fits tab is used to insert or select a curve in the assay. All existing fits are indicated in the listing area in the Fits field. To select the desired fit, click on it. ! Fit Name - by default, curves are named Fit1, Fit2 and so on. When you open the Curve Fit dialog box, RevelationTM offers Fit 1. You can either enter a new name for Fit1 or retain it and enter another name for the next fit in the Enter Fit Name field and then press the Add Fit button when a new Fit is created. ! You can enter the desired name in the Enter fit name field and then press the Add fit button when a new Fit is created. The name entered for a given fit is typically related to the kind of fit it is or how many standards are in that fit (i.e. “Linear” or “S1-5”). To include a fit into the assay, the settings must be defined in the other tabbed folders and then the Add button should be clicked. ! Add Fit - The name of the current curve fit is shown in the Enter Fit Name box. To add this fit to the list of curves or to save changes to a fit, click on Add Fit. ! Remove Fit - used to delete the highlighted fit from the list of fits. ! Copy Fit - used to copy a fit from the list of fits (i.e. if you want to make a small change to a present fit). To copy a fit, enter a name for the copied fit in the Enter Fit Name box, then and click on Copy Fit. The copied fit will be added to the list under the new name. 6.8.3 The Curve Fit Dialog Box - Standards Tab The Curve Fit Dialog Box-Standards tab (Figure 6-9) is used to define the various standards that are used to generate the fit. MRX Revelation Manual 6-21 6.8 Curve Fit Chapter 6 Generating and Editing Assays Figure 6-9: The Curve Fit Dialog Box - Standards Tab To use the Curve Fitting function, you must create a Standards checklist that contains at least one Standard (standards are entered into the program via the Template dialog box, Section 6.4). The Standards indicated in the Check list are used to create the standard curve which is highlighted in blue in the Fits tabbed folder. The actual number of Standards required depends on the Curve Fit Type. The Select field contains all the Standard samples, and the Check list shows all the Standards that have been selected. 6-22 ! Add All - used to indicate that all standards in the Select list should be moved to the Check list. ! Add - adds the Standard highlighted in the List box, to the bottom of the Check list. ! Remove - removes the highlighted Standard from the Check list. ! Clear - clears all the Standard samples from the Check list. ! Automatic Entry - allows you to enter values automatically such as dilution factors or evenly spaced concentration values. ! No Factor - disables the function. MRX Revelation Manual Chapter 6 Generating and Editing Assays ! 6.8 Curve Fit Additive - used to increment each successive value by a specified amount. To apply the additive function: 1 Click on Additive and type in the incremental value. If, for example, your standard concentrations are 1, 5, 9, 13, 17 pg/ml standards, then the additive number to enter is 4. 2 Click on the first standard and type in its value in the box labelled Concentrations. In this example, that number would be 1. 3 Click on the first item and type in its value. 4 Press Enter on the keyboard to apply the addition to each successive item. ! Multiplier - used to multiply each successive value, by a specified amount. To apply the multiplier function: 1 Click on Multiplier and type in the multiplication value. If your concentrations are 0.5, 1, 2, 4, 8, then the multiplier number is 2. If your concentrations are 100, 50, 25, 12.5, 6.25 and so on, then the multiplier value is 0.5. 2 Click on Standard one to highlight it and type in its concentration. 3 Press Enter on the keyboard to apply the multiplier to each successive item. ! Percentage Response - The Percent Response option allows the operator to use specified Standards as references for 0% or 100% or both. By default, the program uses the lowest Standard sample O.D. (min.) or as a reference point for 0% and the highest Standard sample O.D. (max.) as a reference point for 100%. When you use this option, the concentration graph is reported in terms of percentages rather than well absorbance values. If you want to use different Standards for 0 or 100%: 1 Place a check mark in the Percent Response box. 2 Select the Standard you want to use for 0%, and press the 0% Ref button. The standard will be displayed next to 0% Ref. 3 Select the Standard you want to use for 100%, and press the 100% Ref button. The standard will be displayed next to 100% Ref. If you want to reset the references to the default values, press the Clear Refs button. MRX Revelation Manual 6-23 6.8 Curve Fit Chapter 6 Generating and Editing Assays If you want to report 10%, 50%, and/or 90% lethal concentration values: 1 Place a check mark in the LC10, LC50, and/or LC90 box. ! 0% Ref. - used in Percent Response Calculations (see above) ! 100% Ref. - used in Percent Response Calculations (see above) ! Clear Refs – used if you want to reset the references to the default values ! Enter Concentration – used to enter a concentration or titer value for the Standard highlighted on the Check list. (The value will not automatically appear. To apply the value, press Enter on the keyboard or click on the Standard again). ! Enter units - used to enter the units for the x axis of the graph. You may use up to eight letters or symbols. ! Variable Standard Multiplier - A variable standard multiplier is a multiplication factor which is applied to all the Standard samples when the curve fit data is calculated at runtime. When the program processes the data it asks you to enter this value. The value can be changed after the plate has been run, using the Data menu, Variable Parameters command. ! Enter Concentrations at Run Time - used to indicate that concentrations of the standards should be entered when the plate is run. If this option is chosen, a dialog box for entry of standard concentration values is displayed when the plate is run. 6.8.4 The Curve Fit Dialog Box - Fit Type Tab The Curve Fit dialog box-Fit Type Tab (Figure 6-10) is used to select how the data is to be fit (i.e. the equations to be used). 6-24 MRX Revelation Manual Chapter 6 Generating and Editing Assays 6.8 Curve Fit Figure 6-10 The Curve Fit Dialog Box - Fit Type Tab Select the fit type by clicking on the desired radio button. The various options are described in Table 6-4, along with the minimum number of points that must be provided for the fit type. A discussion of each fit type is presented in Appendix B. MRX Revelation Manual 6-25 6.8 Curve Fit Chapter 6 Generating and Editing Assays Table 6-4 Fit Types Fit Type Description Linear Quadratic Cubic Quartic Polygon Cubic Spline Lineweaver-Burk Michaelis-Menten Sigmoid (a) Log/Logit (b) Akima Parallel Line Bioassay (c) Stored Curve (d) # of Standards Linear polynomial regression Quadratic polynomial regression Cubic polynomial regression Quartic polynomial regression Point to point straight line fit Smooth curve cubic spline fit Hyperbolic fit, transformed axes, kinetic Hyperbolic fit, kinetic only S-shaped curve fit - four definable parameters S-shaped curve fit - with fixed parameters Smooth curve, passes through all data points Parallel line bioassay Curve saved from a previous test 2 3 4 5 3 3 3 3 4 4 3 4 0 a) Sigmoid Parameters – activates the Sigmoid Parameters, Maximum Iterations. The value entered here is the maximum number of times for RevelationTM to attempt to construct a satisfactory plot before aborting the operation. The default value of 20 is suitable for most applications Minimum iterations: 1. Maximum: 29999. b) A Log/Logit curve fit produces an S-shaped curve; similar to a Sigmoid curve defined by four parameters (A to D). The program sets the A parameter to the lowest Standard O.D. and sets the D parameter to the highest Standard O.D. It then attempts to fit all the other points into an S-shape. The curve may be quite irregular and will not be as accurate as if you had used a Sigmoid curve. If you want to produce an S-shaped curve, it is normally better to use a Sigmoid curve (unless a Log/Logit curve is specifically requested). c) Parallel Line Bioassays require special numbers of Standard and Test samples • • Standard samples - At least two Standard samples in multiple replicates. Test Samples - The number of Test samples must be a multiple of the number of Standard samples and they must be arranged in the same number of replicates. d) Stored Curve – accesses a dialog box that lists a previously stored curve and Fit data. The program uses the curve file to generate the axis fit; the curve fit type and standard concentrations (or the slope and y intercept). You do not have to enter any of these values for a stored curve calculation. Curves are stored after the test has been run, using the Fit Information box. To use this fit type: 6-26 1. Create your first assay by using either the Assay Wizard or individual selections in the drop-down Settings menu. Your first assay will have your standards in the template and the curve fit programmed in. Run your plate. Data will appear on your monitor. 2. The top task bar will have the words: File Data View Utility Window Help Click on the word “File”, then click on “Save Data As”. Save your data in a file with a *.dat extension. Click on the word “Data” in the top task bar. Click on the selection “Fit Information”. A dialog box will appear. Make sure the fit you want to save is highlighted. Enter any information about the x or y value you wish. 3. Click on the “Save” button. A different dialog box labelled “Save As” will appear. Type in the file name you wish this curve saved under. Make sure the extension is *.cur and that it is being saved in the “Curves” folder in the top “Save in:” rectangle box. Click on the “Save” button. The “Fit Information” box will come back up. Click on the “Close” button. 4. Create a second assay. In the second assay there will be no wells labelled as standards in your template. In the Curve Fit screen under the assay Settings, go to the tabbed folder marked “Fit Type”. At the very bottom of the list on the left, labelled “Fit type” there is a selection for “Stored Curve”. Click on it .A dialog box will appear labelled “Use Stored Curve”. Highlight with the one in the list of fits that you want to use, and click OK. 5. Click OK on the Curve Fit screen and finish programming your second assay. Read your second plate. Your data will be calculated using the stored curve fit. Graphs and concentrations will appear again as when the first plate was read. MRX Revelation Manual Chapter 6 Generating and Editing Assays 6.8 Curve Fit 6.8.4.1 Calculation Options ! Average Standard Replicates - average the replicate values for individual standards before they are used for curve fitting. ! Extrapolate Data - extends the graph beyond the O.D. for either the highest or lowest known data points. Revelation does this by calculating extra data points based on the known data. Extrapolation is usually valid scientifically off a linear regression curve fit but not off a sigmoidal curve fit. ! Sigmoid Parameters – are used to define the conditions when a Sigmoid fit is used. ! Fix Parameters - All four parameters of the Sigmoid curve are user-definable. Check the box of any parameter you want to define and type a number in the box. ! Maximum iterations - the maximum number of times for the program to attempt to construct a satisfactory plot before aborting the operation. The default value of 20 is suitable for most applications, the range is from 1 to 29999. ! Results Format - Values for the Standard samples can be entered as concentrations or as titer values. Select the required units. ! Inhibitor - used to examine the effect of an inhibitor when using Lineweaver-Burk or Michaelis-Menten fit types. If an inhibitor is present: 1 Place a check mark in the present check box. 2 Enter the concentration of the inhibitor. 3 Specify the data source which does not contain inhibitor by selecting the appropriate radio button: • Fit - Select another fit within the same assay. • Stored Curve - Select a stored Michelis-Menten or Lineweaver-Burk curve (use the Browse button to search for a file). MRX Revelation Manual 6-27 6.8 Curve Fit Chapter 6 Generating and Editing Assays ! Axes - Select the desired axes (not active for Lineweaver-Burk, Michaelis-Menton, Sigmoid and Log-Logit options) by clicking on the radio button. When a curve fit is chosen, RevelationTM will gray out any axes fits which are not available for that type. For example, if a sigmoidal fit is chosen, all selections are grayed out and the fit is automatically drawn on a semi-log scale. 1 Lin/Lin - both the x and y axes are on a linear scale. 2 Log/log - Both axes use logarithmic scales. 3 Log/Lin - the x-axis is graphed on a log scale while the y-axis O.D.s are graphed on a linear scale. 4 Auto - Revelation selects the best axes fit automatically. 6.8.5 The Curve Fit Dialog Box - Graph Tab The Curve Fit dialog box-Graph Tab (Figure 6-11) is used to include a concentration graph in the results and define how it will be output. Figure 6-11 The Curve Fit Dialog Box - Graph Tab 6-28 MRX Revelation Manual Chapter 6 Generating and Editing Assays 6.8 Curve Fit ! Produce a Graph - indicates if a graph is to be included in the Results report. A graph is always included by default. ! Error Bars - indicates if bars which show the variation in O.D. for each point are to be included on the graph. There must be at least two replicates of each point for error bars to appear. ! Combine with other graphs - if more than one fit has been programmed into the assay, this option allows more than one fit to be shown on the same graph. To combine graphs: 1 Select the Fits tab. 2 Select the fit for each fit you want to include. 3 Click on the Graphs tab and check the Combine with other graphs check box. ! Title - used to name the graph. 6.8.5.1 Horizontal Axis (Vertical Axis) If Autoscaling is selected, the program automatically sets the scaling based on the range of data. Manual Scaling allows definition of the axes scaling according to the numbers entered by the user. In the Minimum box, the lowest desired value for either the concentration or O.D. axis may be typed in. In the Maximum box, a higher O.D. or standard concentration number can be entered. Tick marks (there may be between 2 and 10 tick marks) divide the axis evenly between the minimum and maximum entered values. 6.8.6 The Curve Fit Dialog Box - Sample Selection Tab The Curve Fit dialog box - Sample Selection tab (Figure 6-12) is used to indicate the samples that should be included in the curve fit calculation. All the samples are shown in the Samples box. The samples, which are included in this curve fit are shown in the Check list box. By default, all test samples will be calculated against every curve fit. MRX Revelation Manual 6-29 6.8 Curve Fit Chapter 6 Generating and Editing Assays Figure 6-12 The Curve Fit Dialog Box - Sample Selection Tab The Display Points on Graph check box is used if you want each point to be displayed on the plot, in addition to the selected curve format. 6.8.7 The Curve Fit Dialog Box - Dilutions Tab The Curve Fit dialog box - Dilutions tab (Figure 6-13) is used to indicate if any of the samples have been diluted. 6-30 MRX Revelation Manual Chapter 6 Generating and Editing Assays 6.8 Curve Fit Figure 6-13 The Curve Fit Dialog Box - Dilutions tab Samples The Dilutions list box lists all of the Test and Control samples on the template. If you have diluted any of these, type the dilution factor in the Enter Dilution field. (The factor will not automatically appear). To apply the value for a given sample, press Enter on the keyboard or click on the sample again. ! Split Replicates - used to indicate that the Test and Control samples contain multiple replicates and you want to assign separate dilution values to these replicates. Automatic Entry Automatic Entry is used to enter dilution values automatically. No Factor - Switches automatic entry off. Additive - used to increment each successive value by a specified amount. MRX Revelation Manual 6-31 6.8 Curve Fit Chapter 6 Generating and Editing Assays To apply the additive function: 1 Click on Additive and type in the incremental value. 2 Click on the first item and type in its value. 3 Press Enter on the keyboard to apply the addition to each successive sample. Multiplier - used to multiply each successive value, by a specified amount. To apply the multiplier function: 1 Click on Multiplier and type in the multiplication value. 2 Click on the first item and type in its concentration. 3 Press Enter on the keyboard to apply the multiplier to each successive sample. 6.8.8 The Curve Fit Dialog Box - Fit Q.C. Tab The Curve Fit dialog box - Fit Q.C. tab (Figure 6-14) is used to indicate quality control information about the plot and to indicate how outliers should be treated. Figure 6-14 The Curve Fit Dialog Box - Fit Q.C. Tab 6-32 MRX Revelation Manual Chapter 6 Generating and Editing Assays 6.8 Curve Fit Quality Control This field is used to indicate the quality control parameters to be used for the curve; if the curve fit does not meet the requirements of the expressions, a message will be output with the results showing which parameters failed and why. If the Curve Fit Quality Control check box is selected, those expressions that are appropriate to the curve type will be activated. Expressions which are not available for a given curve fit are grayed out. ! Min. R-Squared - Enter range (0.0 to 1.0). The R-squared value is an indication of how closely the curve fit is drawn between all points used. If the R2 value=1, the curve has been drawn perfectly through all points on the graph. A value of 1 is only possible to obtain when a spline (point-to-point) fit has been used. ! Min. Slope - Minimum slope value for a linear fit. The slope of a line is the O.D. or value on the y-axis / concentration or the value on the x-axis. ! Max. Slope - Maximum slope value for a linear fit. ! Min. Y-Intercept - minimum intercept of the plot through the y-axis or point where the line crosses the y-axes. ! Max. Y-Intercept - maximum intercept of the plot through the y-axis. Automatic Outlier Removal Automatic Outlier Removal is used to automatically remove outlier values when the standard curve is calculated. The criteria for removal of outliers are established by entering the R-Squared Limit, the Residual Limit, and the Removal Limit. ! R-Squared Limit - The proportion of the variance of values that can be attributed to the linear regression of the standard values. R-squared can range from 0 to 1.0. If RSquared is 1.0, there is no scatter in values. ! Residual Limit - An estimate of the error of each observation. The residuals are expressed as the percentage of the value. ! Removal Limit - The maximum number of values that can be removed. If you require that at least one replicate be retained for each standard level, click on the Leave at least one replicate check box. MRX Revelation Manual 6-33 6.8 Curve Fit Chapter 6 Generating and Editing Assays 6.8.9 The Curve Fit Dialog Box - Calculated Q.C. Tab The Curve Fit dialog box - Calculated Q.C. tab (Figure 6-15) is used to develop quality control equations that are used to place criteria on samples calculated from a curve fit. Quality control criteria are placed on wells after the curve fit has been drawn and concentrations or titers have been calculated. If the criteria are not met, the data will be processed as normal but the results report will contain a message showing that the data failed Q.C. Figure 6-15 The Curve Fit Dialog Box - Calculated Q.C. Tab Quality control equations are established in the same manner as equations for Q.C. Raw Data (a detailed description is presented in Section 10.2.2 for Q.C. Raw data and is applicable to curve fitting of data). 6-34 MRX Revelation Manual Chapter 6 Generating and Editing Assays 6.8 Curve Fit 6.8.10 The Curve Fit Dialog Box - Data Conversion Tab The Curve Fit dialog box - Data Conversion tab (Figure 6-16) is used to assign data conversion equations to the curve fit data tab. Data conversion equations are used to convert the data into different units by multiplying or dividing by some number or calculated sample value. Figure 6-16 The Curve Fit Dialog Box - Data Conversion Tab You can enter the desired units (e.g. mg/dL) by typing them in the units field. The functions used to generate equations are entered as indicated in Section 10.4.2. MRX Revelation Manual 6-35 6.8 Curve Fit Chapter 6 Generating and Editing Assays 6.8.11 The Curve Fit Dialog Box - Results Flagging Tab The Curve Fit dialog box - Results Flagging tab (Figure 6-17) is used to specify a phrase that either replaces a numerical result or is displayed next to the result, and is accessed by selecting the Results Flagging tab. The phrase will be initiated whenever the numerical result meets the criteria that are specified. Figure 6-17 The Curve Fit Dialog Box - Results Flagging Tab ! Condition is used to indicate the Results Flagging expression. ! Result is used to indicate if a phrase is to be reported (rather than a numerical result). ! Flag is used to enter a phrase if the numerical result is to be accompanied by a phrase in the Flag box. An example of the Results Flagging feature would be to report the phrase “<20 mg/dL” instead of the actual numerical result whenever results are less than 20 mg/dL. As an alternative, the phrase “Abnormal High” can be displayed to flag any results that are higher than a specified level. The phrase will be initiated whenever the numerical results meet the criteria that are specified. 6-36 MRX Revelation Manual Chapter 6 Generating and Editing Assays 6.8 Curve Fit Results Flagging Equations are used to specify criteria for generating the phrase or flag. Although several unique elements are used for constructing a Results Flagging expression, the expression is created in the same way as Raw Data Q.C.s. The unique elements for Results Flagging are described in Table 6-5. The Sample Checks field presents a listing of the various conditions that have been generated and the Function field lists the operators that can be used (see Chapter 10 for information). An unlimited number of Results Flagging expressions can be defined for an assay. Table 6-5 Results Flagging Elements Element Type( ) Sample (for O.D. values) Result (Sample) and, or operators MRX Revelation Manual Description Use the “Type” keyword to designate the well type (Standards, Controls, Tests, etc.) that a Results Flagging equation is applied to. For example, the expression “Type(C) = 0” means that this equation applies only to the control wells Use the “Sample” keyword to designate the absorbance of a particular sample, replicate, or well type in the same manner as used in Q.C. Raw Data equations. (for calculated values) Use the “Result (Sample)” construct to designate the calculated concentration of a sample instead of the absorbance values that were obtained. For example, the expression “Result (Sample)<123” can be created to set a lower limit of 123 mg/dL for the calculated value for any test sample. Then, whenever the value of a sample is less than 123 mg/dL, the designated phrase will be displayed Use the “and” or “or” operator in a Results Flagging expression to test multiple conditions. 6-37 6.8 Curve Fit Chapter 6 Generating and Editing Assays 6.8.12 Curve Fit - Output Format Tab The Curve Fit dialog box - Output Format tab (Figure 6-18) is used to indicate the format of the report for the Curve fit. Figure 6-19: The Curve Fit Dialog Box - Output Format Tab 6-38 MRX Revelation Manual Chapter 6 Generating and Editing Assays 6.9 Ratio 6.9 Ratio The Ratio processing dialog box - Ratio Equations tab (Figure 6-20) is used to convert raw data into data with a different scale. Ratio data is output as a matrix or table of converted results. This topic is discussed in detail in Section 10.5.2). Figure 6-20 The Ratio Dialog Box - Ratio Equations Tab MRX Revelation Manual 6-39 6.10 Spreadsheet Chapter 6 Generating and Editing Assays 6.10 Spreadsheet 6.10.1 Spreadsheet Mode - Spreadsheet Tab The Spreadsheet Mode is used to establish a spreadsheet so that equations and formulas can be entered into individual wells for non-standard data manipulations. This topic is discussed in detail in Formatting Reports and Exporting Data (Chapter 11). 6-40 MRX Revelation Manual Chapter 6 Generating and Editing Assays 6.11 Report Options 6.11 Report Options The report options feature is designed to allow you to choose the contents and order of the results report, to define data matrix settings and to specify special export formats. When you select a tab, the dialog box changes to display the options and default settings for that tab. Any new settings you select will take effect when you close the dialog box. This topic is discussed in detail in Formatting Reports and Exporting Data (Chapter 11). MRX Revelation Manual 6-41 6.12 Assay Options Chapter 6 Generating and Editing Assays 6.12 Assay Options 6.12.1 Assay Options The Assay Options Tab is used to establish parameters for a number of miscellaneous parameters and includes three tabs; Area Statistics, Processing Order and Area Statistics. . 6.12.2 The Assay Options Dialog Box - Area Statistics Tab The Assay Options dialog box - Area Statistics tab (Figure 6-21) is used to indicate that various statistical processes should be carried out for different areas of the plate. An area is the collection of wells for which the statistical analysis is desired. The program will calculate the mean, standard deviation, standard error mean and coefficient of variation for each area. Figure 6-21 The Assay Options Dialog Box - Area Statistics Tab 6-42 MRX Revelation Manual Chapter 6 Generating and Editing Assays 6.12 Assay Options Up to 96 areas (labelled 0 to 95) can be created. Each area may contain as many wells as you wish, from anywhere on the plate. A well can be in one and only one area. The following operations can be done to define the area: ! To place a single well location in an area: Type a number into the relevant box. ! To place a row in an area: Type an area number into the first well in the row and click on the letter next to the row. ! To place a column in an area: Type an area number into the top well in the column and click on the number above the column. ! To clear a single well location from an area: Delete the area number from the relevant box using the Delete key. ! To clear a row: Delete the area number from the first well in the row and click on the letter next to the row. ! To clear a column: Delete the area number from the top well in the column and click on the number above the column. ! To clear all the area assignments: Click Clear. 6.12.3 Assay Options Dialog Box - Processing Order Tab The Assay Options dialog box - Processing Order tab (Figure 6-22) is used to indicate in what order the operations programmed in other screens will be performed. Figure 6-22 Assay Options Dialog Box - Processing Order Tab MRX Revelation Manual 6-43 6.12 Assay Options Chapter 6 Generating and Editing Assays The buttons on the left will be active if the option is enabled (e.g. if you have enabled Curve fit, the Curve Fit button will be active). To activate an option, click on the button and it will appear in the list. Note… If you select more than one data processing option, their order in the assay is very important, as each option will operate on the last option's processed data. Note… You cannot pass a Parallel Line Bioassay to another processing option. 6.13.4 Assay Options Dialog Box - Sample ID Setup Tab The Assay Options dialog box - Sample ID Setup tab (Figure 6-23) is used to assign sample ID’s to the various wells on the plate. Figure 6-23 The Assay Options Dialog Box - Sample ID Setup Tab 6-44 MRX Revelation Manual Chapter 6 Generating and Editing Assays 6.12 Assay Options By default, every sample and replicate is selected and indicated by a diamond adjacent to the sample. ! Clear All is used if you do not want SIDs to be assigned to any of the wells, or if you want to start again from scratch. ! Undo is used to undo any changes you have made either since you selected the Sample ID’s tab, or since you last pressed the Undo button. ! Select All is used to assign sample IDs to every well on the plate, click on Select All. ! Split Replicates is used if you want sample IDs to be applied to whole samples, regardless of the number of replicates they contain, un-check the Split Replicates box. If you want the sample IDs to be assigned to every replicate, check the Split Replicates box. MRX Revelation Manual 6-45 Chapter 7 Endpoint Analyses 7.1 Overview Chapter 7 Endpoint Analyses 7.1 Overview In an endpoint analysis, the reaction forming the chromophore (color) is allowed to go to completion before the plate is read. The O.D. (Optical Density) is measured and then used to determine the concentration of the compound of interest. This chapter includes: • Generating an Assay for an Endpoint Analysis (Section 7.2) • Starting an Assay (Section 7.3) MRX Revelation Manual 7-1 7.2 Generating an Assay for an Endpoint Analysis Chapter 7 Endpoint Analyses 7.2 Generating an Assay for an Endpoint Analysis To generate an Endpoint Analysis: 1 Select New Assay on the File menu. 2 Select Endpoint on the Assay Type dialog box. 3 Develop the assay as described in Chapter 6. The Start Mode tab on the Reader Control dialog box (Figure 7-1) is provided to indicate when the O.D. of the sample should be read. Figure 7-1 The Reader Control Dialog Box - Start Mode Tab Four options are provided: 7-2 ! Immediate - the data is acquired as soon as the assay is initiated. ! When T1 reaches xxx O.D. - do not use. ! When T1 reaches O.D./min - do not use. ! After xxx minutes - the data is collected after the indicated time has elapsed. This option can be used if a delay in the reading is desired. As an example, if the chromophore is developed while the microplate is in the reader, a delay time could be programmed to ensure that the reaction is allowed to go to completion. MRX Revelation Manual Chapter 7 Endpoint Analyses 7.2 Generating an Assay for an Endpoint Analysis A typical assay is presented in Figure 7-2. Figure 7-2 A Typical Endpoint Assay MRX Revelation Manual 7-3 7.3 Starting an Assay Chapter 7 Endpoint Analyses 7.3 Starting an Assay Open the desired assay. If a password has been assigned to the assay, a password dialog box will be presented and the password must be entered if you want to edit the assay. If you simply want to run the assay, it is not necessary to enter the password and the Cancel button should be pressed. To run an assay, press Run Plate on the File menu (or use the Run Plate icon on the Tool Bar) to present the Run Plate dialog box (Figure 7-3). Figure 7-3 The Run Plate Dialog Box 7-4 MRX Revelation Manual Chapter 7 Endpoint Analyses 7.3 Starting an Assay Plate ID ! Plate ID - A plate ID is used as a temporary filename for the plate data file which is created when the assay ends. If you have selected Default Plate IDs in the assay, a default ID will appear in the Plate ID field box; otherwise you will have to assign the ID manually. Plate IDs can be assigned either by typing a name into the Plate ID text box, or by scanning a barcode on the side of the microplate. If you are using the Barcode option, you should make sure the scanner is set up to decode the correct type of barcode. For additional information, refer to the Barcode Program User Manual. ! Scan Barcode before run - To automatically read the plate barcode before the plate is run, place a check mark in the Scan Barcode before run box. As an alternative, you can read the barcode at any time by pressing the Read Barcode Now button. Options ! Auto save - The Auto save command is linked to the plate ID option. When you enter a plate ID or scan a barcode, RevelationTM saves your data in a file using the plate ID as the filename, with a file extension of *.dat. The default destination is in the Plate Data folder. To change the default destination, go to the Directories tabbed folder in the Options command on the Utility menu. If you intend to recall plate data at a later date, you should always assign the ID as a permanent filename. ! Print Results - If you do not want the data to be printed automatically, un-check the Print Results check box (stored data can be printed using the Print command on the File menu after collection). ! Search - If you created a sample ID file using the Sample ID (SID) entry on the Utility menu, Revelation can automatically search for this file. Sample ID files are saved by default in the SID directory. If you want to search for the file automatically, you should make sure it has the same name as the plate ID. To link sample IDs to the template, click on Use Template. Operator Indicate the name of the individual performing the assay. Assays An assay list is used to indicate the assay(s) to be run. Assay lists may contain a single assay or a number of assays. If you place more than one assay on a plate, you can either over-lap some assays (so that more than one assay will run on the overlapped wells) or you can run each assay on different wells. MRX Revelation Manual 7-5 7.3 Starting an Assay Chapter 7 Endpoint Analyses The Select list box contains a list of all your assays. ! Open - Presents the Open dialog box with a listing of all previously saved assay checklists. ! Save - Saves an assay checklist. Checklists are saved by default in the main RevelationTM directory (using an .LST extension). If the checklist has not been saved before, Revelation displays the standard Save As dialog box. ! Add - Places the highlighted assay in the Select field into the Selected Assay(s) field. ! Remove - Removes the highlighted assay from the Selected Assay(s) field. ! Clear - deletes all the assays from the Selected Assay(s) field. ! First well location - Select an assay in the Selected Assay(s) field and type in the well location where you want this assay to start. ! Number of wells – Enter 96 for this value for each assay. Note… The program allows you to assign fewer wells to an assay than were originally programmed into the assay template. For example, if your assay contains 96 Test samples, but this run only requires 10 test samples, you can assign 10 wells to the assay. Revelation will reduce the template to fit into 10 wells. The program reduces templates by removing Test samples from the end of the template until the required number of wells is left. All non-Test samples are left in the same positions relative to the end of the plate. If it is not possible to reduce the template, the program prints an error message and will not reduce the template. ! Orientation - If you have assigned less than 96 wells to any assay on the plate, you must select Columns or Rows, to specify the plate orientation. As an example if Assay 1 contains 12 wells and starts at A1 and you select Columns, the program will place the assay in wells A1 to H1 and A2 to D2 (if you select Rows, Revelation will place the assay in wells A1 to A12). Note… The selected orientation applies to the whole plate and not just the highlighted assay. If you change the orientation when some assays have already been positioned on the plate, you will have to change the First well assignments, as these depend on the template orientation. Note… Do not combine different assay types on the same plate. For example, do not combine kinetic assays and endpoint assays, or agglutination assays and nonagglutination assays on the same plate. 7-6 MRX Revelation Manual Chapter 7 Endpoint Analyses 7.3 Starting an Assay To initiate the run, press Start. In a few instances, the assay will not be automatically initiated: ! If you inserted a Shake operation, the program will shake the plate before reading it. ! If the assay requires that the assay temperature is not the ambient temperature, the reader will check that the plate is as at the appropriate temperature. If the temperature is not correct, a dialog box will be presented indicating that the present temperature and programmed temperature. The operator will be given the option to Read Now or Abort the Assay. The temperature will be driven to the set point, and you can wait until the present temperature is at (near the desired temperature) before starting the assay. ! In some cases, the analyst will be prompted to enter additional information before proceeding (e.g. sample names) based on the selection made in the assay. ! For systems in which the computer is external, the computer will initiate communication with the reader. At the conclusion of the assay, the desired report will be presented in the desired format along with the calculations that were included in the assay. In addition, data will be saved and or exported as indicated in the assay. MRX Revelation Manual 7-7 Chapter 8 Kinetic Analyses 8.1 Overview Chapter 8 Kinetic Analyses 8.1 Overview Continuous sampling of reactants as they are consumed or products as they are formed measured without interfering with the progress of the reaction is defined as a kinetic analysis. In a kinetic analysis, the rate of change in the O.D. is measured and related to the concentration of the compound of interest. Measuring the optical density is an ideal way to measure changes in reaction rates because the Beer-Lambert law states that this change is directly proportional to concentration. The user can select the time interval for data collection and view the data as it is being collected. It should be noted that the final form of the data is not in absolute optical density but reflects the increase or decrease in optical density as it changes over time, according to the user-selected calculation mode. This chapter includes: ! Generating an Assay for a Kinetic Analysis (Section 8.2) ! Starting an Assay (Section 8.3) ! During the Assay (Section 8.4) MRX Revelation Manual 8-1 8.2 Generating an Assay for a Kinetic Analysis Chapter 8 Kinetic Analyses 8.2 Generating an Assay for a Kinetic Analysis 8.2.1 Basic Assay Information To generate a Kinetic Analysis assay: 1 Select New Assay on the File menu. 2 Select Kinetic on the Assay Type dialog box. 3 Develop the assay as described in Chapter 6. Several dialog boxes on the Reader Control dialog box are used when kinetic assays are employed as described below. 8.2.2 Start/Stop Mode The Reader Control dialog box - Start/Stop Mode tab is presented in Figure 8-1. Figure 8-1 Reader Control Dialog Box, Start/Stop Mode 8-2 MRX Revelation Manual Chapter 8 Kinetic Analyses 8.2 Generating an Assay for a Kinetic Analysis The Start/Stop Mode tab is used to indicate when the program should take the first reading, relative to the start of the assay (the assay starts when you click on Start in the Run Plate dialog box) and the last reading. There are four options for the Start time: ! Immediate - the first reading is taken when the assay is initiated. ! When a specified sample (Tx) reaches a user specified O.D. the entire plate will be read. Note… RevelationTM will allow you to enter a sample which does not exist, but the measurement will not be performed unless you create the sample before running the assay. ! When the rate of change of the O.D. for a specific sample exceeds a user specified rate, the reading of the plate will begin. ! After a fixed period of time (range 1 - 3599 minutes) the reading of the plate will begin. ! Stop mode is similar to Start mode and is used to indicate when the measurement should stop. The After...readings entry is used to indicate that the measurement should stop after the specified number of readings have been taken. 8.2.3 The Reader Control Dialog Box - Kinetic Time Interval The Reader Control dialog box - Kinetic Time Interval tab is presented in Figure 8.2. MRX Revelation Manual 8-3 8.2 Generating an Assay for a Kinetic Analysis Chapter 8 Kinetic Analyses Figure 8-2 Reader Control Dialog Box, Kinetic Time Interval The Kinetic Time Interval tab is used to define the time interval(s) between the kinetic readings. Time Interval The Time Interval selection is used to indicate if the time interval between readings should be the same (Fixed) number of minutes or different between different readings (Variable). 8-4 ! Fixed - activates the Fixed Time Interval field. The analyst should indicate the desired Fixed Time interval in the field immediately below the Time Interval area. ! Variable - activates the Variable Time Interval field. The analyst can enter the time for the first reading and for each successive reading. The time between readings may vary if the kinetic reaction starts off very fast, in which case a very short time interval is needed, and then tapers off to a slow rate of O.D. change, in which case the time interval can be increased. By default, the program lists the kinetic reading intervals in the Variable Time Interval list box at 60 second intervals. If you want to edit an individual interval, click on the interval, type the new interval into the Reading # field and then click on any other reading to assign the interval. To edit a group of intervals, click on the interval you want to start at, enter the new time interval in the Auto increment box and click Fill. The maximum interval is 1 hour and the minimum interval for the Internal MRX is 4 seconds (for the External MRX the minimum interval is 12 seconds). MRX Revelation Manual Chapter 8 Kinetic Analyses ! 8.2 Generating an Assay for a Kinetic Analysis The Auto Increment field is used if you want to have a reading at a fixed time increment (after you have set the times, they can be edited as described above). Note… The number of points that should be collected can be indicated on the Start/Stop tab (Figure 8-1). 8.2.4 The Reader Control Dialog Box - Calculation Mode Tab The Reader Control dialog box - Calculation Mode tab (Figure 8-3) is used to specify the calculation mode and other miscellaneous calculation options. Figure 8-3 The Reader Control Dialog Box - Calculation Mode Tab Calculation Mode Calculation Mode describes how the data is to be processed in any of the programmable options. The operator should choose one option from the following: OD/min options - measures the rate of the reaction via the rate of change of O.D. as a function of time. MRX Revelation Manual 8-5 8.2 Generating an Assay for a Kinetic Analysis Chapter 8 Kinetic Analyses OD/min (Total) - measures the rate of the reaction over the entire time period and is calculated by subtracting the O.D. of the reading at the first time point from the O.D. of the reading at the last time point, which is then the average value over the whole of all the readings. OD/min (Vmax) - measures the rate when the reaction rate is greatest (Vmax) by measuring the change in O.D. between any two time points. OD/min (by Linear Regression) - measures the rate by drawing the best least squares linear fit between the O.D.s at all the time points. Time options - measure the time taken for the reaction to reach a particular point. Time (to Max OD) - measures the absolute time that the reaction takes in each individual well to reach to the maximum, constant O.D. Time (to Max OD/min) - measures the time required for the maximum change in O.D. as a function of time (OD/min). It is the point where the change in O.D. divided by the time is at its greatest or steepest part of the curve. Time (to defined OD) - measures the time to the user selected O.D., which is entered in the field adjacent to the entry. Time (to defined OD/min) - measures the time to the user selected O.D./min, which is entered in the field adjacent to the entry. Time (to relative OD/min) - measures the time to the user selected O.D./min, which is entered in the field adjacent to the entry. The measurement is made relative to the first reading taken (to relative O.D.). The relative value is entered in the field adjacent to the entry. Monitor - monitors a specified sample (e.g. T1). When the observed O.D. reaches the O.D. limit, all the other readings are taken. The specified sample should be entered in the first field and the O.D. limit in the second field. Note… RevelationTM will allow you to enter a sample as the reference which does not exist, but the measurement will not be performed unless you create the sample before running the assay. Moving Average - allows for averaging of each data point obtained with a specified number of points on either side, before plotting the graph. This can smooth out the graph by reducing the effect of excessively high or low data points that would otherwise have caused "bumps" in the curve. Minimum: 1 (no smoothing). Maximum: One less than the number of kinetic readings. 8-6 MRX Revelation Manual Chapter 8 Kinetic Analyses 8.2 Generating an Assay for a Kinetic Analysis Blank Subtraction Blank Subtraction - describes the desired mode of blank subtraction; which is used to eliminate the O.D. of reagents which should not be included in the final O.D. Blank wells (B) MUST be defined on the template before blank subtraction can occur. Blanks may be single wells or an average of wells. Intrarecord - subtracts the blank from every kinetic reading. Post Kinetic - subtracts the blank from the calculated final result for each well. Use Readings Use Readings allows the analyst to select a range of readings so that readings at the beginning or at the end will not be used in the calculations of changes in O.D. over time. The readings outside the range will not be processed, but they will used to plot the Kinetic graphs. All - no readings will be deleted. Range - indicates points or data from which numbered readings are to be included. Result Format Result Format - used to indicate if the data should be reported as O.D. or mO.D. (milli) values. If the results are reported as mO.D., the reader will multiply each O.D. by 1000 and remove the decimal point and decimal places. This option is similar to the Results Scaling option (see below) except that the results are reported in different units. Cut-off - used to eliminate kinetic readings toward the end of the assay. The operator can enter the desired cut-off value (in O.D.). Any reading for an individual well above this cut-off value will not be processed and will not be displayed in the Kinetics graph for that well. The reader will continue to read the plate until all wells have reached this value or the run is aborted. Note… If the data is decreasing with time, the cut-off value will represent a lower limit. The Cut-off can be absolute or relative to the first data point. Click on Absolute or Relative and enter the cut-off value. Miscellaneous Options Data Increase with Time - If a calculation mode with an O.D. limit is used, this field is used to indicate if the O.D. value should be increasing or decreasing towards this limit. A check mark indicates that results are increasing with time. MRX Revelation Manual 8-7 8.2 Generating an Assay for a Kinetic Analysis Chapter 8 Kinetic Analyses Results Scaling - If the difference between the O.D. for each point is expected to be small, this command allows for scaling to view the data more easily. Minimum scaling: x 1 (enter 1) Maximum scaling: x 29999 (enter 29999) Data Log - Not used for kinetic assays. Display Well - used to indicate that a specific well should be indicated on the display, throughout the assay (this option is useful if you are running a particularly long assay and you want to make sure the reaction is progressing as expected). 8.2.5 Kinetic Graphs Tab The Reader Control dialog box - Kinetic Graphs tab (Figure 8-4) is used to define the kinetics plots that will be output in the results and presents a matrix denoting the plate wells. Figure 8-4 The Reader Control Dialog Box - Kinetic Graphs Tab Mode Mode - The Mode selection is used to indicate if the plate location should be indicated in each box on the plot. 8-8 MRX Revelation Manual Chapter 8 Kinetic Analyses 8.2 Generating an Assay for a Kinetic Analysis Location - displays the plate matrix in terms of well locations. Replicate - display the plate matrix in terms of the samples you defined using the Template command (Section 6.4). Clear Clear - deletes all the currently selected graphs. A typical assay is presented in Figure 8-5. MRX Revelation Manual 8-9 8.2 Generating an Assay for a Kinetic Analysis Chapter 8 Kinetic Analyses Figure 8-5 A Typical Kinetic Assay 8-10 MRX Revelation Manual Chapter 8 Kinetic Analyses 8.3 Starting an Assay 8.3 Starting an Assay Open the desired assay. If a password has been assigned to the assay, a password dialog box will be presented. The password must be entered if you want to edit the assay. If you simply want to run the assay, it is not necessary to enter the password and the Cancel button should be pressed. To run an assay, press Run Plate on the File menu (or click on the Run Plate button icon on the Tool Bar) to present the Run Plate dialog box (Figure 8-6). Figure 8-6 The Run Plate Dialog Box MRX Revelation Manual 8-11 8.3 Starting an Assay Chapter 8 Kinetic Analyses Plate ID Plate ID - A plate ID is used as a temporary filename for the plate data file which is created when the assay ends. If you have selected Default Plate Ids in the assay, a default ID will appear in the Plate ID box; otherwise you will have to assign the ID manually. Plate IDs can be assigned either by typing a name into the Plate ID text box, or by scanning a barcode on the side of the microplate. If you are using the Barcode option, you should make sure the scanner is set up to decode the correct type of barcode. For more information,refer to the Barcode Program User Manual. Scan Bar Code before run - To automatically read the plate barcode before the plate is run, place a check mark in the Scan Barcode before run box. As an alternative, you can read the barcode at any by pressing the Read Barcode Now button. Options Auto save plate data as - The Auto save plate data as command is linked to the plate ID option. When you enter a plate ID or scan a barcode, Revelation displays the resulting filename in the Options box along with the default destination. The default destination is determined by the Options command on the Utility menu. If you intend to recall plate data at a later date, you should always assign the ID as a permanent filename. Print Results - If you do not want the data to be printed automatically, un-check the Print Results check box (stored data can be printed using the Print command on the File menu after collection). Search - If you created a sample ID file using the Sample ID Entry on the Utility menu, Revelation can automatically search for this file. Sample ID files are saved by default in the SID directory. If you want to search for the file automatically, you should make sure it has the same name as the plate ID. To link sample IDs to the template, click on Use Template. Assays An assay list is used to indicate the assay(s) to be run. Assay lists may contain a single assay or a number of assays. If you place more than one assay on a plate, you can either overlap some assays (so that more than one assay will run on the overlapped wells) or you can run each assay on different wells. 8-12 MRX Revelation Manual Chapter 8 Kinetic Analyses 8.3 Starting an Assay The Select list box contains a list of all your assays. Open - Presents the Open dialog box with a listing of all previously saved assay checklists. Save - Saves an assay checklist. Checklists are saved by default in the main Revelation directory (using an .LST extension). If the checklist has not been saved before, Revelation displays the standard Save As dialog box. Add - Places the highlighted assay in the Select field into the Selected Assays field. Remove - Removes the highlighted assay from the Selected Assays field. Clear - deletes all the assays from the Selected Assays field. First well - Select an assay in the Check list box and type in the well location when you want this assay to start. Number of wells – Enter 96 for this value for each assay. Note… The program allows you to assign fewer wells to an assay than were originally programmed into the assay template. For example, if your assay contains 96 Test samples, but this run only requires 10 test samples, you can assign 10 wells to the assay. Revelation will reduce the template to fit into 10 wells. The program reduces templates by removing Test samples from the end of the template until the required number of wells is left. All non-Test samples are left in the same positions relative to the end of the plate. If it is not possible to reduce the template, the program prints an error message and will not reduce the template. Orientation - If you have assigned less than 96 wells to any assay on the plate, you must select Columns or Rows, to specify the plate orientation. As an example if Assay 1 contains 12 wells and starts at A1 and you select Columns, the program will place the assay in wells A1 to H1 and A2 to D2 (if you select Rows, Revelation will place the assay in wells A1 to A12). Note… The selected orientation applies to the whole plate and not just the highlighted assay. If you change the orientation when some assays have already been positioned on the plate, you will have to change the first well assignments, as these depend on the template orientation. MRX Revelation Manual 8-13 8.3 Starting an Assay Chapter 8 Kinetic Analyses Note… Do not combine different assay types on the same plate. For example, do not combine kinetic assays and endpoint assays, or agglutination assays and nonagglutination assays on the same plate. To initiate the run, press Start. In a few instances, the assay will not be automatically initiated: ! If you inserted a Shake operation, the program will shake the plate before reading it. ! If the assay requires that the assay temperature is not the ambient temperature, the reader will check that the plate is as at the appropriate temperature. If the temperature is not correct, a dialog box will be presented indicating that the present temperature and programmed temperature. The operator will be given the option to Read Now or Abort the Assay. The temperature will be driven to the set point, and you can wait until the present temperature is at (near the desired temperature) before starting the assay. 8-14 ! In some cases, the analyst will be prompted to enter additional information before proceeding (e.g. sample names) based on the selection made in the assay. ! For systems in which the computer is external, the computer will initiate communication with the reader. MRX Revelation Manual Chapter 8 Kinetic Analyses 8.4 During the Assay 8.4 During the Assay Revelation will display and update the data each time a reading is taken. A typical display is presented in Figure 8-7. Figure 8-7 Typical Display During a Kinetic Analysis Note… The lag of a few seconds for display of kinetic data is due to the requirement that data be transmitted and processed. A number of modes are available for viewing the data: ! Revelation shows a matrix of 96 miniature graphs, one for every well location (default mode). ! To view an individual well, click on the well location required. ! To view a graph for a entire sample (when replicates are used), select Replicate mode and then click on any replicate in the sample. ! To view a graph showing each well in a column, click on the column label. ! To view a graph showing each well in a row, click on the row label. ! To view a matrix showing the current O.D. for each well, select Display Values. MRX Revelation Manual 8-15 8.4 During the Assay Chapter 8 Kinetic Analyses Note… Do not alternate between the viewing modes while a reading is being taken as this may interfere with the assay timings. At the conclusion of the assay, the desired report will be presented in the desired format along with the calculations that were included in the assay. In addition, data will be saved and or exported as indicated in the assay. 8-16 MRX Revelation Manual Chapter 9 Agglutination Analyses and TCG Mode 9.1 Agglutination Chapter 9 Agglutination Analyses and TCG Mode Note… Agglutination Analysis and TCG Mode are only available with MRX RevelationTM systems which are configured with an internal computer. 9.1 Agglutination 9.1.1 Introduction to Agglutination Testing An agglutination test is used for microbial identification, monitoring cell growth or determining red blood cell types. Antibodies cause the agglutination reaction by fusing with antigens on the surfaces of cells. Since most cells repel each other (because of their electrical charge), large numbers of antibody links are needed for agglutination. As an alternative, particles which have been artificially coated with antigen can also be used. Various types of particles are commonly used, including turkey red cells (which work well because they are large and sediment quickly), bentonite, polystyrene and latex. Agglutination tests are commonly carried out in the liquid phase. When the test is performed, two responses are possible: ! No cross-linking has occurred - cells fall to the bottom of the well. ! Cross-links formed - cells form a lattice structure in which they are evenly divided. 9.1.2 The Agglutination Measurement The reader measures the extent of the agglutination reaction by taking 32 readings across the well as shown in Figure 9-1. The reader measures %T (the fraction of light that is transmitted through each point in the well). MRX Revelation Manual 9-1 9.1 Agglutination Chapter 9 Agglutination Analyses and TCG Mode Figure 9-1 Measuring the Agglutination Reaction The reader plots the %T against the well position to form a well profile. If a well contains a clear area and a dark area, the clear area will have a high %T and the dark area will have a low %T. Figures 9-2 through 9-5 show typical results of four agglutination conditions. 1 An empty well transmits all the light, giving a uniform profile of 100% T. Figure 9-2 An Empty Well 2 The cells agglutinate to form a murky liquid and light is transmitted at an even level across the well with a %T less than 100%. 9-2 MRX Revelation Manual Chapter 9 Agglutination Analyses and TCG Mode 9.1 Agglutination Figure 9-3 Cells Disperse 3 The cells coagulate and settle to the bottom of the well in a central stain and the rest of the sample is clear (close to 100% T). The profile shows 100% T at the sides of the well with a small % T in the region of the dark stain. Figure 9-4 Coagulated Cells 4 If the cells do not agglutinate but settle to the bottom of the well in a ring and the rest of the sample is clear (close to 100%T). The profile shows high transmission in the clear areas of the well but shows two troughs that correspond to a cross section through the ring. MRX Revelation Manual 9-3 9.1 Agglutination Chapter 9 Agglutination Analyses and TCG Mode Figure 9-5 Ring Formation 9.1.3 Agglutination Calculations The user can generate four parameters which can be used to calculate well profiles from the data obtained by scanning the well. When you are creating agglutination assays, you must specify how the reader is to determine if the results are positive or negative. There are two general approaches that can be used: ! Enter a formula based on the four parameters that are used to define positive and negative threshold ranges. ! Establish a list of rules to which results must conform to determine if a result is to be considered as positive or negative. 9.1.4 Formula Calculation The Formula Calculation mode allows you to enter equations using any or all of the agglutination parameters. After the plate has been read, your formula is applied to the four agglutination parameters to produce a formula value. In this approach a threshold matrix must be defined in formula mode (see Section 9.1.6). The formula that you construct depends on the type of test that you are running, so it is best to calibrate your formula for every new test that you perform. 9-4 MRX Revelation Manual Chapter 9 Agglutination Analyses and TCG Mode 9.1 Agglutination 9.1.5 Rules Calculation Rules calculation lets you enter sets of rules that the reader uses to interpret results. It is necessary for you to enter one set of rules for positive results and one set for negative results. Once the plate has been read, each well result is compared to the positive and negative rules. If the result meets the criteria set by the positive (negative) rule, it is considered as a positive (negative). If the result does not meet either criterion, it is described as questionable. 9.1.6 Setting Rules and Formulae The rules and formulae that you enter will change to suit the test that you are performing and the relative importance of the four agglutination parameters. You should be aware of the way that the parameters are affected by the test when you set rules or formulae. The four agglutination parameters are derived for each well using the well’s transmission profile. The reader calculates the parameter values using a complex algorithm. MRX Revelation Manual 9-5 9.2 Tissue Culture Growth (T.C.G.) Measurements Chapter 9 Agglutination Analyses and TCG Mode 9.2 Tissue Culture Growth (T.C.G.) Measurements 9.2.1 Introduction to Tissue Culture Growth Measurements An example of Tissue Culture Growth Measurements is the cultivation of viruses using a thin layer of animal tissue. The spread of the virus is artificially limited, leading to local destruction of cells. The culture is then stained with a dye which distinguishes living tissue from dead tissue and the plaques of dead tissue can be clearly seen. The reader measures the contents of the well by taking a series of readings across the base of the well in a manner similar to that for agglutination measurements. When Tissue Culture Growth measurements are made, a flat bottom well is normally used. If a well contains a clear area (e.g. dead cells) and a dark area (e.g. live cells), the clear area will transmit a lot of light and the dark area will transmit little light. The reader will express this area on the well profile as regions of high transmission and low transmission. The reader then takes the %T from each well and averages them to give an O.D. for each well and this O.D. is used to calculate a threshold matrix (the range for this matrix is user defined). 9-6 MRX Revelation Manual Chapter 9 Agglutination Analyses and TCG Mode 9.3 Generating an Agglutination Assay 9.3 Generating an Agglutination Assay 9.3.1 Basic Assay Information To generate an Agglutination assay: 1 Select New Assay on the File menu. 2 Select Endpoint on the Assay Type dialog box. 3 Select Agglutination/T.C.G. in the Read Mode field of the Reader Options tab of the Reader Control dialog box. 4 Develop the assay as described in Chapter 6. Several dialog boxes on the Reader Control dialog box are used when Agglutination assays are employed. 9.3.2 The Reader Control Dialog Box - Start Mode Tab The Start Mode tab on the Reader Control dialog box (Figure 9-6) is provided to indicate when the O.D. of the sample should be read. Figure 9-6 The Reader Control Dialog Box - Start Mode Tab MRX Revelation Manual 9-7 9.3 Generating an Agglutination Assay Chapter 9 Agglutination Analyses and TCG Mode Four options are provided: ! Immediate - the data is acquired as soon as the assay is initiated. ! When T1 reaches xxx OD - do not use. ! When T1 reaches OD/min - do not use. ! After xxxx minutes - the data is collected after the indicated time has elapsed. This option can be used if a delay in the reading is desired. 9.3.3 The Reader Control Dialog Box - Agglutination Parameters Tab The Reader Control dialog box - Agglutination Parameters tab (Figure 9-7) is used to set a variety of operating parameters for agglutination measurements. Figure 9-7 The Reader Control Dialog Box - Agglutination Parameters Tab 9-8 MRX Revelation Manual Chapter 9 Agglutination Analyses and TCG Mode 9.3 Generating an Agglutination Assay Parameters Plate Speed - the agglutination plate speed setting determines the distance between the readings across a well. If a low setting is selected, the distance between the readings will be larger and the read will be faster. Plate speed settings are calculated via equation 9-1: Plate Speed Setting = 9.017/distance between readings (mm) 9-1 The minimum setting is 8 and the maximum setting is 50 (0.18 mm between readings). Readings/well - the number of agglutination readings per well is directly related to the plate speed setting. For example, if you set the plate speed setting at 8 (1.13mm between reads), you can not set the number of readings any higher than 8, because the well is only 7mm wide. Enter the number of readings you wish to take across the well. The minimum is 4 readings and the maximum is 32 or the plate speed setting, whichever is lower. Agglutination Calculation Modes Note… Before selecting Calculation mode, we suggest that you run a calibration test with the Data Log feature switched on to determine which mode will be most useful, and how the Agglutination parameters will affect your results. Average - takes the mean of all the readings taken across the well. Sum - adds together all the readings taken across the well. Area - measures the area under the O.D. plot for the well. Formula - calculates the result for each well, using a formula which you enter using the agglutination parameters. Generation of the formula is presented below. Rules - calculates the result for each well, and whether it is positive or negative, using user-defined rules based on the agglutination parameters as described below. Formula The Formula field is used to enter the desired formula for agglutination measurements and is activated if Formula is selected in the Calculation Mode field. At run-time, RevelationTM will calculate values for the Agglutination parameters for every well. The formula equation will then be applied to every well to interpret the data. MRX Revelation Manual 9-9 9.3 Generating an Agglutination Assay Chapter 9 Agglutination Analyses and TCG Mode Agglutination Formula equations may contain any number of characters (but they may not contain any spaces) and standard agglutination formula equation components as well as arithmetic operators (+, -, *,/, ** [exponent]), which are entered via the keyboard. Other equation components can also be entered using the Functions list box. To enter a function, double-click on it. A detailed discussion of equation writing is presented in Section 10.2.2. When you have finished entering the equation, click OK to exit the dialog box. RevelationTM checks each equation. Typical equations are: Example 1: All values must be multiplied by the average of parameters A and B. The formula should read: (A+B)/2 Example 2: All values must be multiplied by the sum of parameters A and B, minus the sum of parameters C and D. The formula should read: (A+B)-(C+D) Rules The Rules field is used to establish positive and negative rules which will be used to calculate results and is activated if Rules is selected in the Calculation Mode field. Four positive and four negative rules can be set, one for each of the four Agglutination parameters (A-D). At runtime, Revelation will calculate values for the Agglutination parameters for every well. The rules will then be applied to each well to determine whether it is positive or negative. To enter a rule for a parameter, select an inequality symbol and then a number. The following symbols can be used: 9-10 = equal to >= greater than or equal to < less than <= less than or equal to > greater than <> not equal to X the value of the parameter is not important and will not be used when calculating the results. MRX Revelation Manual Chapter 9 Agglutination Analyses and TCG Mode 9.3 Generating an Agglutination Assay Example: All results with an A parameter of more than 1.0 and a D parameter of greater than or equal to 1.0 should be recorded as positive. All results with an A parameter of less than 0.5 should be recorded as negative. For the Positive Rules, enter: A>1.0 BX CX D>=1.0 For the Negative Rules, enter: A<0.5 BX CX DX 9.3.4 The Reader Control Dialog Box - Agglutination Options Tab The Reader Control dialog box - Agglutination Options tab (Figure 9-8) is used to set a variety of operating parameters for agglutination measurements. Figure 9-8 The Reader Control Dialog Box - Agglutination Option Tab MRX Revelation Manual 9-11 9.3 Generating an Agglutination Assay Chapter 9 Agglutination Analyses and TCG Mode Data Log The Data Log field will be active if the formulas or rules options have been selected on the Agglutination Parameters tab. No - data will not be presented in tabular format. Columns - displays the information in a column by column format. Rows - displays the information in a row by row format. Note… The data log may be useful when deciding the rules or formulae to set, as it lets you see the importance of each parameter. Blanking Options Point-Point - subtracts the blank from every agglutination reading across the well. Well-Well - subtracts the blank from the calculated final result for each well. Miscellaneous Noise Filtering - smoothes out the well profile by averaging each data point with the two points on either side. Percentage Mode - calculates all the results as a percentage of a specific well. The reader will take the transmission of the specified well as 100% and 0.0 as 0%, and measure all other results against this. To use this option check the box and type in the sample. Note… The reference well must exist on the template. You cannot specify individual replicates of samples. Readings Used The program uses all the readings specified in the Readings per Well field or any selection of readings you choose. Any readings that are deleted will be discarded and will not be used when calculating the results for that well. The Select column includes all of the readings that could be used in the calculation and the Check list columns list the readings that have been selected. Add All - places all entries in the Select column field into the Check list field. Add - places the highlighted reading in the Check list field. 9-12 MRX Revelation Manual Chapter 9 Agglutination Analyses and TCG Mode 9.3 Generating an Agglutination Assay Remove - removes selected readings from the Check list field (and from the calculations). Clear - removes all readings from the Check list field (and from the calculations). 9.3.5 The Reader Control Dialog Box - Transmission Graphs Tab The Reader Control dialog box - Transmission Graphs tab (Figure 9-9) is used to specify that an Agglutination graph desired for a given well(s) is available. Figure 9-9 The Reader Control Dialog Box - Transmission Graphs Tab To plot a graph of the data from a single well, check the well location box on the matrix. Multiple plots can be obtained by selecting the appropriate well location boxes. MRX Revelation Manual 9-13 9.4 Starting an Assay Chapter 9 Agglutination Analyses and TCG Mode 9.4 Starting an Assay Open the desired assay. If a password has been assigned to the assay, a password dialog box will be presented. The password must be entered if you want to edit the assay. If you simply want to run the assay, it is not necessary to enter the password and the Cancel button should be pressed. To run an assay, press Run Plate on the File menu (or click on the Run Plate button icon on the Tool Bar) to present the Run Plate dialog box (Figure 9-10). Figure 9-10 The Run Plate Dialog Box Plate ID Plate ID - A plate ID is used as a temporary filename for the plate data file which is created when the assay ends. If you have selected Default Plate Ids in the assay, a default ID will appear in the Plate ID box; otherwise you will have to assign the ID manually. Plate IDs can be assigned either by typing a name into the Plate ID text box, or by scanning a barcode on the side of the microplate. 9-14 MRX Revelation Manual Chapter 9 Agglutination Analyses and TCG Mode 9.4 Starting an Assay If you are using the Barcode option, you should make sure the scanner is set up to decode the correct type of barcode. Refer to Barcode Setup or refer to the Barcode Program User Manual. Scan Bar Code before run - To automatically read the plate barcode before the plate is run, place a check mark in the Scan Barcode before run box. As an alternative, you can read the barcode at anytime by pressing the Read Barcode Now button. Options Auto save plate data as - The Auto save plate data as command is linked to the plate ID option. When you enter a plate ID or scan a barcode, Revelation displays the resulting filename in the Options box along with the default destination. The default destination is determined by the Options command on the Utility menu. If you intend to recall plate data at a later date, you should always assign the ID as a permanent filename. Print Results - If you do not want the data to be printed automatically, un-check the Print Results check box (stored data can be printed using the Print command on the File menu) after collection. Search - If you created a sample ID file using the Sample ID Entry on the Utility menu, Revelation can automatically search for this file. Sample ID files are saved by default in the SID directory. If you want to search for the file automatically, you should make sure it has the same name as the plate ID. To link sample IDs to the template, click Use Template. Assays An assay list is used to indicate the assay(s) to be run. Assay lists may contain a single assay or a number of assays. If you place more than one assay on a plate, you can either over-lap some assays (so that more than one assay will run on the over-lapped wells) or you can run each assay on different wells. The Select list box contains a list of all your assays. Open - Presents the Open dialog box with a listing of all previously saved assay checklists. Save - Saves an assay checklist. Checklists are saved by default in the main Revelation directory (using an .LST extension). If the checklist has not been saved before, Revelation displays the standard Save As dialog box. Add - Places the highlighted assay in the Select field into the Selected Assays field. MRX Revelation Manual 9-15 9.4 Starting an Assay Chapter 9 Agglutination Analyses and TCG Mode Remove - Removes the highlighted assay from the Selected Assays field. Clear - deletes all the assays from the Selected Assays field. First well - Select an assay in the Check list box and type in the well location when you want this assay to start. Number of wells – Enter 96 for this value for each assay. Note… The program allows you to assign fewer wells to an assay than were originally programmed into the assay template. For example, if your assay contains 96 Test samples, but this run only requires 10 test samples, you can assign 10 wells to the assay. Revelation will reduce the template to fit into 10 wells. The program reduces templates by removing Test samples from the end of the template until the required number of wells is left. All non-Test samples are left in the same positions relative to the end of the plate. If it is not possible to reduce the template, the program prints an error message and will not reduce the template. Orientation - If you have assigned less than 96 wells to any assay on the plate, you must select Columns or Rows, to specify the plate orientation. As an example if Assay 1 contains 12 wells and starts at A1 and you select Columns, the program will place the assay in wells A1 to H1 and A2 to D2 (if you select Rows, Revelation will place the assay in wells A1 to A12). Note… The selected orientation applies to the whole plate and not just the highlighted assay. If you change the orientation when some assays have already been positioned on the plate, you will have to change the First well assignments, as these depend on the template orientation. Note… Do not combine different assay types on the same plate. For example, do not combine kinetic assays and endpoint assays, or agglutination assays and nonagglutination assays on the same plate. 9-16 MRX Revelation Manual Chapter 9 Agglutination Analyses and TCG Mode 9.4 Starting an Assay Press Start to initiate the run. In a few instances, the assay will not be automatically initiated: ! If you inserted a Shake operation, the program will shake the plate before reading it. ! If the assay requires that the assay temperature is not the ambient temperature, the reader will check that the plate is as at the appropriate temperature. If the temperature is not correct, a dialog box will be presented indicating that the present temperature and programmed temperature. The operator will be given the option to Read Now or Abort the Assay. The temperature will be driven to the set point, and you can wait until the present temperature is at or near the desired temperature before starting the assay. ! In some cases, the analyst will be prompted to enter additional information before proceeding (e.g. sample names) based on the selection made in the assay. ! For systems in which the computer is external, the computer will initiate communication with the reader, but this assay option is not available. MRX Revelation Manual 9-17 9.5 During the Assay Chapter 9 Agglutination Analyses and TCG Mode 9.5 During the Assay While the reader is performing the agglutination measurements, you can: 9-18 ! Plot a graph of the data from a single well: Check the well location box on the matrix. ! Plot a graph of each well in a column or row: Check the Row or Column check box. RevelationTM plots a series of transmission graphs showing the data for each individual well in the row or column. ! Plot graphs of each individual well on the plate: Check the 96 Well Plot box. Revelation creates a matrix of 96 miniature individual graphs showing every well location. MRX Revelation Manual Chapter 10 Incorporating Decision Making Protocols into the Assay 10.1 Overview Chapter 10 Incorporating Decision Making Protocols into the Assay 10.1 Overview RevelationTM allows the analyst to develop protocols that can be used to determine and report acceptable (unacceptable) data in the report. These protocols are available for a large number of assays and, in general follow a common format. MRX Revelation Manual 10-1 10.2 Quality Control Chapter 10 Incorporating Decision Making Protocols into the Assay 10.2 Quality Control 10.2.1 Role of Quality Control Quality Control (Q.C.) equations are used to place criteria on the raw assay data, threshold data or curve fit data that validate the assay that was performed. In this mode, Well O.D.s are accepted or rejected using criteria such as comparison against a control well or against a numerical value. If the user defined criteria are not met, the data will be processed as normal but the results report will contain a message showing that the data failed Q.C. When the Q.C. Raw Data command is selected from the Settings menu, the Quality Control Raw Data dialog box (Figure 10-1) is presented. Figure 10-1 The Quality Control Raw Data Dialog Box 10-2 MRX Revelation Manual Chapter 10 Incorporating Decision Making Protocols into the Assay 10.2 Quality Control ! Equation - the Equation field is used to enter the desired equation using the operators indicated in the Function field. A detailed discussion is presented in Section 10.2.2. ! Failure Description - indicates the error message that is to be displayed if the Q.C. test is not passed. ! Q.C. Equations - lists the Q.C. equations that have been generated. The equations are processed in the order they appear on this list. Up to 12 quality controls can be used for a given assay. Note… The order of executing the equations can be very important. For example, equations containing validity expressions are used to check that a previous equation has not eliminated too many values. An equation of this type must be placed below the equation it is checking or the Q.C. will not work. ! Functions - items that are used to generate an equation. To add one of these functions into the equation, double-click on the required item. ! New - used to create a new equation. The newest equation is placed at the end of the list. When this button is pressed, a cursor will appear in the Equations field allowing the equation to be typed. As the equation is being generated, it will appear in the Equations field as well as in the Q.C. equations field. When the equation is complete, press New again to enter another equation (or press OK to close the dialog box). ! Move Up/Down - used to change the order of the equations in the Q.C. equations list. To move an equation, select it in the Q.C. equations list box and then select Move Up or Move Down. ! Full QC Report - indicates that all of the Q.C. data (equations, values, etc.) should be included in the results report. If this option is desired, place a check mark in the Full Q.C. report check box. ! Suppress Results if QC Fails - indicates that results should not be printed if Q.C. fails. If this option is desired, place a check mark in the Suppress results if Q.C. fails check box. ! Lot Specific Checking of Control Values - used to indicate if the program should check calculated values on controls against lot-specific values found on the reagent container or package insert. If this option is desired, place a check mark in the Lot specific checking of control values check box. MRX Revelation Manual 10-3 10.2 Quality Control Chapter 10 Incorporating Decision Making Protocols into the Assay 10.2.2 Creating Quality Control Equations The following rules must be used when creating Quality Control equations. 1 Equations may contain only standard Quality Control equation components and they may not contain any spaces, except in conditional expressions. 2 When conditions are used, you must insert a space after IF, before ELSE and before and after THEN. 3 Numbers, arithmetic operators (+, -, /, *, ** [exponent]), brackets (up to six levels of brackets) and well values can be entered using the computer keyboard. Other components of the equation can also be entered using the Functions list box or via the computer keyboard. To enter a function, double-click on it. Well Values can be entered as the average value of a well type or sample or as the individual value of a sample replicate. For an endpoint assay, the value in the well will be in O.D. units. For a kinetic assay, the value will be in O.D./min units or a time value. Typical well values are: T represents the mean of all the Test well values. T1 represents the mean of the replicates of T1 (if T1 contains multiple replicates) or the individual value of T1. T1.1 represents the value of the first replicate of T1. T1i represents any individual replicate of test one. 4 The following logarithmic functions can be used: Log: Base 10 logarithm Alog: Inverse base 10 logarithm Ln: Natural logarithm Exp: Inverse natural logarithm 5 For the Minimum/Maximum of a group of values, MIN or MAX represents the highest or lowest value on the plate, or within a group of values. The group of values may be a well type, or a sample if it contains multiple replicates. As examples: MIN(PC) is the lowest value of all the Positive Control samples. MIN is the lowest value on the plate. 10-4 MRX Revelation Manual Chapter 10 Incorporating Decision Making Protocols into the Assay 10.2 Quality Control 6 CV is used to represent the coefficient of variation within a group of values. The group of values may be a well type, or a sample if it contains multiple replicates. As an example, CV(T1) is the value inserted into the equation for the coefficient of variation between every replicate of Test 1. 7 SD is used to represent the standard deviation within a group of values. The group of values may be a well type, or a sample if it contains multiple replicates. As an example, SD(T) is the value inserted into the equation for the standard deviation between every test sample. 8 Variables represent values which must be entered at runtime. Five variables are allowed per assay. As an example variable1 could be used. 9 For each sample of a well type, the expression i is used. As an example the relationship: 0.75*C<Ci<1.25*C is used to indicate that each control sample must be within 25% of the mean of the Control samples, or that well is removed from the calculations. Note… Expressions containing i often lead to values being excluded from the calculations. If every value in a certain well type is excluded and this well type is used in other Q.C. equations, the Q.C. operation will not work properly. To solve this, each equation containing i should be accompanied by a Validity expression. This will ensure that if too many values are rejected the test will fail. 10 Median represents the value in the middle of the list of values. If all values in the group are listed, the median is the value in the middle of the list. If the list contains an even number of values, the median is the mean of the middle two values. The group of values may be a well type, or a sample if it contains multiple replicates. As an example, Median (C) is used to calculate the median of all the Control values. 11 Valid Number of Values - valid indicates that a specified number of values within a group must pass the other Q.C. equations otherwise the data fails Q.C. The group of values may be a well type, or a sample if it contains multiple replicates. As an example, valid(PC)>=3 means that the number of valid PC samples must be greater than or equal to 3 or the data fails Q.C. 12 An equal comparison is represented by ==. It indicates that one value must be equal to another. As an example, NC1.1==2.953 means that the first replicate of NC1 must equal 2.953, or the data fails Q.C. MRX Revelation Manual 10-5 10.2 Quality Control Chapter 10 Incorporating Decision Making Protocols into the Assay 13 An assignment expression is represented by =. It indicates that, depending on certain criteria, a well type, sample or replicate should be assigned a certain value. As an example, the expression: If NCi<0.0 then NCi=0.0 is used to indicate that if every NC value is less than 0.0, then let every NC value be assigned a value of 0.0. 14 The conditions - If, then and else conditions are used to set criteria for Q.C. As an example, the expression: If PC<0.2 then NC>0.5 else NC>0.1 has the following interpretation – If the average PC value is less than 0.2 then the average NC value must be more than 0.5 else the average NC value must be more than 0.1 If these conditions are not met, the data will fail the Q.C. test. 15 Verify Number of Values - verify represents a verify values expression. This indicates that a specified number of values within a group must be within specified limits, otherwise the data fails Q.C. The group of values may be a well type, or a sample if it contains multiple replicates. Verify expressions take the form: Verify (value, limit, mode) Value - The value may represent: ! A well type, in which case RevelationTM checks the number of verified samples in the specified well type. ! A sample, in which case Revelation checks the number of verified replicates in the specified sample. Limit - The limit determines the range into which values must fall to be verified. A limit may be: 10-6 ! A number. For example, if the value is PC, the mode is 0 and the limit is 0.2: Revelation checks that every PC sample is within 0.2 of the average of all the samples. ! A percentage. For example, if the value is PC, the mode is 0 and the limit is 20%: Revelation checks that every PC sample is within 20% of the average of all the samples. ! A standard deviation. For example, if the value is PC, the mode is 0 and the limit is 1.5 SD: Revelation checks that the standard deviation of the PC samples is within 1.5 SD. MRX Revelation Manual Chapter 10 Incorporating Decision Making Protocols into the Assay 10.2 Quality Control As an example, the relationship: verify(T,10%,2)>=3 means that the number of verified Test samples must be greater than or equal to 3. A verified sample is one which falls within 10% of the mean of all the other Test samples. When you have finished entering equations and click OK to exit the dialog box, the program checks each equation. If any of the equations are not valid, an error message telling you which equation is invalid is presented. Most errors are due to small errors such as spelling, the order of arithmetic operators, etc. 10.2.3 Typical Equations This section includes a few examples for a template that includes 4 NC’s (negative controls) and 3 PC's (positive controls). 1 If you want a criteria that if any NC is greater than 25% higher or lower than the mean of all the NC's, it must be rejected, the following equation would be used: 0.75*NC<=NCi<=1.25*NC 2 If you want a criteria that if one NC fails the first quality control equation, the test must be rejected, the following equation would be used: valid(NC)>=3 3 If you want a criteria that if the average NC must not be greater than 0.2 but if the average PC is greater than 0.7, average NC’s of up to 0.3 will be accepted, the following equation would be used: If PC>0.7 then NC<=0.3 else NC<=0.2 4 If you want a criteria that if at least 2 of the PC samples must be within 10% of the mean of the other PC values, the following equation would be used: Verify(PC,10%,1)>=2 5 If you want the average of the Negative Controls to be more than 0.5 O.D., then enter: NC>0.5. 6 If the average of the Positive Control O.D.s must be less than 20% of the average of the Negative Control O.D.s, then type: PC<0.2*NC. MRX Revelation Manual 10-7 10.3 Threshold Chapter 10 Incorporating Decision Making Protocols into the Assay 10.3 Threshold 10.3.1 The Threshold Dialog Box The Threshold dialog box (Figure 10.2) is used to indicate ranges for samples which are going to be qualitatively determined to be positive or negative, according to the assay parameters. If there is a large neutral area between positive and negative, you may define segments or break points within this neutral area. Figure 10-2 The Threshold Dialog Box - Threshold Equations Tab 10-8 MRX Revelation Manual Chapter 10 Incorporating Decision Making Protocols into the Assay 10.3 Threshold 10.3.2 Threshold Equations Tab The Threshold dialog box -Threshold Equations tab (Figure 10-2) is used to generate various equations to define threshold conditions which will determine if a sample is positive or negative. Equations based on numerical O.D. or on controls may be written to define the threshold limits. A negative limit is set using the - equation, and a positive limit is set using a + equation. A positive and negative limit will always be required, but three extra positive levels (++, +++ and ++++) are also available. Threshold limits can be entered directly as absolute numbers. In other words, a result will be recorded as positive or negative if it falls above or below a certain number. In other cases it may be necessary to introduce conditions into the equation. For example, Test samples could be qualified as positive or negative by comparing them to a Control sample, or the average of a number of samples. The value resulting from the - equation is called the - value. The value resulting from the + equation is called the + value. If the - value is lower than or equal to the + value, then: O.D.s below the - value are negative O.D.s above the + value are positive. If the - value is higher than the + value, then: O.D.s below the + value are positive O.D.s above the - value are negative. 10.3.2.1 ++++/+++/++/+/– Equations Type the required equations into the Equation text boxes. The ++++, +++ and ++ equations are optional, but the + and - equations are necessary. To enter equations, click on the Enabled check box to activate the equation boxes, labels and functions. The general approach to editing the threshold equations is identical to the editing of the Q.C. raw data equations (Section 10.2.2) although there are fewer functions. - Eqn = everything less than this entry will be labeled as a negative sample. +Eqn = everything greater than or equal to this entry yet less than a higher level ++ entry will be labeled or denoted as +positive. MRX Revelation Manual 10-9 10.3 Threshold Chapter 10 Incorporating Decision Making Protocols into the Assay ++Eqn = everything greater than or equal to this entry yet less than the +++ values will be labeled or denoted as ++ positive. Typical equations include 1 If values above the result of Cut-off Control 1 plus 0.4 are positive. For the + positive equation, enter: CO1+0.4 2 Values above the result of Cut-off Control 1 plus 0.6 are double positive. For the ++ positive equation, enter: CO1+0.6 3 If values below the result of Cut-off Control 1 minus 0.4 are negative. For the - negative equation enter: CO1–0.4 4 A result is positive if it is equal to the Positive Control minus the Negative Control, then enter: PC-NC. 5 O.D.s above 1.00 must be recorded as positive: enter the number 1.00. The Threshold Histogram check box to is used to indicate that a histogram should be included in the results, showing all the different threshold ranges, and how many wells are in each. The Apply button is used to apply the current settings to the other tabs. This option is only available for certain configurations. 10.3.3 The Pos/Neg Q.C. Tab The Threshold dialog box - Pos/Neq Q.C. tab (Figure 10-3) is used to assign simple quality control to the threshold results. 10-10 MRX Revelation Manual Chapter 10 Incorporating Decision Making Protocols into the Assay 10.3 Threshold Figure 10-3 The Threshold Dialog Box - Pos/Neg Q.C. Tab This option allows you to assign a result (++++, +++, ++, + or -) to each well type. All samples within the well type must fall into the required result range or the well type will fail Q.C. and a warning will be displayed in the results. Alternatively, you can view the O.D. with the results so that you can manually check its accuracy. To do this, type O.D. in the box. Note… If you changed any of the threshold labels, you must use the new label in the Pos/Neg Q.C. boxes, not the default labels. MRX Revelation Manual 10-11 10.3 Threshold Chapter 10 Incorporating Decision Making Protocols into the Assay 10.3.4 Threshold Q.C. The Threshold dialog box - Threshold Q.C. tab (Figure 10-4) is used to generate Quality Control (Q.C.) equations which place criteria on the threshold data. If the criteria are not met, the data will be processed as normal but the Results report will contain a message showing that the data failed Q.C. In addition, note that when the Q.C. Raw Data command is selected from the Settings menu, the Threshold Q.C. dialog box (which is identical to this tab) is presented. Figure 10-4 The Threshold Dialog Box - Threshold Q.C. Tab Editing of this dialog box is identical to that for the Quality Control dialog box (Section 10.2). 10-12 MRX Revelation Manual Chapter 10 Incorporating Decision Making Protocols into the Assay 10.3 Threshold 10.3.5 Output Format The Output Format tab (Figure 10-5) is used to determine what the format of the printout should be. Figure 10-5 The Threshold Dialog Box - Output Format Tab Output ! Matrix - outputs the data as a matrix which displays the values obtained from each well location, in terms of its position on the plate in an 8 x 12 array. ! Table - outputs the data in columns which shows the values obtained from each sample replicate in order by well type. Note… If you have included a number of different processing options and used a number of tables in the output, the program may overwrite sections of data in the output. If this happens, try using matrices instead of tables, or try removing one of the processing options. MRX Revelation Manual 10-13 10.3 Threshold Chapter 10 Incorporating Decision Making Protocols into the Assay Options ! Average Replicates - replicates will be averaged before any other calculations take place. ! Decimal Places – indicates the required number of decimal places for data calculations. The default number is three (this is suitable for most applications), the range is 0-6. Mean ! Arithmetic - Reports the arithmetic mean of replicate determinations. ! Geometric - Reports the geometric mean (the antilog of the mean of the logarithms) of replicate determinations. Reporting the geometric mean is useful when the imprecision is directly proportional to the level. Scientific Notation If scientific notation is desired, check the enabled box. ! Free format - Results are displayed in the most appropriate format. ! Multiples of 3 - Limits the number of significant figures to multiples of three. ! Fixed at... - Allows you to enter an exponent manually. Table Options The Table Options field is used to indicate the information that should be included with the results value for each sample when the Table format is selected. The items are summarized in Table 10-1. Table 10-1 Table Options OPTION Sample ID Well Location Replicate Value Mean Value S.D. C.V. S.E.M. Dilution DISPLAYS Sample ID (if one was entered) Well location Raw data value Mean value of the whole well type Standard deviation value of the whole well type. Coefficient of variation of the whole well type. Standard error mean of the whole well type. Dilution of every sample (if one was entered). Note… Some table options are not available for certain data processing options, while some are obligatory. Options which are unavailable will be greyed out for a given situation. Options which are obligatory will be greyed out and the corresponding check box will be checked. 10-14 MRX Revelation Manual Chapter 10 Incorporating Decision Making Protocols into the Assay 10.3 Threshold ! Results Order - If Table Output is selected, you can place the data in order according to well type. To delete the current order and create a new one, select Clear List and click on the well types in the order you want them to appear. To move a well type to the top of the list, double-click on it. You must add every well type to the list before leaving the dialog box (even if you are not using every well type). ! Normal Ranges – used to set a range within which you expect all normal results to fall. The program will flag any results which fall outside this range with a * character (used with Curve fit only). ! Printout Mode - used to identify the cross over between positive and negative in a dilution block. You can flag the change from positive to negative or from negative to positive, the last positive result, or the last negative result. The Threshold output is active only when a dilution block has been defined using the Replicates Define option. MRX Revelation Manual 10-15 10.4 Curve Fit Chapter 10 Incorporating Decision Making Protocols into the Assay 10.4 Curve Fit 10.4.1 Introduction to Curve Fitting When Curve Fit processing is used, the program measures the O.D. for a series of standard samples of known concentrations and uses the readings to generate a graph which is used to calculate the concentrations of Test (experimental unknowns) samples. The numbers entered for the known standards are used to draw the x-axis of the graph and the ODs from the known standards are used to draw the y-axis. The Curve Fit protocol is described in detail in Section 6.8. In this section, we describe the selections which can be incorporated into the data is to be fit (i.e. the equations to be used). 10.4.2 Curve Fit Dialog Box - Calculated Q.C. Tab The Curve Fit dialog box - Calculated Q.C. tab (Figure 10-6) is used to develop quality control equations that are used to place criteria on samples calculated from a curve fit. Quality control criteria are placed on wells after the curve fit has been drawn and concentrations or titers have been calculated. If the criteria are not met, the data will be processed as normal but the results report will contain a message showing that the data failed Q.C. 10-16 MRX Revelation Manual Chapter 10 Incorporating Decision Making Protocols into the Assay 10.4 Curve Fit Figure 10-6 The Curve Fit Dialog Box- Calculated Q.C. Tab Quality control equations are established in the same manner as equations for Q.C. Raw Data. A detailed description is presented in Section 10.2.2. 10.4.3 The Curve Fit Dialog Box - Data Conversion Tab The Curve Fit dialog box - Data Conversion tab (Figure 10-7) is used to assign data conversion equations to the curve fit data tab. Data conversion equations are used to convert the data into different units by multiplying or dividing by some number or calculated sample value. MRX Revelation Manual 10-17 10.4 Curve Fit Chapter 10 Incorporating Decision Making Protocols into the Assay Figure 10-7 The Curve Fit Dialog Box - Data Conversion Tab Curve Fit Data Conversion equations are prepared in the same manner as Ratio Equations (see Section 10.5.1). 10.4.4 The Curve Fit Dialog Box - Results Flagging Tab The Curve Fit dialog box - Results Flagging tab (Figure 10-8) is used to specify a phrase that either replaces a numerical result or is displayed next to the result, and is accessed by selecting the Results Flagging tab. The phrase will be initiated whenever the numerical result meets the criteria that are specified. 10-18 MRX Revelation Manual Chapter 10 Incorporating Decision Making Protocols into the Assay 10.4 Curve Fit Figure 10-8 The Curve Fit Dialog Box-Results Flagging Tab ! Condition is used to indicate the Results Flagging expression. ! Result is used to indicate if a phrase to be reported (rather than a numerical result). ! Flag is used to enter the phrase if the numerical result is to be accompanied by a phrase in the Flag box. An example of the Results flagging feature is to report the phrase “<20 mg/dL” instead of the actual numerical result whenever results are less than 20 mg/dL. As an alternative, the phrase “Abnormal High” can be displayed to flag any results that are higher than a specified level. The phrase will be initiated whenever the numerical result meets the criteria that are specified. Results Flagging Equations are used to specify criteria for generating the phrase or flag. Although several unique elements are used for constructing a Results Flagging expression, the expression is created in the same way as Raw Data O.K. The unique elements for Results Flagging are described in Table 10-2. An unlimited number of Results Flagging expressions can be defined for an assay. MRX Revelation Manual 10-19 10.4 Curve Fit Chapter 10 Incorporating Decision Making Protocols into the Assay Table 10-2 Results Flagging Elements Element Type( ) Sample (for OD values) Result (Sample) and, or operators 10-20 Description Use the “Type” keyword to designate the well type (Standards, Controls, Tests, etc.) that a Results Flagging equation is applied to. For example, the expression “Type(C )==0” means that this equation applies only to the control wells. Use the “Sample” keyword to designate the absorbance of a particular sample, replicate, or well type in the same manner as used in Q.C. Raw Data equations. Use the “Result(Sample)” construct to designate the calculated concentration of a sample instead of the absorbance values that were obtained. For example, the expression “Result(Sample)<123” can be created to set a lower limit of 123 mg/dL for the calculated value for any test sample. Then, whenever the value of a sample is less than 123 mg/dL, the designated phrase will be displayed. Use the “and” or “or” operator in a Results Flagging expression to test multiple conditions. MRX Revelation Manual Chapter 10 Incorporating Decision Making Protocols into the Assay 10.5 Ratio 10.5 Ratio 10.5.1 Ratio Equations The Ratio processing dialog box - Ratio Equations tab (Figure 10-9) is used to convert raw data into data with a different scale. Ratio data is output as a matrix or table of converted results. To enter a ratio equation, click on the Enable box. Ratio and data conversion equations may consist of up to 50 characters and can only include items shown in the table below. Equations may not contain any spaces. Figure 10-9 The Ratio Processing Dialog Box ! Ratio Equation – used to convert raw assay data into a different scale. Every value on the plate is fed into the equation. The resulting value replaces the original value in the ratio matrix or table. ! Data Equation – used to convert raw assay data into different units. Every value on the plate is fed into the equation. The resulting value replaces the original value in the data conversion section of the ratio results. MRX Revelation Manual 10-21 10.5 Ratio Chapter 10 Incorporating Decision Making Protocols into the Assay ! Units - used to indicate the units you wish to use for each set of calculated data. Units may consist of up to eight characters. ! Functions - equation components can be selected by double-clicking on the required function. These are standard functions described in Section 10.2.2. Examples of equations: 1 To convert all values into a percentage of the maximum value on the plate, enter 100sample/max in the Ratio field. 2 If there are three replicates of each test to be ratioed against a positive control from which a negative or non reactive background has been subtracted then use this equation: ((sample1+sample2+sample3)/3)-NC/(PC-NC). 3 Convert all values to a ratio of the average Positive Controls, enter sample/PC in the Ratio field. 4 To convert all values into units which are 15 times smaller than the current units, enter sample/15, in the Data Conversion field. Item Example Numbers Type 0-9 Standard Arithmetic Operators Type ?*-+ Brackets (up to 6 levels of parentheses) ( ) From 1 to 5 variable values can be in the ratio equation, to be entered at run time. Type Variable1. All variables must be numbered. Every individual well on the plate Use the word “Sample” Replicate X of each sample on the plate Use the words “Sample1”, “Sample2” Sample by well type and number of replicates, T1, S2, CO2 indicates all wells with the same label and number 10-22 Notation for an individual replicate T1.1, T1.2, NC2.1, NC2.3 Average well type value Type the well label: T, NC, PC All wells with this label will be averaged in the calculations. Maximum of a group of values max. Minimum of a group of values min. Coefficient of Variation for a well type CV(well type) Standard deviation for a well type SD(well type) MRX Revelation Manual Chapter 10 Incorporating Decision Making Protocols into the Assay 10.5 Ratio 10.5.2 Ratio Dialog Box - Results Flagging Tab The Ratio dialog box - Results Flagging Tab (Figure 10-10) is used to specify a phrase that either replaces a numerical result or is displayed next to the result, select the Results Flagging tab. The phrase will be initiated whenever the numerical result meets the criteria that are specified. A detailed discussion of Results Flagging is presented in Section 10.4.4. Figure 10-10 The Ratio Dialog Box-Results Flagging Tab MRX Revelation Manual 10-23 10.6 Spreadsheet Chapter 10 Incorporating Decision Making Protocols into the Assay 10.6 Spreadsheet 10.6.1 Spreadsheet Dialog Box - Results Flagging Tab The Spreadsheet dialog box - Results Flagging tab (Figure 10-11) is used to specify a phrase that either replaces a numerical result or is displayed next to the result, select the Results Flagging tab. The phrase will be initiated whenever the numerical result meets the criteria that are specified. A detailed discussion of the Results Flagging tab is presented in Section 10.4.4. Figure 10-11 The Spreadsheet Dialog Box - Results Flagging Tab 10-24 MRX Revelation Manual Chapter 11 Formatting Reports and Exporting Data 11.1 Overview Chapter 11 Formatting Reports and Exporting Data 11.1 Overview The RevelationTM program generates a hard copy report which presents the analytical results in a user definable format. The analytical results can also be exported in a format which can be imported into other programs (e.g. a spreadsheet such as Microsoft Excel or a text editor). This chapter describes how to define the format of the printed report and the exported data. In addition, it describes a number of other reports that are generated by the reader. MRX Revelation Manual 11-1 11.2 Laboratory Information Chapter 11 Formatting Reports and Exporting Data 11.2 Laboratory Information Laboratory information (e.g. the name, address, phone and fax number of the laboratory) can be printed at the top of each report. This information is entered in the Laboratory Information tab of the Options dialog box (Figure 11-1) which is accessed via the Utility menu. Figure 11-1 Options Dialog Box - Laboratory Information Tab 11-2 MRX Revelation Manual Chapter 11 Formatting Reports and Exporting Data 11.3 Report Options 11.3 Report Options The Report Options dialog box is used to indicate the desired format for a given assay and indicates the data selections to be included in the report. The report options feature is designed to allow you to choose the contents and order of the report, to define data matrix settings and to specify special export formats. When you select a tab, the dialog box changes to display the options and default settings for that tab. Any new settings you select will take effect when you close the dialog box. 11.3.1 The Report Options Dialog Box - Report Layout Tab The Report Options dialog box - Report Layout tab (Figure 11-2) is used to define the content of the report and the order of items on the report. The selection list on the left column lists all the possible items in the report. The Check list shows the current order of the items. By default, all items are included in the checklist (even if they are not programmed into the assay). Figure 11-2 The Report Options Dialog Box - Report Layout Tab MRX Revelation Manual 11-3 11.3 Report Options Chapter 11 Formatting Reports and Exporting Data If you do not want to include an item in the report, highlight it and press the Remove key. The order of items in the report can be changed by highlighting an item and using the Move Up (Move down) button. Items that should not be presented in the report can be taken off the Check list column by highlighting them and pressing Remove. 11.3.2 The Report Options Dialog Box - Raw Data Tab The Report Options dialog box - Raw Data tab (Figure 11-3) is used to indicate how the raw data is presented. Figure 11-3 The Report Options Dialog Box – Raw Data Tab Output Matrix displays the values obtained from each well location, in terms of its position on the plate in an 8x12 array that shows the grid and is labelled. Table presents the values obtained from each sample replicate in terms of its well type in a column format. 11-4 MRX Revelation Manual Chapter 11 Formatting Reports and Exporting Data 11.3 Report Options Note… If you have included a number of different processing options and used a number of tables in the output, the program may overwrite sections of data in the output. If this happens, try using matrices instead of tables, or try removing one of the processing options. Matrix Options Calculated Data box should be checked if the values calculated from a curve fit or ratio equation should be displayed. Sample ID displays the identification code for each sample beside the calculated data if a sample ID file was created in the Utility menu. Averaging Options Average Replicates - used to indicate that the average of the raw data replicates should be reported. Arithmetic Mean - Reports the arithmetic mean or average of replicate determinations. Geometric Mean - Reports the geometric mean (the antilog of the mean of the logarithms) of replicate determinations. Reporting the geometric mean is useful when the imprecision is directly proportional to the level. Decimal Places Free format - Results are displayed in the most appropriate format. Fixed at...- Allows the analyst to enter the desired number of decimal places. Table Options The Table Options field is used to indicate the information that should be included with the results value for each sample when the table format is selected. The items are summarized in Table 11-1. Table 11-1 Table Options Option Sample ID Well Location. Replicate Value Mean Value S.D. C.V. S.E.M. MRX Revelation Manual Displays Sample ID (a created sample ID file) Well location on the template Raw data or OD value of each sample Mean value of the whole well type Standard deviation value of the whole well type Coefficient of variation of the whole well type Standard error mean of the whole well type 11-5 11.3 Report Options Chapter 11 Formatting Reports and Exporting Data Note… Some table options are not available for certain data processing options, while some are obligatory. Options which are not available for a given situation will be greyed out. Options which are obligatory for a given situation will be in bold type and the corresponding check box will be checked. If Table Output is selected, you can place the data in order according to well type. To delete the current order and create a new one, select Clear List and click on the well types in the order you want them to appear. To move a well type to the top of the list, double-click on it. You must add every well type to the list before leaving the dialog box (even if you are not using every well type). 11.3.3 The Report Options Dialog Box - Export to File Data Tab The Report Options dialog box - Raw Data tab (Figure 11-4) is used to indicate that the results of the test should be exported as an ASCII text file and assign the desired format. Figure 11-4 The Report Options Dialog Box - Export to File Tab 11-6 MRX Revelation Manual Chapter 11 Formatting Reports and Exporting Data 11.3 Report Options In the File Format dialog box, select the format of the file to be exported. Note… If you plan to ever export data as an ASCII file, a plate ID must be entered in the Plate ID field in the Run Plate dialog box before the plate read otherwise the default export file name “text.txt” will be used. The plate ID that is entered becomes the file name for the text file. If you have selected ASCII or Sanguin format, the option button leads to a dialog box to set various parameters. 11.3.3.1 ASCII Format If the ASCII format is selected, the ASCII Options dialog box (Figure 11-5) will be presented when you press Options. Figure 11-5 ASCII Options MRX Revelation Manual 11-7 11.3 Report Options Chapter 11 Formatting Reports and Exporting Data Separator The Separator selection is used to describe how data in the export file should be separated. The option depends on the requirement of the program that you intend to export to. In many instances (e.g. Microsoft Excel), when the data file is opened a wizard will be presented to assist you in formatting the data in the program. Tab - put each well’s information into its own cell on a spreadsheet. Comma - information is separated by a comma. All data will be put into the same cell on a spreadsheet as a long string of numbers, separated by commas. Space - information is separated by a space. All data will be put into the same cell on a spreadsheet. Semicolon - information is separated by a semicolon. All will be put into the same cell on a spreadsheet. Format Format is used to specify the way in which the results will be displayed. Table - puts data into columns. Matrix - puts data into rows with header information for each well and row. Listing - exports data in the 8 x 12 array, with no column or row header information. Sort Table On Sort Table On (active only if Table format is selected) is used to indicate how you want the variables on which you can sort the data for presentation order. Place an x in the In Descending Order check box to sort in descending order. Select Data to Export is used to indicate the data which should be exported. Note… Raw Data MUST be checked if you want to export raw O.D. data from individual reads in a kinetic assay. 11.3.3.2 Sanguin If the Sanguin format is selected, a dialog box to enter the Over, Under, Unused and Invalid values will be presented. 11-8 MRX Revelation Manual Chapter 11 Formatting Reports and Exporting Data 11.3 Report Options 11.3.4 Exporting Data Using RevelationTM If you want to export data, activate the Export feature and select the appropriate parameters as described in Section 11.3.3. To automatically export data as a part of an assay: 1 Select the Run Plate command from the File menu to present the Run Plate dialog box (Figure 11-6). Figure 11-6 The Run Plate Dialog Box 2 Enable the Auto save plate data as check box.. 3 Enter the Plate ID information in the Plate ID field. The data will be saved using that file name. When the plate is run, the data will be saved in the appropriate directories as a *.dat file, which is read by Revelation and a *.txt file which can be read by external programs. The data will be the same but will be in different formats. To see the *.txt file, it is necessary to leaveRevelation, either by minimizing or closing the program. After you have left Revelation, open the program with which you want to edit the text, and then open the file. MRX Revelation Manual 11-9 11.3 Report Options Chapter 11 Formatting Reports and Exporting Data To change a binary data file to a text format: 1 Open the data file. 2 Select View Assay from the View menu. The assay settings will be presented. 3 Select Report Options on the Settings menu. 4 Enable the Export to File option, select the desired format and data listings and save the assay. 5 Select the data file that you have opened (via the Windows menu) and select Refresh on the Data menu. The data will be reprocessed according to the change in the assay settings and saved as a *.txt extension and can be opened in the desired application. 11.3.4 The Report Options Dialog Box – Header-Footer Tab The Report Options dialog box - Header-Footer tab (Figure 11-7) is used to indicate the information that should be included in the report header and footer. Figure 11-7 Report Options Dialog Box - Header-Footer Tab To indicate the information that should be presented, check the appropriate box(es). 11-10 MRX Revelation Manual Chapter 11 Formatting Reports and Exporting Data 11.4 The Event Log File 11.4 The Event Log File An Event Log lists the various activities of the reader, including error messages, etc. A sample Event Log is shown in Figure 11-8. Figure 11-8 An Event Log An event log can be viewed by: 1 Selecting Open on the File menu. 2 Select Event Log in the Files of type field. The display will list the sample logs as shown in Figure 11-9. MRX Revelation Manual 11-11 11.4 The Event Log File Chapter 11 Formatting Reports and Exporting Data Figure 11-9 Event Log Listing 3 Select the desired log. Each log name is derived from the date and the number of times the reader was powered up that day (e.g. 03200103 refers to the third time the reader was powered up on March 20 2001). 11-12 MRX Revelation Manual Appendix A Using an External Computer A.1 Overview Appendix A Using an External Computer A.1 Overview In most instances, the RevelationTM software is used with the personal computer that is installed inside the MRX reader. The system is also available for use with an external computer. This appendix describes how an external unit is interfaced to the reader and the differences in operation between the internal and external computer configuration. MRX Revelation Manual A-1 A.2 The Personal Computer Configuration Appendix A Using an External Computer A.2 The Personal Computer Configuration As a minimum, the personal computer should have the configuration indicated in Table A-1. Table A-1 Minimum Computer Configuration Component Computer Operating System Hard disk space Monitor Mouse Memory A-2 Configuration Pentium processor, 233 Hz. Microsoft Windows 98/NT. At least 10MB of free space. An SVGA Color graphics card and compatible color monitor. Monochrome, CGA, EGA, or VGA calibrated monitors are not supported. A Windows-compatible mouse or other pointing device. At least 64 MB of RAM. MRX Revelation Manual Appendix A Using an External Computer A.3 Interfacing the Computer to the MRX Reader A.3 Interfacing the Computer to the MRX Reader A.3.1 Electrical and Communications Interface Note… The computer and MRX reader should not be powered up while the communications cable is being installed. To interface the computer and reader 1 The personal computer should be connected to the Serial Port (item 6, Figure A-1) on the rear panel of the reader using the RS-232 cable provided. The reader is normally connected to a COM port on the personal computer. If COM port 1 is used by another device, use a different com port (it will be necessary to change the system configuration as described in Section A.4). 2 The mouse, printer, display and keyboard should be connected to the personal computer, since all control of the reader is via the external computer. 1 Mains Inlet 8 Monitor Port 2 Voltage Selector 9 Optics Door 3 Monitor Mains Socket 10 Optics Cooling Vents 4 Keyboard Socket 11 Serial Number Plate 5 PS/2 Mouse Socket 12 PSU Cooling Vents 6 Serial Port 13 Main Enclosure 7 Printer Port Figure A-1 The Rear Panel MRX Revelation Manual A-3 A.3 Interfacing the Computer to the MRX Reader Appendix A Using an External Computer 3 Plug the mains power cable for the reader into the mains outlet (Item 1, Figure A-1) and into the line. 4 Plug the mains power cable for the personal computer into the line. 5 Turn on the power switch on the front panel of the MRX. 6 Turn on the computer. The computer should boot directly to Windows. A-4 MRX Revelation Manual Appendix A Using an External Computer A.4 Installing the Software A.4 Installing the Software Note… Before installing the software, make a copy of the diskettes for archival purposes and store them in a secure location. To install the RevelationTM software: 1 Access the Windows desktop. If any programs are open, close them at this time. 2 Insert Installation Disk 1 into the floppy disk drive. 3 Press Start to access the task bar and then select Run from the task bar to present the Run dialog box is presented. 4 Type x:\setup in the Run dialog box and press OK (x is the drive designator for the floppy drive and is almost always a). 5 Follow the directions provided by the installation (it is recommended that you use the default directory). 6 After the first diskette is copied, you will be prompted to insert the second diskette. Insert the diskette labelled Disk 2 into the diskette drive and select OK. 7 When the installation is complete, the message Setup is complete is displayed. Remove the second installation diskette. If desired, you can create a shortcut on your windows desktop: 1 Open Windows Explorer a) Locate the Revelation shortcut in the directory in which the program was installed (if you have used the default directory during installation, the shortcut will be in c:\Windows\Start Menu\Programs\Revelation). b) Drag the Revelation shortcut to the desktop. Note… Be sure to drag the Revelation shortcut, not the Revelation Help shortcut. 2 Close Microsoft Windows Explorer. MRX Revelation Manual A-5 A.5 Setting the System Configuration Appendix A Using an External Computer A.5 Setting the System Configuration A.5.1 Selecting the External Configuration When RevelationTM is installed, the software is set-up for an internal computer. This section describes how to change the configuration for an external computer and change communication parameters (if necessary). To set the system configuration: 1 Open Revelation. A welcome window and a dialog box that requests the serial number for the system are presented. Enter the serial number (which is displayed on the display of the reader module). 2 The message box shown below (Figure A-2) will be presented since the computer is not yet configured to communicate with the reader. Figure A-2 Hardware Link Error Message Box 3 Click OK to accept the error message. The monitor will present the self-diagnostic sequence report, which will indicate that the system was not tested. 4 Close this window (it is not necessary to save the test data). 5 Select Configure Reader on the Utility drop down box to present the Configure Reader dialog box (Figure A-3). A-6 MRX Revelation Manual Appendix A Using an External Computer A.5 Setting the System Configuration Figure A-3 The Configure Reader Dialog Box 6 Select External MRX and click Setup to present the Setup External MRX dialog box (Figure A-4). . Figure A-4 The Setup External MRX Dialog Box - Reader Tab MRX Revelation Manual A-7 A.5 Setting the System Configuration Appendix A Using an External Computer A.5.2 Setting System Parameters The Setup External MRX dialog box is used to set a variety of system parameters. It consists of two tabs, the Reader tab (Section A5.2.1) and the RS-232 tab (Section A5.2.2). A.5.2.1 The Reader Tab The Reader tab is used to set various instrument parameters. Filters Indicate the number of filters that you have installed in the Reader. The corresponding number of filter fields will be activated and you can enter the wavelength for each filter. The wavelengths entered should correspond to the wavelengths indicated on the black casing around each filter that is physically present in the filter wheel. Each filter should be located in the position of the filter wheel indicated in the table. Note… Filters must be installed in increasing order. Options Indicate the options that are installed on the reader by checking the boxes. Data Transmission Mode Fast Transmission Mode - If you want to transmit data at an enhanced speed, check the Fast Transmission Mode check box. OVER Limit The OVER limit is used to create a range for expected readings. The value entered is also used as an UNDER limit. For example, if you enter an OVER limit of 3.500, Revelation will classify any readings above 3.500 as OVER and any readings below 3.500 as UNDER. OVER/UNDER Conversion If O.D. values fall outside the OVER or UNDER limits, they cannot be passed to Q.C. Equations (see Section 10.2) unless they are converted into numerical values. If you wish to convert OVER or UNDER readings into values that can be input into quality control equations, check this box. A-8 MRX Revelation Manual Appendix A Using an External Computer A.5 Setting the System Configuration OVER Value Enter the value that all OVER values will be converted to (this field is active only if you checked the OVER/UNDER Conversion box). The range is from 0.000 to 9.999. UNDER Value Enter the value that all UNDER values will be converted to (this field is active only if you checked the OVER/UNDER Conversion box). The range is from –9.999 to 0.000. The Verify button is used to check if the computer and the reader can communicate. If the computer presents an error message or cannot communicate with the reader, it is possible that: ! The communication cable is not securely fastened to either the computer or the reader. Check the cable connection. ! COM Port 1 (which is the default communications port) is assigned to another device or the communication parameters are incorrectly set for your system. A.5.2.2 The RS232 Tab If the computer cannot communicate with the reader and the cable appears to be connected, click on the RS232 tab (Figure A-5). Figure A-5 The Setup External MRX Dialog Box - RS232 Tab MRX Revelation Manual A-9 A.5 Setting the System Configuration Appendix A Using an External Computer Then establish Communications between a MRX Reader and an External Computer: 1 Use the RS232 cable provided with the system. This cable should be connected between the 9 pin serial port (item 6, Figure A-1) and the serial port on the computer (the computer may have more than one serial port and the mouse may be connected to a serial port). 2 Power up the reader and allow it to perform the self-test. The MRX will indicate Endpoint on the left and Setup on the right on the display. Press the arrow under the word Endpoint. The display should indicate: Endpoint Ready Start Recall Utility Program CE 3 Power up the computer, close applications that may have been loaded during bootup (e.g. anti-virus programs, network interfaces, etc.) and launch RevelationTM. 4 Close any self-test that may be indicated on the monitor. 5 Select Reader Configuration on the Utility menu. No password is needed. 6 A dialog box listing various configurations is presented (Figure A-6). Figure A-6 The Reader Type Dialog Box 7 Select the External MRX option and press Setup. The Setup External MRX dialog box will be presented. 8 Select the RS232 tab to present Communication Options (Figure A-7). A-10 MRX Revelation Manual Appendix A Using an External Computer A.5 Setting the System Configuration Figure A-7 Setup External MRX - RS232 Tab Set the appropriate transmission parameters. The Default button selects the configuration that is most frequently employed for serial communication (it should not be necessary to change the Baud Rate, Parity, Data Bit and Stop Bits selections). • COM1 • Baud Rate: 9600 • 1 Stop Bit • Parity Even • 8 Data Bits • 9 Press OK. The computer should link to the reader. If the message Command Time Out or Reader not Detected is presented: 10 Change the setting to COM 2 and press Verify. If this does not solve the problem, try COM 3 and COM 4. Note… Make certain that the COM port assignment does not conflict with any other serial port assignment on the computer. MRX Revelation Manual A-11 A.5 Setting the System Configuration Appendix A Using an External Computer 11 Determine that the port is operating properly. This can be done by checking the properties for each port via the Device Manager. To access the Device Manager: a) Click on the My Computer icon on the main window (minimize RevelationTM). b) Select the Control Panel icon. c) Select Device manager on the Control Panel. d) Select Communication Port (COM1) on the Ports entry. e) Click on the Properties tab. Check the settings and verify that it is working correctly. f) Repeat this for all ports to verify that they are working properly. g) Return to Revelation and try to link the reader to the computer. h) Change the cable and the adapter (independently, if possible). i) Check the RS232 port using another RS232 device. j) Change the computer and reload the software. k) Call your local DYNEX Technologies service representative for assistance. Please have the serial number of the system, version number of the software, the version number of the firmware in the reader and a description of the computer that you are using available. A-12 MRX Revelation Manual Appendix A Using an External Computer A.6 Differences Between Internal and External Operation A.6 Differences Between Internal and External Operation The general mode of operation of a system with an internal computer and that with an external computer is very similar. The user should note the following differences. 1 Agglutination does not function when an external computer is used. 2 With an internal computer, the communication link test and the self-test are performed during power up. In contrast, the communication link and self-test are tested when a command is given by the external computer (rather than during powerup). MRX Revelation Manual A-13 Appendix B Mathematical Relationships B.1 Overview Appendix B Mathematical Relationships B.1 Overview RevelationTM allows the analyst to use a broad range of mathematical relationships to determine the concentration of the compound of interest. In this appendix, we describe the basis of each of the methods to assist the analyst in more fully understanding the nature of the data reduction processes. MRX Revelation Manual B-1 B.2 Linear Regression Appendix B Mathematical Relationships B.2 Linear Regression A Linear Regression is used to put a "best fit" straight line through a set of data points. Equation B-1 describes a linear relationship between the measured variable and the concentration of the compound of interest. Y = mX + b B-1 where: m = the slope b = the y-intercept defining the line Y = the value for measured variable (O.D.) X = the value for the concentration The linear regression formulae for determining the best straight line through a series of data points are provided in equations B-2 and B-3: m = NΣ Σxiyi -Σ ΣxiΣyi NΣ Σxi2-_(Σ Σxi)2 B-2 b = Ymean – m (Xmean) B-3 The linear regression coefficient, R, is defined by equation B-4: R = (NΣxiyi -Σ ΣxiΣyi)2 (NΣxi2 −(Σxi)2)(NΣyi2 −(Σyi)2) B-4 The goodness of the fit is determined by the value of the linear correlation coefficient (R). Since the linear correlation coefficient can be either positive or negative, the value of R2 is normally reported. When comparing two sets of data (fits), the fit with the larger value for R2 is a better fit for the data set; if R2 =1, all data points lie along the line of best fit and if R2=0, the data points are highly scattered and there is a poor correlation. Once the linear relationship best fit has been established for a set of known standards, the concentration of an unknown sample can be determined via equation B-1. An example of a linear relationship is presented in Figure B-1. B-2 MRX Revelation Manual B.2 Linear Regression Absorbance Appendix B Mathematical Relationships Concentration Figure B-1 Linear Relationship MRX Revelation Manual B-3 B.3 Polygon Fitting Appendix B Mathematical Relationships B.3 Polygon Fitting Absorbance Polygon Fitting of the data involves joining successive data points using straight lines as shown in Figure B-2. Concentration Figure B-2 Polygon Fitting of Data B-4 MRX Revelation Manual Appendix B Mathematical Relationships B.4 Quadratic, Cubic and Quartic Regression B.4 Quadratic, Cubic and Quartic Regression Polynomial regressions are similar to a linear regression (equation B-1), but use quadratic, cubic and quartic equations to relate the observed O.D. to the concentration. A quadratic equation is presented in equation B-5, a cubic equation is presented in Equation B-6 and a quartic equation is presented in equation B-7. Quadratic Equation: Y = a +bX + cX 2 B-5 Cubic Equation: Y = a +bX + cX 2+ dX 3 B-6 Quartic Equation: Y = a +bX + cX 2+ dX 3+ eX4 B-7 The procedures used to fit these functions to experimental data are similar to that for linear regression and have a similar mathematical derivation. A polynomial regression tends to minimize the deviations of the data points from the polynomial equation. The squaring (cubing, etc.) of the deviations tends to minimize them since positive and negative deviations tend to cancel out. The regression coefficient is handled in a similar manner as with a linear relationship. When R2 = 1, all the data points have been fitted to the curve, when R2 = 0, the data points are scattered. Absorbance Examples of Quadratic and Quartic fits are shown in Figure B-3 and B-4 respectively. Concentration Figure B-3 Quadratic Fit MRX Revelation Manual B-5 Appendix B Mathematical Relationships Absorbance B.4 Quadratic, Cubic and Quartic Regression Concentration Figure B-4 Quartic Fit B-6 MRX Revelation Manual Appendix B Mathematical Relationships B.5 Cubic Spline Curve Fitting B.5 Cubic Spline Curve Fitting When Cubic Spline Curve fitting is used, a curve is passed through all the data points and equations B-8 to B-10 are employed to determine the concentration. B-8 where: B-9 B-10 Note… Cubic Spline curve fitting is not a best fit algorithm, as it assumes that each data point is correct. If the data is erratic, if it is known that the data has significant errors or if the concentration/absorbance has many inflection points, this method can lead to significant errors in the reported concentration. Absorbance At high concentrations, the Cubic Spline Curve Fitting method may break up (e.g. Figure B-5). In some cases, a semi-log or log-log axis (instead of a linear fit) will improve the quality of the data. Concentration Figure B-5 Cubic Spline Curve Fitting MRX Revelation Manual B-7 B.6 Akima Fit Appendix B Mathematical Relationships B.6 Akima Fit Absorbance The Akima fit constructs a smooth curve through the data points. The fitted curve appears smooth and approximates a manually drawn curve (Figure B-6). Concentration Figure B-6 Akima Fit The Akima curve fit involves applying a set of polynomials that are applied to the data points and the slope of the curve at each point is determined by these polynomials. The Akima fit is based on the assumption that each data point is determined by five points, the point of interest and two points on either side of it . For additional information, refer to A New Method of Interpolation and Smooth Curve Fitting Based on Local Procedures, J. Assoc. Comp. Machinery 17(4) 589-602 (Oct 1970). B-8 MRX Revelation Manual Appendix B Mathematical Relationships B.7 Extrapolation of Non-Linear Curves B.7 Extrapolation of Non-Linear Curves In many instances, a data point is observed outside the range of the curve that is used to determine the concentration. The analyst should note that some curve fit functions may not behave as expected if they are extrapolated beyond the range defined by the data points. Absorbance For example, the readings for a set of Standards increase in a non-linear fashion with increasing concentration for a given test (right side of curve in Figure B-7) and the user determines that a quadratic curve fit might give the best fit for such data. However, at concentrations lower than the concentration of the lowest Standard, the curve may turn sharply upwards as shown in the left side of the curve. Concentration Figure B-7 Non-Linear Curve Fit. MRX Revelation Manual B-9 B.8 Sigmoid Equation Appendix B Mathematical Relationships B.8 Sigmoid Equation Absorbance Many immunoassays are characterized by an S-shaped or sigmoid curve (Figure B-8). Concentration Figure B-8 Sigmoid Curve The sigmoid curve is described by equation B-11: B-11 where: a is the minimum response b is the shape factor (determines the gradient of the curve) c is the response midway between the maximum (d) and the minimum (a) response d is the maximum response The above definition assumes a positive value for b. If b is negative, the definition of parameter a and d are reversed. RevelationTM contains an efficient algorithm for estimating the four parameters and determining the best fit for the sigmoid curve. The curve requires at least four standards (data points), one for each of the four parameters. It is recommended that at least eight Standards are defined on a plate to ensure satisfactory statistical significance. Note… The sigmoid curve algorithm is iterative, requiring many complex calculations and Revelation may take some time to process the results. If the curve cannot be drawn or data cannot be processed, a Windows “Illegal Operation- shut down” error message will occur. If this happens, examine your data carefully to determine if the number of Standards should be altered or a different type of curve fit should be used. B-10 MRX Revelation Manual Appendix B Mathematical Relationships B.9 Michaelis-Menton Curve Fit B.9 Michaelis-Menton Curve Fit Absorbance The Michaelis-Menton curve fit equation is normally used to describe enzyme kinetics (but it can be used in other applications where a rectangular hyperbolic relationship is observed). A typical plot is shown in Figure B-8. Concentration Figure B-8 Michaelis-Menton Plot The relationship between the O.D. and the concentration x can be written as described in equation B-12 a[x] ([x] + b ) where: a and b are constants O.D. = B-12 It can be shown that a equals the limiting O.D as [x] goes to infinity and b is the concentration at ½ OD max. The equivalent formula applied to enzyme reaction rates is shown in B-13. Vo = V max[S] [S] + Km B-13 where: [S] is the enzyme concentration Vmax is the maximum reaction velocity Km is the concentration where the reaction velocity is ½ Vmax The constant Km is called the Michaelis constant. MRX Revelation Manual B-11 B.9 Michaelis-Menton Curve Fit Appendix B Mathematical Relationships In typical usage, the Michaelis-Menton equation is converted into a linear form, which is commonly known as the Lineweaver-Burke equation (equation B-14). 1 1 Km 1 • = + OD OD max OD max [x] B-14 To use the Lineweaver-Burke equation, 1/OD is plotted against 1/x. A straight line is obtained with a slope of Km/ODmax. This line has an intercept at 1/OD and an intercept on the 1/x axis of 1/Km. The reader performs this calculation automatically and determines the best straight line fit by using a linear regression ODmax (printed as Vmax) and Km are evaluated and printed out. B-12 MRX Revelation Manual Appendix B Mathematical Relationships B.10 Using Logarithmic Curve Fitting B.10 Using Logarithmic Curve Fitting In most instances, linear scales are used to plot the concentration (X axis) and the measured variable (Y axis). If desired, a semi-log fit or a log-log fit can be used. B.10.1 Semi-Log Fit When a semi-log fit is used, the X axis presents log concentration. To obtain the concentration of a sample, equation B-14 is used. Concentration = antilog (y-c)/m B-15 B.10.2 Log-Log Fit When a log-log fit is used, the X axis presents the log (concentration) and the Y axis presents log (measured variable). To obtain the concentration of a sample, equation B-15 is used. antilog Concentration = antilog (y-c)/m B-14 Note… These examples use linear regression but Log-Log and Semi-Log Axes fit may be used with other curve fitting routines as well. MRX Revelation Manual B-13 Index Index A C Accuracy Testing 2-10 Agglutination Calculations 9-4 Creating an assay 9-7 During the Assay 9-18 Initiating the assay 9-14 Rules Calculation 9-5 Testing 9-1 Agglutination Options Tab (Reader Control Dialog Box) 9-11 Agglutination Parameters Tab (Reader Control Dialog Box) 9-8 Akima Fit B-8 Alignment Testing 2-10, 4-9 Area Statistics Tab (Assay Options Dialog Box) 6-42 ASCII Text File Export 11-7 Assay Code 6-3 Assay File (*.asy) 3-6 Assay Options Dialog Box 6-42 Assay Title Dialog Box 6-2 Assay Wizard 6-1 Assigning Assay Buttons 4-17 Automatic Entry (Standards tab, Curve Fit Dialog Box) 6-22 Automatic Outlier Removal, QC Tab (Curve Fit Dialog Box) 6-32 Calculated Q.C. Tab (Curve Fit Dialog Box) 6-34 Calculation Mode (Reader Control Dialog Box) 6-9, 8-5 Calculation Options (Fit Type Tab, Curve Fit Dialog Box 6-27 Calibration Plate Dialog Box 2-11 Calibration Protocol 4-10 Change Label Dialog Box 6-12 Close (File Menu) 4-3 Colors Tab (Options Dialog Box) Commands 4-1 Configure Reader (Utility Menu) 4-8 Contents (of Manual 1-6) Conventions 3-2 Creating Quality Control Equations 10-4 Cubic Regression B-5 Cubic Spline Fitting B-7 Curve Fit Dialog Box 6-20, 10-17 Custom Tab (Blank Mode Dialog Box) 6-17 Cut-off (Reader Control Dialog Box Calculation Mode Tab) 8-5 B Blanking Option (Agglutination Options Tab, Reader Control Dialog Box) 9-12 Blank Mode 6-14 Blank Subtraction (Kinetics Mode) 8-7 Buttons Tab (Options Dialog Box) 4-17 MRX Revelation Manual D Data Conversion Tab (Curve Fit Dialog Box) 6-35, 10-18 Data Log (Agglutination Options Tab (Reader Control Dialog Box) 9-12 Decision Making Protocols 10-1 Default Plate ID (Preferences Tab, Options Dialog Box) 4-18 Diagnostics 2-3 Dilutions Tab (Curve Fit Dialog Box) 6-28 Directories (Utilities Dialog Box) 4-21 I-1 Index E I Editing Assays 6-1 Endpoint Analyses 1-3, 7-1 Generating 7-2 Report 7-3 Event Log Files (*.log) 3-6, 11-11 Exit (File Menu) 4-5 Exporting Data 11-4, 11-9 Export to File Tab (Report Options Dialog Box) 11-6 External Computer A-1 Configuration A-2 Extrapolation of Non-Linear Curves B-9 Import (File Menu) 4-4 Inhibitor (Fit Type tab, Curve Fit Dialog Box 6-27 Initial Testing 2-10 Initiating a Run 5-8 Agglutination Analysis 9-14 Endpoint Analysis 7-4 Kinetic Analysis 8-11 Installing Software (External Computer) A-5 Interfacing External Computer A-3 Introduction 1-1 to Operating Program 3-1 F K Features 1-3 File Menu 4-2 File Types 3-6 Fill Direction (Template Window) 6-11 Filter Test 2-10, 4-10 Fit QC Tab (Curve Fit Dialog Box) 6-32 Fits Tab (Curve Fit Dialog Box) 6-21, 10-17 Fit Type Tab (Curve Fit Dialog Box) 6-24 Fit Types 6-25, B-1 Font Dialog Box 4-16 Formatting Reports 11-1 Formula (Agglutination Parameters Tab) 9-9 Formula Calculation Mode (Agglutination Mode) 9-4 Kinetic Analyses 1-3, 8-1 During the Assay 8-15 Kinetics Graphs (Reader Control Dialog Box) 8-8 Kinetic Time Interval (Reader Control Dialog Box) 8-3 L Laboratory Information 11-2 Language (Utility Menu) 4-8 Linearity Testing 2-10, 4-9 Linear Regression B-2 Logarithmic Curves B-13 Lot Specific Checking 10-3 M G Generating an Assay Endpoint Analyses 7-2 General Information 6-1 Kinetic Analyses 8-2 Getting Started 2-1 Graph (Curve Fit Dialog Box) 6-28 H Header Footer Tab (Report Options Dialog Box) 11-10 Help Menu 4-23 I-2 Maintenance Frequency 2-8 Maintenance Tab (Setup Internal MRX Dialog Box) 2-7 Mathematical Relationships B-1 Main Window 3-5 Menu Bar 4-2 Michaelis-Menton Curve Fit B-11 Miscellaneous Options (Reader Control Dialog Box Calculation Mode Tab) 8-5 Modes of Operation 1-3 MRX Revelation Application Software 1-5 MRX Revelation Manual Index Multi-Wavelength Mode (Reader Control Dialog Box) 6-7 N New Assay (File Menu) 4-2 O Open (File Menu) 4-3 Optic Channel Matching 2-10, 4-10 Options Dialog Box 4-16 Orientation of Run 5-5 Orientation (Template Window) 6-13 Outlier Removal, QC Tab (Curve Fit Dialog Box) 6-32 Output Format Tab (Curve Fit Dialog Box) 10-13 Output Format Tab (Threshold Dialog Box) 10-13 OVER Limit (Setup Internal MRX Dialog Box- Reader Tab) 2-6 OVER/UNDER Conversion (Setup Internal MRX Dialog Box- Reader Tab) 2-7 OVER Value (Setup Internal MRX Dialog Box- Reader Tab) 2-6 P Password 4-22, 6-2 Percentage Response (Standards Tab, Curve Fit Dialog Box) 6-23 Plate Data files (*.dat) 3-6 Plate ID (Sample ID Entry Dialog Box) 4-14 Plate In (Utility Menu) 4-9 Plate Orientation 5-7 Plate Out (Utility Menu) 4-9 Plate-Plate Statistics (Utility Menu) 4-6 Plate Reproducibility (Plate-Plate Statistics Dialog Box) 4-6 Plates (Plate-Plate Statistics Dialog Box) 4-6 Polygon Fitting B-4 Powering Up the System 5-3 Pos/Neg Q.C. Tab (Threshold Dialog Box) 10-11 Powering Up System 2-2 MRX Revelation Manual Preferences Tab (Options Dialog Box) 4-18 Principle of Operation 1-4 Print (File Menu) 4-4 Print Preview (File Menu) 4-4 Print Self Test 2-8 Print Setup (File Menu) 4-4 Processing Order Tab (Assay Options Dialog Box) 6-43 Q Quadratic Regression B-5 Quality Control 10-2 Dialog Box 10-2 Equations 10-3, 10-5 Functions 10-3 Reports 10-3 Quality Control, QC Tab (Curve Fit Dialog Box) 6-32 Quartic Regression B-5 R Ratio 10-21 Ratio Equations Tab (ratio Dialog Box) 10-21 Raw Data Tab (Report Options Dialog Box) 11-4 Read Calibration Plate (Utility Menu) 4-9 Read Mode 6-6 Reader Control Dialog Box Agglutination Mode 9-7 General Information 6-4 Kinetics Mode 8-2 Reader Serial Number Dialog Box 2-2, 5-2 Reader Tab (Setup Internal MRX Dialog Box) 2-6 Reader Type Dialog Box 2-5 Readings Used (Agglutination Options Tab -Reader Control Dialog Box) 9-12 Repeatability Mode (Setup Internal MRX Dialog BoxReader Tab) 2-7 Report Layout Tab (Report Options Dialog Box 11-3 I-3 Index Report Options 6-4, 10-3 Reader Options Tab (Reader Control Dialog Box) 6-4 Replicates (Read Mode Tab-Reader Options Tab) 6-6 Results Font (Utility Menu) 4-16 Result Format (Reader Control Dialog Box Calculation Mode Tab) 8-5 Results Flagging Tab (Curve Fit Dialog Box) 6-36, 10-18 Results Flagging Tab (Ratio Dialog Box) 10-23 Retest before Every Read 2-8 Revelation Application Software 1-5 RS232 Tab Internal MRX 2-9 Rules (Agglutination Parameters Tab, Reader Control) 9-10 Rules Calculation (Agglutination Mode) 9-5 Running an Assay 5-1 Run Options 5-5 Run Plate (File Menu 4-4) Run Plate Defaults (Preferences Tab, Options Dialog Box) 4-18 Run Plate Dialog Box 5-5 S Sample ID Entry Dialog Box 4-13 Sample ID Files (*.sid) 3-6 Sample ID (Sample ID Entry Dialog Box) 4-14 Sample ID Setup Tab (Assay Options Dialog Box) 6-42 Sample Selection (Curve Fit Dialog Box) 6-29 Sanguin Export Format (11-8) Save Assay (File Menu 4-3) Save Assay As (File Menu 4-3) Selecting Assay Conditions 5-5 Selecting Default Directories 4-21 Select New Assay (Plate-Plate Statistics Dialog Box) 4-6 Self Test Diagnostics 2-3, 5-3 Self Test (Print 2-8) Self Test (Utility Menu) 4-11 Self Test File (*.tst) 3-6 Self Test Report 2-3 I-4 Setting System Configuration External Computer A-6, A-8 Internal MRX Reader 2-5 Settings Menu 4-5 Setup Internal MRX Dialog Box Reader Tab 2-6 Shake (Read Mode Tab-Reader Options Tab) 6-6 Sigmoid Equation B-10 Sleep Mode (Setup Internal MRX Dialog Box- Reader Tab) 2-7 Spectral Response Curve Dialog Box 4-12 Spectrum (Utility Menu) 4-12 Spectrum files (*.spc) 3-6 Spreadsheet 10-24 Standards Tab (Curve Fit Dialog Box) 6-21, 10-17 Start Mode (Reader Control Dialog Box) General Information 6-9 Agglutination Mode 9-7 Start/Stop Mode (Reader Control Dialog Box) Kinetic Mode 8-2 Starting a Assay 5-8 Agglutination Analysis 9-14 Endpoint Analysis 7-4 Kinetic Analysis 8-11 Status Bar 4-26 Suppress Results if QC Fails 10-3 T Template Window 6-11 Test Report 2-12 Threshold Dialog Box 10-8 Threshold Equations Tab (Threshold Dialog Box) 10-9 ++++/+++/++/+/- Equations 10-9 Threshold Q.C. Tab (Threshold Dialog Box) 10-12 Tissue Culture Growth Measurements 9-6 Tool Bar 4-24 Transmission Graphs Tab (Reader Control Dialog Box) 9-13 MRX Revelation Manual Index U Use Original Assay (Plate-Plate Statistics Dialog Box) 4-6 Use Readings (Reader Control Dialog Box, Calculation Mode Tab) 8-5 Utility Menu 4-5 V Verification Plate 2-11 View Menu 4-5 W Wavelength (Read Mode Tab-Reader Options Tab) 6-6 Well Type (Template Dialog Box) 6-12 Window Menu 4-22 MRX Revelation Manual I-5