1
U s e r M a n ua l
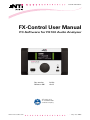
FX-Control User Manual
PC-Software for FX100 Audio Analyzer
Doc version
Refers to SW
2.8.2/e
v2.8.2
NTi Audio AG is
an ISO9000:2008
certified company
www.nti-audio.com
July 15 / MBe
2
FX-Control User Manual
Table of Contents
0
Part I
Introduction
6
1 Safety instructions
................................................................................................................................... 7
2 HW, SW installation
................................................................................................................................... 8
3 License agreement
................................................................................................................................... 9
Part II
Hardware
12
1 Display & rotary
...................................................................................................................................
encoder
16
2 Headphone...................................................................................................................................
jack
20
3 USB-A ports
................................................................................................................................... 20
4 USB-B port................................................................................................................................... 20
5 Auxiliary I/O
...................................................................................................................................
interface
21
6 FX-GEN board
................................................................................................................................... 25
7 FX-ANA board
................................................................................................................................... 27
8 FX-AES board
................................................................................................................................... 29
9 FX-SIL option
................................................................................................................................... 31
10 FX-SIH option
................................................................................................................................... 35
11 FX-SIP option
................................................................................................................................... 38
12 FX-DF option
................................................................................................................................... 41
13 FX-OS option
................................................................................................................................... 42
14 FX-IS option
................................................................................................................................... 44
Part III
Software
47
1 System operation
................................................................................................................................... 49
2 Project handling
................................................................................................................................... 54
3 Quick access
...................................................................................................................................
toolbar
56
4 'Start' ribbon
................................................................................................................................... 57
5 'View' ribbon
................................................................................................................................... 58
6 'Wiring' ribbon
................................................................................................................................... 59
7 'Worksheets'
...................................................................................................................................
ribbon
61
8 'Logging' ribbon
................................................................................................................................... 64
9 'Help' ribbon
................................................................................................................................... 65
10 Toolbox
................................................................................................................................... 69
11 Hardware &...................................................................................................................................
Wiring
70
12 Worksheets................................................................................................................................... 73
13 Properties ................................................................................................................................... 75
14 Trace
Part IV
................................................................................................................................... 77
Generator settings
79
1 Domain
................................................................................................................................... 81
2 Level
................................................................................................................................... 81
3 Outstate
................................................................................................................................... 82
4 Meter
................................................................................................................................... 82
5 StepSweep................................................................................................................................... 83
© 2015 NTi Audio AG, MBe
Contents
3
6 GlideSweep
................................................................................................................................... 93
7 Weighting ................................................................................................................................... 99
Part V
Analyzer settings
1 Domain
101
................................................................................................................................... 102
2 Range (Meter,
...................................................................................................................................
StepSweep)
102
3 GlideSweep
...................................................................................................................................
range
103
4 Coupling ................................................................................................................................... 103
5 Bias
................................................................................................................................... 104
6 Microphone
...................................................................................................................................
sensitivity
104
7 Reference...................................................................................................................................
dBr
105
8 Reference...................................................................................................................................
frequency
105
9 Filter
................................................................................................................................... 106
10 Synchronization
................................................................................................................................... 111
11 Meter
................................................................................................................................... 111
12 StepSweep
................................................................................................................................... 112
13 GlideSweep
................................................................................................................................... 114
Part VI
119
Digital
1 AES
................................................................................................................................... 119
Settings
Carrier status
Channel status
Sync input status
.......................................................................................................................................................... 119
.......................................................................................................................................................... 120
.......................................................................................................................................................... 121
.......................................................................................................................................................... 122
Part VII Regulators, equalization
124
1 Generator...................................................................................................................................
level
125
2 GlideSweep
...................................................................................................................................
range
129
3 Generator...................................................................................................................................
equalization
130
4 Sensitivity...................................................................................................................................
calibration
134
Part VIII Measurements, results, calculations
1 Meter
136
................................................................................................................................... 138
2 StepSweep
................................................................................................................................... 141
3 GlideSweep
................................................................................................................................... 144
4 Measurement
...................................................................................................................................
functions
145
Frequency
.......................................................................................................................................................... 146
Level, input level, selective
..........................................................................................................................................................
level
147
FFT
.......................................................................................................................................................... 150
Gain
.......................................................................................................................................................... 154
THD, THDN, harm onics
.......................................................................................................................................................... 156
Phase (interchannel)
.......................................................................................................................................................... 160
XTalk (interchannel)
.......................................................................................................................................................... 163
PureSound
.......................................................................................................................................................... 165
DCV
.......................................................................................................................................................... 169
DCR
.......................................................................................................................................................... 170
Speaker im pedance
.......................................................................................................................................................... 173
Signal latency
.......................................................................................................................................................... 176
Im pulse response .......................................................................................................................................................... 177
ETC
.......................................................................................................................................................... 178
AES input sam ple rate
.......................................................................................................................................................... 179
Sync input sam ple ..........................................................................................................................................................
rate
180
© 2015 NTi Audio AG, MBe
4
FX-Control User Manual
Settling
Units
.......................................................................................................................................................... 180
.......................................................................................................................................................... 181
5 Measurement
...................................................................................................................................
execution
182
Continuous
Single
Repeat
.......................................................................................................................................................... 184
.......................................................................................................................................................... 184
.......................................................................................................................................................... 185
6 Result display
...................................................................................................................................
& data handling
186
Num erical display .......................................................................................................................................................... 186
Bargraph
.......................................................................................................................................................... 187
Graph
.......................................................................................................................................................... 187
Passed/Failed display
.......................................................................................................................................................... 192
Data logging
.......................................................................................................................................................... 193
Full resolution results
.......................................................................................................................................................... 194
7 Calculations
................................................................................................................................... 195
Calculation item s .......................................................................................................................................................... 196
Operators, units .......................................................................................................................................................... 203
Calculation exam ples
.......................................................................................................................................................... 205
Part IX
Tolerance limits
216
1 Device limits
................................................................................................................................... 217
2 Software limits
................................................................................................................................... 222
Part X
Sequences
228
1 Establish a...................................................................................................................................
sequence
233
2 States, steps
................................................................................................................................... 235
3 Examples................................................................................................................................... 242
a) Am plifier test .......................................................................................................................................................... 242
b) 4 identical DUTs .......................................................................................................................................................... 244
c) 3-w ay loudspeaker
.......................................................................................................................................................... 246
d) DCR, im pedance ..........................................................................................................................................................
response
250
e) Octave band m easurem
..........................................................................................................................................................
ent
251
Part XI
Advanced
256
1 Routing
................................................................................................................................... 256
2 Option
................................................................................................................................... 257
3 General ................................................................................................................................... 257
Part XII Application hints
259
1 Demo projects
................................................................................................................................... 259
2 Tutorial
................................................................................................................................... 263
3 X/Y-axis scaling
................................................................................................................................... 269
4 External signal
...................................................................................................................................
analysis
270
5 Measurement
...................................................................................................................................
speed
273
6 Template ...................................................................................................................................
for build report
273
7 Shortcuts,...................................................................................................................................
mouse
277
8 IEEE 488 ................................................................................................................................... 278
Part XIII Support
281
Index
282
© 2015 NTi Audio AG, MBe
Part
I
6
1
FX-Control User Manual
Introduction
FX100 audio generator & analyzer together with the FX-Control software form a highly flexible, extremely
fast and powerful test & measurement system that meets the requirements of a wide range of
applications.
R&D labs
Mass production
Service & repair centers
For dedicated support or calibration services, please contact you nearest NTi Audio partner.
© NTi Audio AG
Im alten Riet 102
9494 Schaan
Liechtenstein, Europe
Phone +423 239-6060
Fax +423 239-6089
www.nti-audio.com
v 2.8.2/0e, July 2015
© 2015 NTi Audio AG, MBe
Introduction
1.1
7
Safety instructions
Operate the instrument only in appropriate environments and under the conditions specified by NTi Audio.
Do not open, disassemble, modify or attempt to repair the instrument.
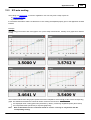
Make sure that the instrument’s nominal voltage setting matches the nominal voltage of the AC supply network
before switching ON the instrument.
Only operate the instrument with an intact power cable, where the protective earth connection is not broken.
Pay special attention (especially to not isolated electrical contacts) if you are working with voltages > 50 V
Install the instrument in a way that sufficient air ventilation is ensured. Do not close any slots or openings nor
obstruct the instrument’s internal ventilator.
Do not place the instrument on or close to heat-generating devices such as radiators or fan heater.
Make sure that the environmental temperature does not exceed the maximum temperature specified in the data
sheet.
Do not insert any objects into the openings in the housing or pour any liquids onto or into the housing.
Keep in mind that this instrument has no brain – use your own!
© 2015 NTi Audio AG, MBe
8
FX-Control User Manual
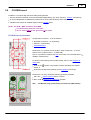
1.2
HW, SW installation
Hardware
Carefully unpack the instrument and place it on a flat, stable surface.
Connect the instrument to AC mains via the power cord.
Link the CPU board to the controller PC via a standard USB cable.
Switch the instrument ON.
PC-software
Controller-PC requirements
CPU
Pentium 400 MHz, 96 MB RAM (minimum)
Pentium 1 GHz, 256 MB RAM (recommended)
Architecture
x86 or x64
Operating system
Windows XP SP3 or higher (64 bit versions of Windows are supported)
Windows installer
3.1 or higher
Internet explorer
5.01 or higher
Communication interface
USB (TCP/IP interface not yet supported)
Software installation procedure
1. Insert the CD
2. Double-click on the icon "Setup.exe"
Hint
If the connected FX100 device is replaced by another unit, a hardware scan has to be executed to reestablish system operation.
© 2015 NTi Audio AG, MBe
Introduction
1.3
9
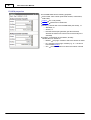
License agreement
Scope
This End-User License Agreement (“EULA”) is a legal agreement between you (either an individual or a single entity)
and NTi Audio AG (“NTi Audio”). By installing or using the NTi Audio software, content or documentation (collectively
the “NTi Audio software”) accompanying this EULA, you accept these terms and are consequently bound to them. If
you do not agree to the terms of this EULA, do not install or use the NTi Audio software.
The NTi Audio software is licensed, not sold, to you by NTi Audio for use only under the terms of this license
agreement. This EULA only gives you some rights to use the software. You may use the software only as expressly
permitted in this EULA.
This EULA also applies for all upgrades or updates to the NTi Audio software (if any), supplements, internet-based
services, and support services for this NTi Audio software, unless other terms accompany those items. If so, those
terms will govern.
License Uses and Restrictions
A. Software Installation: Subject to the terms and conditions of this license agreement, you are granted a limited,
non-exclusive license to use and run the NTi Audio software. Data transfer from a FX100 Audio analyzer to the NTi
Audio software is only enabled if the corresponding license is installed on the analyzer.
B. No Reverse Engineering: You may not and you agree not to, or to enable others to, copy (except as expressly
permitted by this license agreement or by the usage rules if they are applicable to you), publish, distribute,
decompile, reverse engineer, disassemble, attempt to derive the source code of, decrypt, modify, or create derivative
works of the NTi Audio software or any services provided by the NTi Audio software, or any part thereof.
C. Termination: This license is effective until terminated. Your rights under this license agreement will terminate
automatically or otherwise cease to be effective without notice from NTi Audio if you fail to comply with any term(s)
of this license agreement. Upon the termination of this license, you must cease all use of the NTi Audio software
and destroy all copies, full or partial, of the NTi Audio software.
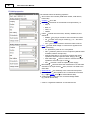
Services
The NTi Audio software may enable access to NTi Audio and third party services and web sites (collectively and
individually, “NTi Audio services”). Such NTi Audio services may not be available in all languages or in all countries.
Use of these NTi Audio services requires internet access and use of certain NTi Audio services may requires an NTi
Audio ID, may require you to accept additional terms and may be subject to additional fees. By using this software
in connection with an NTi Audio ID or other NTi Audio account, you agree to the applicable terms of service for that
account.
Disclaimer
A. NTi Audio and all our affiliates do not give any warranty, guarantee or conditions for this software, i.e. you bear
the sole risk of using it. This limitation applies to anything related to this software, including breach of contract,
warranty, guarantee or condition, strict liability, negligence or other tort to the extent permitted by applicable law. It
also applies if NTi Audio knew or should have known about the possibility of the damages.
B. The NTi Audio software and services are provided “as-is”, i.e. with all faults. You bear the sole risk of using it. NTi
Audio gives no express warranties, guarantees or conditions. NTi Audio excludes the implied warranties of
merchantability, fitness for a particular purpose and non-infringement.
C. You acknowledge that the NTi Audio software and services are not intended or suitable for use in situations or
environments where the failure or time delays of, or errors or inaccuracies in the content, data or information
provided by, the NTi Audio software or services could lead to death, personal injury, or severe physical or
environmental damage, including without limitation the operation of nuclear facilities, aircraft navigation or
communication systems, air traffic control, life support or weapons systems.
D. No oral or written information or advice given by NTi Audio or an NTi Audio authorized representative shall create
a warranty. Should the NTi Audio software or services prove defective, you assume the entire costs of all necessary
servicing, repair or correction.
© 2015 NTi Audio AG, MBe
10
FX-Control User Manual
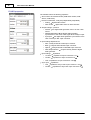
E. In no event shall NTi Audio be liable for personal injury, or any incidental, special, indirect or consequential
damages whatsoever, including, without limitation, damages for loss of profits, loss of data or information, business
interruption or any other commercial damages or losses, arising out of or related to your use or inability to use the
NTi Audio software or services or any third party software or applications in conjunction with the NTi Audio software
or services, however caused, regardless of the theory of liability (contract, tort or otherwise) and even if NTi Audio
has been advised of the possibility of such damages. In no event shall NTi Audio’s total liability to you for all
damages exceed the amount of ten US dollars (USD 10.00). The foregoing limitations will apply even if the above
stated remedy fails of its essential purpose.
Separate Provisions
If any provision of this EULA shall be held to be invalid, illegal or unenforceable, the validity, legality and
enforceability of the remaining provisions shall in no way be affected or impaired thereby.
Privacy
At all times your information will be treated in accordance with NTi Audio’s privacy policy, which is incorporated by
reference into this license agreement and can be viewed at http://www.nti-audio.com/privacy-statement
Controlling Law
This license agreement will be governed and construed in accordance with the laws of Liechtenstein, Europe,
excluding its conflict of law principles. No amendment to or modification of this EULA will be binding unless in
writing and signed by NTi Audio. The English version of this EULA shall govern, to the extent not prohibited by local
law in your jurisdiction.
© 2015 NTi Audio AG, MBe
Part
II
12
FX-Control User Manual
2
Hardware
NOTE NTi Audio recommends annual calibration of FX100. A message on the unit's LCD indicates
expiration of this period.
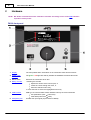
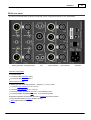
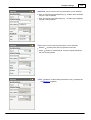
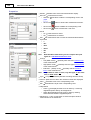
FX100 front panel
1
Display
The LCD provides basic information on the instrument status and test results
2
PASS / FAIL
indicator
The green / red light bars directly indicate the PASSED or FAILED test result
3
Mains switch
Switches the instrument ON or OFF
4
Rotary encoder
i. Rotating the encoder
adjusts the volume of the monitor jack, or
moves the cursor through the menu, or
varies the selected menu entry,
ii. Press the knob to select the highlighted menu entry.
5
USB interface
USB type A connector data transfer between memory stick and instrument
test parameters (stick
instrument)
result data (instrument
stick)
6
Headphone jack
Provides the input signal (unprocessed or filtered)
© 2015 NTi Audio AG, MBe
Hardware
13
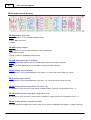
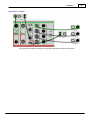
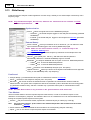
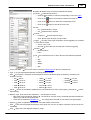
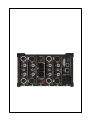
FX100 rear panel
The rear of the FX100 hosts the plug-in boards that can be configured according to your requirements.
Analog generator Analog analyzer
SIL
Output switcher
Standard configuration
Controller board
2-channel analog generator (DAC)
2-channel analog analyzer (ADC)
Optional plug-in boards
additional 2-channel analog generator + analyzer (=> 4-chn in total)
4-channel output switcher (1-in-4 or 2-in-2)
4-channel input switcher (4-in-1 or 2-in-2)
2-channel speaker impedance low (max. 2 A) measuring board
2-channel speaker impedance high (max. 10 A) measuring board
Speaker impedance power board with built-in amplifier and current sensor
Low-pass filter board for D-class amplifier testing
AES3 digital audio interface board
© 2015 NTi Audio AG, MBe
Input switcher
Controller
14
FX-Control User Manual
FX100 audio boards & buses
FX-GEN analog generator
Output channels 1, 2 can be linked individually to the
XLR + BNC connectors
Outbus
FX-ANA analog analyzer
Input channels 1,2 can be linked individually to the corresponding
XLR, BNC connector
Inbus or OutBus (
readback measurement)
FX-AES digital generator & analyzer
Output is permanently linked to the corresponding XLR, BNC and TOSLINK connectors
Input can be linked individually to the XLR, BNC or optical TOSLINK connector
FX-OS analog output switcher
Each connector can be linked individually to the Outbus 1 or 2 (only one link per Outbus at a time)
FX-IS analog input switcher
Each connector can be linked individually to the Inbus 1 or 2 (only one link per Inbus at a time)
FX-SIL analog speaker impedance low (max. 2 A)
The Speakon™ input connector, shunt resistor or Banana output connector can be linked to Inbus 1, 2
FX-SIH analog speaker impedance high (max. 10 A)
The Speakon™ input connector, current sensor or Speakon™ output connector can be linked to Inbus 1, 2
FX-SIP analog speaker impedance power
The integrated power amplifier and current sensor can be linked to the Banana and Speakon™ output connectors
© 2015 NTi Audio AG, MBe
Hardware
15
FX-DF low-pass filter for D-class amplifier testing
The Speakon™ input connectors can be linked to Inbus 1, 2
NOTE Aside from the standard analog generator & analyzer boards, FX100 can host a maximum of
three plug-in options.
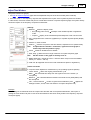
FX100 mainframe properties
Hardware & Wiring properties
The FX100 properties that are displayed in the Hardware & Wiring
view
Name
the name of the connected FX100 can be customized
Connected
allows to disconnect FX100 from the controller-PC;
as soon as the instrument is re-connected, FX-Control is
synchronized to its current status
Show Audio Bus
displays or hides the Outbus, Inbus and
related links in the Hardware & Wiring view
Work sheets
The FX100 properties that are displayed in the
Worksheets
Serial Number
FX100 Device
unique ID of the connected
No. of Channels
number of installed
generator & analyzer channels (2 or 4)
PureSound
options
status of installed software
Firmware Ver.
firmware
version of the installed
Api Ver.
version of the API (Application
Programming Interface) command set
Hardware Configuration
o Slot number
o Name
o ID
o PCB serial number
o PCB version
o PCB index
o Hardware revision
© 2015 NTi Audio AG, MBe
installed boards with
16
2.1
FX-Control User Manual
Display & rotary encoder
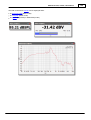
The LCD & rotary encoder can be used for a number of features such as PASS/FAIL indication, headphone volume
control or sequencer operation.
To access these features, move the cursor to the corresponding menu entry by turning the rotary encoder and
pressing it for confirmation.
NOTE NTi Audio recommends annual calibration of FX100. A message on the unit's LCD indicates
expiration of this period.
Test
Result
The key purpose of the LCD is to visually indicate the test result, which is further emphasized by
two light bars on the left & right sides of the display. Suppose, for example, that the operator has
defined tolerance limits for the active measurements. Then the light bars will glow either green or
red, depending whether the last test PASSED or FAILED any of the given limits.
Messages
-----
idle state
Armed
analyzer waits for a measurement trigger
Measure
instrument is executing a measurement
Passed
measurement results meet the acceptance criteria (green light bar)
Failed
measurement results exceed the tolerance limits (red light bar)
Cal Req
FX100 needs to be calibrated (contact NTi Audio service station)
Alarms
OUTP1 OVLD
overload of output channel 1
OUTP2 OVLD
overload of output channel 2
Operating mode
This indicator shows the measuring mode in which the instrument is operating
Meter mode
Meter
StepSweep
StepSweep mode
GlideSweep
GlideSweep mode
Seq#
the active Sequence
TEST#:
the sequence that is currently executed
Furthermore, it indicates the current status of the corresponding mode, i.e.
idle
running
waiting for trigger
sequencer configuration
© 2015 NTi Audio AG, MBe
Hardware
Remote control status
Shows the IEEE 488.1-1987 remote control status
LOC
Local
REM
Remote
LWL
Local with lockout
RWL
Remote with lockout
Err
System error queue
error number
##.##
Clear Queue
clears the error queue
Status of the ¼" headphone jack, which is used to monitor the incoming signal of the selected input channel
monitoring mode (Monitor or PureSound)
t#
input channel number
xx%
volume control
© 2015 NTi Audio AG, MBe
17
18
FX-Control User Manual
Sequencer
NOTE Please refer also to chapter "Sequences" for further details.
Main
The main sequencer status comprises the following elements
disabled
no sequence is active | enabled
Autorun: Seq #
selected sequence after start-up
confirm | cancel the current settings
OK | Cancel
Used Seq Memory: x%
FX100 automatically loads the
memory space that is occupied by the stored sequences
Sequencer status
sequence stopped
# TEST
Abort
sequence running
aborts the currently running sequence
Sequences
LCD content if a specific sequence has been selected
disabled
no sequence is active
Sequence #
Name
name of the currently active sequence (e.g. "Test1")
Size
memory space of the active sequence
Exec
start execution of the active sequence
Load
download a new sequence from the root directory of a connected USB stick
Delete
delete the selected sequence
Ret
return to sequencer list items
Sequencer status
sequence stopped
# TEST
Abort
sequence running
aborts the currently running sequence
© 2015 NTi Audio AG, MBe
Hardware
Ret
Return to main menu
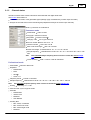
Menu "System"
Menu
entry
Display
Supported actions
?CAL
Date of the latest FX100 calibration, and the due date for the next
calibration.
-
?SNR
Serial number of the FX100.
-
=VER
Actual version of the firmware, and of the OS/BSP image / bootloader.
Start firmware update
?LIC
List of installed licenses and their expiration dates.
-
?HW
List of slots and installed boards with the respective versions.
-
=TIME
Date & time of the on-board real-time clock.
Adjust date & time
=IP
IP address of the FX100.
Adjust IP settings
=DNS
DNS of the FX100.
Adjust DNS
=TST
-
-
=AUX
Shows the input, output pin status of the auxiliary I/O interface
Set or clear output pins
RET
-
Return to main menu
© 2015 NTi Audio AG, MBe
19
20
2.2
FX-Control User Manual
Headphone jack
The ¼" headphone jack on the front panel is used to listen to the input signal in two modes,
Monitor - the input signal after the filter stage (e.g. A-weighting, lowpass etc.)
PureSound - the input signal after the PureSound bandpass-filter
Channel selection and volume control are accessible in two ways, via the
Toolbox
Advanced General
display & rotary encoder.
2.3
Headphone,
USB-A ports
The USB-A ports on the FX100 front panel and CPU-board support the following features.
Transfer of user-defined sequence(s) from a PC to the instrument
FX100 firmware update
NOTE The FX100 operating system automatically labels the 1st USB-A that is connect as "USB HD".
The 2nd USB-A that is connected is labeled "USB HD2".
2.4
USB-B port
The USB-B port on the CPU-board is the standard link to the controller PC.
© 2015 NTi Audio AG, MBe
Hardware
2.5
Auxiliary I/O interface
FX100 features a built-in auxiliary I/O interface that allows you to initiate measurements by an external trigger
impulse, or provide feedback on the measurement status & outcome.
Pin assignment
Pin 1...8:
= In 1 etc.)
Inputs (pin 1
Pin 9, 10:
GND
Pin 11, 12:
GND
Pin 13...20:
Outputs (pin
13 = Out 1 etc.)
Electrical specifications
Input level range
max. –0,5 ... 5,5 V
VIH = 2 V
VIL = 0.8 V
Input impedance
10 k
Output level range
3.3 V TTL
VOHmin = 2.4 V (@ IOH = 3 mA)
VOLmax = 0.4 V (@ IOH = –3 mA)
Output impedance
typ. 50
; min. 43
/ max. 80
Cable connection
You may link the auxiliary I/O interface to an external device (e.g. PLC) by using a cable with a Mini D Ribbon
(MDR) connector.
© 2015 NTi Audio AG, MBe
21
22
FX-Control User Manual
Auxiliary output wiring examples
Output interface circuit for LED < 3mA
Output interface circuit for LED > 3mA
© 2015 NTi Audio AG, MBe
Hardware
Output interface circuit for PLC
Output interface circuit for relay controls
© 2015 NTi Audio AG, MBe
23
24
FX-Control User Manual
Auxiliary input wiring examples
Input interface circuit for push button
Input interface circuit for PLC
© 2015 NTi Audio AG, MBe
Hardware
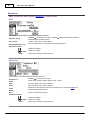
2.6
25
FX-GEN board
FX-GEN is a 2-channel high-precision analog audio generator
The two generator channels can be parameterized independently (e.g. level, frequency, outstate, internal link)
In case of StepSweep or GlideSweep measurements, both channels always start simultaneously
FX-GEN must always be installed together with an FX-ANA board
NOTE The XLR + BNC connectors of FX-GEN
are permanently linked to each other
can be linked either to the generator or the Inbus
FX-GEN internal schematic
The generator channels 1, 2 can be linked to
XLR+BNC connectors 1, 2 respectively
Outbus 1, 2 respectively
DC Measurement
Furthermore, it is possible to link the XLR + BNC connectors 1, 2 via the
Outbus to the analyzer inputs 1, 2 respectively.
Thus, it is possible to measure the bias of the input of a connected device (
readback measurement).
To edit the internal wiring of the FX-GEN board, switch to the Hardware &
Wiring view,
click on the
status, or
symbol of a generator channel and select the required
amend the corresponding settings via the properties (see below)
Furthermore, you may amend the following generator properties.
ON / OFF
BAL / UNB
Hint
© 2015 NTi Audio AG, MBe
output connector active or muted
balanced or unbalanced operation
The Banana plug is permanently connected to GND (chassis)
26
FX-Control User Manual
FX-GEN properties
The FX-GEN board has the following properties
Slot number: DAC number (PCB serial number, PCB version,
PCB index)
Output
OutState
On or Off (muted)
Balanced or Unbalanced
Routing
internal link of the FX-GEN board (see above), i.e.
o XLR+BNC, or
o Outbus, or
o DCmeasurement (the generator gets disconnected,
whereas the built-in DC current source of the analyzer is
activated)
Out Bus
internal link of the Outbus, whereby
"Module,No,Chn" stands for
o Module
the plug-in module to which the Outbus is linked
o No
number of the plug-in module (e.g. "2" = the 2nd of
two installed FX-OS)
o Chn
the module channel to which the Outbus is linked
© 2015 NTi Audio AG, MBe
Hardware
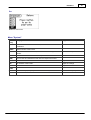
2.7
27
FX-ANA board
FX-ANA is a 2-channel high-precision analog audio analyzer
In Meter, StepSweep or GlideSweep mode, the analyzer acquires all supported measurement functions,
regardless of the queried results
The bias of the two input channels can be adjusted individually
In case of StepSweep or GlideSweep measurements, both channels always start simultaneously
FX-ANA must always be installed together with an FX-GEN board
FX-ANA internal schematic
The analyzer channels 1, 2 can be linked to
XLR connectors 1, 2 respectively
BNC connectors 1, 2 respectively
Inbus 1, 2 respectively
Outbus 1, 2 respectively (readback measurements are possible with this
configuration)
To edit the internal wiring of the FX-ANA board, switch to the Hardware &
Wiring view,
click on the
status, or
symbol of an analyzer channel and select the required
amend the corresponding settings via the properties (see below)
Furthermore, you may edit the coupling of the input connectors by clickng
on the AC / DC entry.
Hint
© 2015 NTi Audio AG, MBe
If the DUT is floating (i.e. without any connection to ground)
and unbalanced, its shield / ground must be connected to the
Banana plug of the FX-ANA board, which is connected to GND
(chassis)
28
FX-Control User Manual
FX-ANA properties
The FX-ANA board has following properties
Slot number: ADC number (PCB serial number, PCB version,
PCB index)
Coupling
AC or DC
Routing
internal link of the FX-ANA board (see above), i.e.
o XLR, or
o BNC, or
o Inbus, or
o Outbus
In Bus
internal link of the Inbus, whereby "Module,No,Chn"
stands for
o Module
the plug-in module to which the Inbus is linked
o No
number of the plug-in module (e.g. "2" = the 2nd of
two installed FX-IS)
o Chn
the module channel to which the Inbus is linked
Bias
optional offset voltage or current that is applied to the
input connector(s)
o 2V
Phantom power for 2 V microphones
o 48V
Phantom power for 48 V microphones (default status
for M2010, M2015 microphones)
o DCR 5R range
1.4 mA current to measure the output
impedance of the DUT (Device Under Test) (up to 5 k )
o DCR 100k range
100 mA current to measure the output
impedance of the DUT (up to 100 k )
o ICP*
constant current microphone power supply
Bias Settling
idle time before the measurement can start after
activation of an input channel
thus, the DUT can settle to the
active bias
MicSensitivity
the sensitivity of the connected microphone
Shunt Resistor
the impedance of a connected shunt resistor
(e.g. 1 for FX-SIL or 20 for external RT-IB 100V)
Voltage Divider
the ratio of a connected voltage divider
(e.g.4.93 for RT-IB 100V)
*: ICP® is a registered trademark of PCB Piezotronics
© 2015 NTi Audio AG, MBe
Hardware
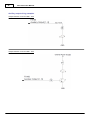
2.8
29
FX-AES board
FX-AES is a 2-channel digital audio generator & analyzer
The board supports the generation and analysis of Meter, StepSweep or GlideSweep test signals and
measurements
The sampling clock can be generated internally or synchronized to an external source
In case of StepSweep or GlideSweep measurements, both channels always start simultaneously
FX-AES must be installed together with a FX-GEN and FX-ANA board
FX-AES internal schematic
The internal wiring of the FX-AES board can be edited in the Hardware &
Wiring view.
The digital audio generator is permanently linked to the XLR, BNC,
TOSLINK connectors
The digital audio analyzer can be linked alternatively to the
XLR input connector
BNC input connector
TOSLINK input connector
Furthermore, you can
click on the
symbol of the digital audio analyzer and select the
required status, or
amend the corresponding settings via the properties (see below),
link the generator clock source to the BNC Sync Ref. Input or the
analyzer input,
link the analyzer directly to the generator in order to analyze in generated
signal,
select the impedance of the analyzer or sync input connectors.
Hint
© 2015 NTi Audio AG, MBe
The digital audio generator, analyzer can not be connected to
the internal audio bus of the FX100
30
FX-Control User Manual
FX-AES properties
The FX-AES board has following properties
Slot number: AES board number (PCB serial number, PCB
version, PCB index)
Domain of Generator, Analyzer (independently adjustable)
o Analog
digital audio inactive
o AES Ch1&2
digital audio active on both channels
Output settings
Source
o Internal
the digital audio generator uses to its own clock
source
o AESInputRecovered
the digital audio generator
synchronizes to the clock of the signal at the analyzer input
o SyncInput
the digital audio generator synchronizes to the
clock of the Sync Ref. Input connector
Input settings
Connector
o XLR
analyzer linked to XLR input connector
o BNC
analyzer linked to BNC input connector
o Optical
analyzer linked to TOSLINK input connector
o AES Output Monitor
audio generator
Input settings
o 110 Ohm
o 75 Ohm
o Hi-Z
analyzer directly linked to digital
Impedance
impedance of input connectors 110
impedance of input connectors 75
impedance of input connectors >10 k
Sync Input
Impedance
o Hi-Z
impedance of Sync Ref. Input connector >10 k
o 75 Ohm
impedance of Sync Ref. Input connector 75
© 2015 NTi Audio AG, MBe
Hardware
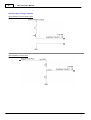
2.9
31
FX-SIL option
The FX-SIL plug-in board is used to measure either
a) the AC-impedance of the connected loudspeaker(s) via two high-precision 1
shunt resistors, or
b) the DC resistance of the connected loudspeaker(s) by feeding a small current through the DUT.
NOTE An external amplifier is required to measure the loudspeaker impedance with the FX-SIL board;
alternatively, you may use the FX-SIP board.
The maximum current through the FX-SIL option is 1 A
FX-SIL internal schematic
The FX-SIL elements can be routed internally as
follows
Speakon™ IN to
o Channel 1, 2 of the analyzer
required link
to measure or equalize the amplifier output
voltage
o None (i.e. no connection)
Shunt resistor 1, 2 to
o Channel 1, 2 respectively
required link to
measure the AC-impedance of a connected
DUT (Device Under Test)
o None (i.e. no connection)
Banana output connectors to
o Inbus 1, 2
measure the DCR of the DUT,
or equalize the actual driving voltage.
o None (i.e. no connection)
Right-click on any symbol in the Hardware & Wiring
view to link it as required.
FX-SIL properties
The FX-SIL board has the following properties
Slot number: SpeakerImpedanceLow number (PCB serial
number, PCB version, PCB index)
Source
o AmplifierIn
Speakon™ IN connected to amplifier output
o Protected
Speakon™ IN disconnected from internal
circuit, e.g. due to an overflow
o DCR32ERange
internal current source of the SIL is active
(is used to measure the DC impedance of the connected
DUT in the range from 1.5 to 1500 )
© 2015 NTi Audio AG, MBe
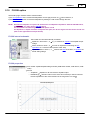
32
FX-Control User Manual
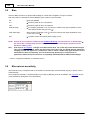
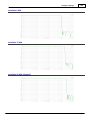
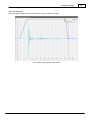
Safe operating area
Safe operating are for loads from 2...32
Safe operating are for loads from 2...250
© 2015 NTi Audio AG, MBe
Hardware
33
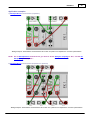
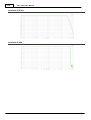
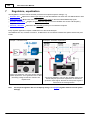
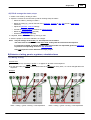
Application examples
a) AC-Impedance measurement (1 speaker)
Wiring example: simultaneous measurement via FX-SIL of speak er AC-impedance / acoustic performance
NOTE For an AC-Impedance measurement, you have to set the Analyzer Coupling to "AC", and the FXSIH property to "Amplifier".
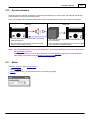
b) AC-Impedance measurement (2 speakers in parallel)
Wiring example: simultaneous measurement via FX-SIL of 2 speak ers AC-impedance / acoustic performance
© 2015 NTi Audio AG, MBe
34
FX-Control User Manual
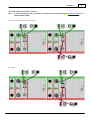
c) DCR measurement (1 speaker)
FX-SIL wiring example for DCR measurement (1 speak er)
NOTE For a DCR measurement, you have to set the Analyzer Coupling to "DC", and the FX-SIL property
to "DCR32ERange".
© 2015 NTi Audio AG, MBe
Hardware
2.10
35
FX-SIH option
The FX-SIH plug-in board is used to measure either
a) the AC-impedance of the connected loudspeaker via two high-precision 0.1
shunt resistors, or
b) the DC resistance of the connected loudspeaker by feeding a small current through the DUT
NOTE An external amplifier is required to measure the loudspeaker impedance with the FX-SIH board;
alternatively, you may use the FX-SIP board.
The maximum current through the FX-SIH option is 10 A
The Speakon™ output connector comprises four pins, two for the signal and two for the sense line
(refer to the application example below)
FX-SIH internal schematic
The FX-SIH can be linked internally as follows
Speakon™ IN to Inbus 1, 2
voltage
e.g. to measure or equalize the amplifier output
Shunt resistor to Inbus 1, 2
this link is required for measuring the ACimpedance of a connected DUT (Device Under Test)
Speakon™ OUT to Inbus 1, 2
actual driving voltage
measure the DCR of the DUT, or equalize the
FX-SIH properties
Slot number: SpeakerImpedanceHigh number (PCB serial number, PCB version, PCB
index)
Source
o AmplifierIn
Speakon™ IN connected to amplifier output
o DCR4Erange
internal current source of the SIH is active (is used to measure
the DC impedance of the connected DUT in the range from 2 to 100 )
© 2015 NTi Audio AG, MBe
36
FX-Control User Manual
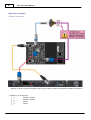
Application examples
a) Cable connections
Example of cable connections between FX100, FX-SIH option, FA400 audio amplifier and M2010 microphone
*: Speakon™ pin assignment
1+
Speaker+ (signal)
1–
Speaker– (signal)
2+
Sense+
2–
Sense–
© 2015 NTi Audio AG, MBe
Hardware
37
b) AC-Impedance measurement
Wiring example: simultaneous measurement via FX-SIH of speak er AC-impedance / acoustic performance
NOTE For an AC-Impedance measurement, you have to set the Analyzer Coupling to "AC", and the FXSIH property to "Amplifier".
c) DCR measurement
Wiring example for DCR measurement via FX-SIH
NOTE For a DCR measurement, you have to set the Analyzer Coupling to "DC", and the FX-SIH property
to "DCR4ERange".
© 2015 NTi Audio AG, MBe
38
2.11
FX-Control User Manual
FX-SIP option
The FX-SIP plug-in board provides all required components to execute a complete loudspeaker test, i.e.
Power amplifier (0 dB gain):
o DUAL mode: 2-chn @ 10 W
o BRIDGE mode: 1-chn @ 30 W
Current sensor: DC and AC, 0 to 250
NOTE The Speakon™ output connector comprises four pins, two for the signal and two for the sense line
(refer to the application example below)
FX-SIP internal schematic
Depending on the operation mode, the FX-SIP elements can be routed internally as described below.
a) DUAL mode
Amplifier In A / B to
o Outbus 1 / 2 respectively
o None (i.e. no connection)
Shunt A, B to
o Inbus 1 or 2
o None (i.e. no connection)
Banana output connectors to
o Inbus 1, 2
measure the DCR of the DUT, or equalize the actual driving
voltage.
o None (i.e. no connection)
b) BRIDGE mode
Amplifier In to
o Outbus 1
o None (i.e. no connection)
Shunt A to
o Inbus 1 or 2
o None (i.e. no connection)
Speakon™ OUT to Inbus 1, 2
actual driving voltage
measure the DCR of the DUT, or equalize the
FX-SIP properties
Slot number: SpeakerImpedancePower number (PCB serial number, PCB
version, PCB index)
Mode
o Dual (2-chn operation: 2*10 W into 2
o Bridge (1-chn operation: 1*30 W into 2
/4
)
/4
)
Source of Channel A, B
o Amplifier
o DCR250ERange
internal current source of the SIP is active (is used to
measure the DC impedance of the connected DUT in the range from 0 to
250 )
© 2015 NTi Audio AG, MBe
Hardware
39
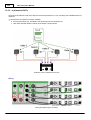
A) DUAL mode application examples
Hint
In case of a 2-speaker setup, you have to execute the tests either by using the sequence mode or a 4channel FX100 system.
A1. Frequency & impedance response
A2. DCR
© 2015 NTi Audio AG, MBe
40
FX-Control User Manual
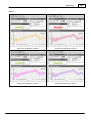
B) BRIDGE mode application examples
Hint
You must use a 4-wire cable* to connect the FX-SIP with the loudspeaker
B1. Frequency & impedance response
B2. DCR
*: Speakon™ pin assignment
1+
Speaker+ (signal)
1–
Speaker– (signal)
2+
Sense+
2–
Sense–
© 2015 NTi Audio AG, MBe
Hardware
2.12
41
FX-DF option
The FX-DF board allows to measure the performance of D-class amplifiers. It includes one low-pass filter per channel
that cuts off the amplifier noise beyond 20 kHz. The DF-option thus keeps away the impact of the amplifier's
switching circuitry from the measurement results in the audio band.
FX-DF internal schematic
The FX-DF can be linked internally as follows:
Banana or Speakon™ input CH A via the low-pass filter to Inbus 1
Banana or Speakon™ input CH B via the low-pass filter to Inbus 2
FX-DF properties
© 2015 NTi Audio AG, MBe
42
FX-Control User Manual
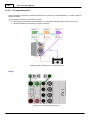
Application example
Wiring example: D-class amplifier and load connected to FX-DF board
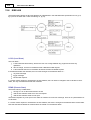
2.13
FX-OS option
The FX-OS output switcher plug-in board is used to add 4 additional output connectors to the FX100 generator
channels.
The link between the FX100 generator and an FX-OS connector is established via the Outbus 1, 2
Either or both generator output channels 1, 2 can be linked to any available FX-OS output connector.
The current generator coupling is applied via the Outbus on the active FX-OS connector
Up to three FX-OS boards can be installed in the FX100 (max. 12 switched output channels)
FX-OS internal schematic
Right-click on any XLR output connector to
link it to Outbus 1, 2 or any generator channel, or
switch it to idle mode
Hint
Only one of either Outbus 1 or 2 can be linked to one output
connector at a time
© 2015 NTi Audio AG, MBe
Hardware
43
FX-OS properties
The FX-OS has no editable properties
Slot number: OutSwitcher number (PCB serial number, PCB version, PCB
index)
Application example
FX-OS application example: switched testing of a 4chn device
© 2015 NTi Audio AG, MBe
44
2.14
FX-Control User Manual
FX-IS option
The FX-IS input switcher board is used to add 4 additional input channels to the FX100 analyzer.
The link between an FX-IS connector and the FX100 analyzer is established via the Inbus 1, 2
Any or all FX-IS input connectors can be linked to any available analyzer channel
An individual bias (e.g. Phantom power) can be activated for each FX-IS connector
Up to three FX-IS boards can be installed in the FX100 (max. 12 switched input channels)
FX-IS internal schematic
Right-click on any XLR input connectors to
link it to Inbus 1, 2 or any analyzer channel, or
switch it to idle mode
Furthermore, an individual bias can be activated
on each input connector.
Hint
Only one of either Inbus 1 or 2 can be
linked to one input connector at a
time
FX-IS properties
The FX-IS has the following properties
Slot number: InSwitcher number (PCB serial number, PCB version, PCB
index)
Bias
optional offset voltage or current that is applied to the input
connector(s)
o 2V
Phantom power for 2 V microphones
o 48V
Phantom power for 48 V microphones (default status for
M2010, M2015 microphones)
o DCR 5k range
1.4 mA current to measure the output impedance of
the DUT (Device Under Test) (up to 5 k )
o DCR 100k range
100 A current to measure the output impedance
of the DUT (up to 100 k )
o ICP*
constant current microphone power supply
Settling
idle time before the measurement can start after activation of an
input channel
thus, the DUT can settle to the active bias
*: ICP® is a registered trademark of PCB Piezotronics
© 2015 NTi Audio AG, MBe
Hardware
Application example
FX-IS application example: testing one loudspeak er with three switched microphones
© 2015 NTi Audio AG, MBe
45
Part
III
Software
3
47
Software
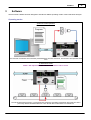
The FX-Control software has been designed to handle two different operating modes of the FX100 audio analyzer.
Operating modes
a) Remote control operation
The controller PC handles the instrument parameterization and test execution, and receives the uploaded result
data
b) Stand-alone mode
NOTE Not implemented under firmware version 2.6x or lower
The FX100 instrument executes a customized test sequence (including PASS/FAIL rating) that has been
previously defined & downloaded from a PC. Result data is transferred via TCP/IP link
© 2015 NTi Audio AG, MBe
48
FX-Control User Manual
FX-Control PC-software
The basic tasks and operations of FX-Control can be divided into four areas.
i.
System setup
Test parameters (generator adjustments)
Analyzer settings (e.g. input range, synchronization, triggering)
Measurement functions
ii.
Acceptance criteria
Tolerance limits
PASS / FAIL indication
iii. Test execution
Single shot measurement
Continuous mode
Sequences
iv. Data logging
Custom settings
Data export
FX100 firmware
The FX100 Firmware performs the following tasks.
a) Execution of remote commands from the controller PC
b) Upload of result data to the controller PC
c) Handling of the front panel control elements (LCD, rotary encoder)
d) Stand-alone operation (not yet implemented)
The FX100 firmware can be updated via FX-Control or a USB stick.
© 2015 NTi Audio AG, MBe
Software
3.1
49
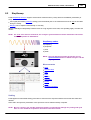
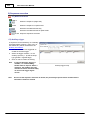
System operation
FX100 audio analyzer + FX-Control software are a comprehensive audio test system that covers a wide range of
measurements and analysis.
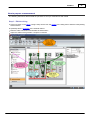
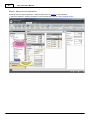
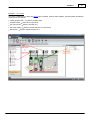
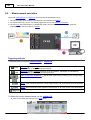
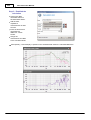
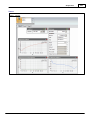
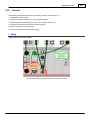
FX-Control desktop
Hints
The docking panels of FX-Control (e.g. Toolbox, WorkArea, Properties, Trace) can be arranged as
floating, dockable, tabbed or auto-hide.
The WorkArea can show either the Hardware & Wiring view or the Worksheet view
Application
button
project handling
Quick
access
toolbar
customized key functions & buttons
Ribbon
standard operation features
Toolbox
list of elements for the Hardware & Wiring view or Worksheets
WorkArea
design area for system wiring, test settings and result displays
Properties
individual properties of the selected item in the Toolbox or Hardware & Wiring view or
Worksheets
© 2015 NTi Audio AG, MBe
50
FX-Control User Manual
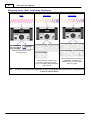
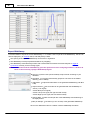
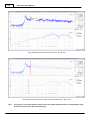
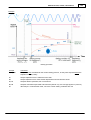
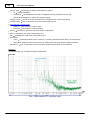
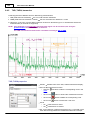
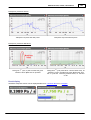
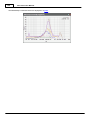
Measuring modes: Meter, StepSweep, GlideSweep
Meter
StepSweep
GlideSweep
'Steady state' analysis of the
incoming signal
FX100 analyzer measures the
incoming signal and plots the
results in a graph against frequency,
level or time
Hint
FX100 analyzer records incoming
GlideSweep, calculates the
measurement results and plots
them in a graph
All three measuring modes support the analysis of test signals that come from the FX100 generator
or from an external device.
© 2015 NTi Audio AG, MBe
Software
51
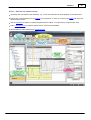
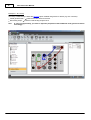
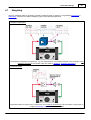
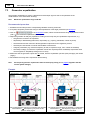
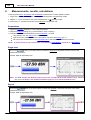
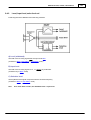
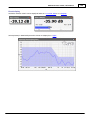
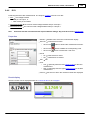
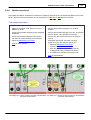
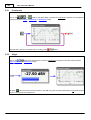
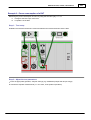
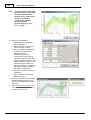
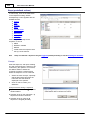
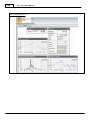
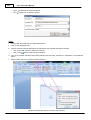
How to prepare a measurement
The following instructions demonstrate the procedure to set up a measurement with FX100.
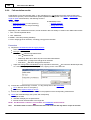
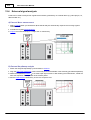
Step 1 - Edit the wiring
Click on a button in the ribbon or drag & drop an item from the toolbox to the wiring view to add the corresponding
external device
Optionally edit the properties of the external devices
Draw the cable connections and activate the internal links
Adjust the states of the generator / analyzer connectors
© 2015 NTi Audio AG, MBe
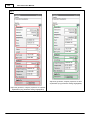
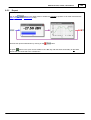
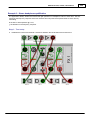
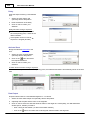
52
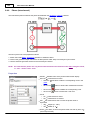
FX-Control User Manual
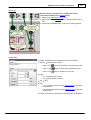
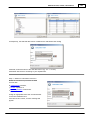
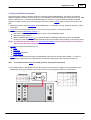
Step 2 - Adjust the test parameters
Drag & drop the required generator / analyzer panels from the toolbox to the WorkArea
Adjust the generator / analyzer properties in the corresponding panel or in the properties section
© 2015 NTi Audio AG, MBe
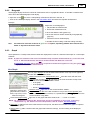
Software
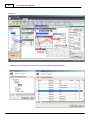
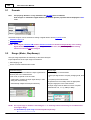
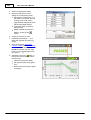
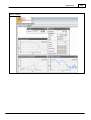
53
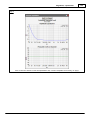
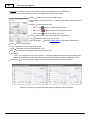
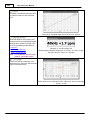
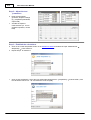
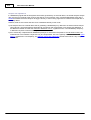
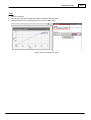
Step 3 - Activate the measurements
Optionally add new sheets to the WorkArea, e.g. to host the measurement result displays, and rename them
Drag & drop a measurement from the toolbox to the WorkArea, or click on a button in the ribbon and select the
required measurement
Use the regulators to adjust or equalize the generated test signal, or to optimize the analyzer input range
Add a calculation item to calculate special results out of the acquired data
Record reference data and define the tolerance limits
© 2015 NTi Audio AG, MBe
54
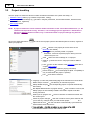
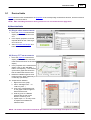
3.2
FX-Control User Manual
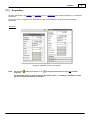
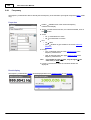
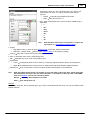
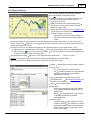
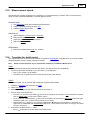
Project handling
The term 'project' is used for a file that contains all relevant information of a specific test setup, i.e.
Hardware & Wiring status (e.g. hardware components, routing)
Worksheet panels and settings (e.g. generator / analyzer parameters, active measurements, tolerance limits,
calculation items, regulators)
Data logging status
NOTE A project contains the exact hardware status information of the connected FX100 Device (i.e. the
installed boards) and the wiring. Therefore, if an existing project is applied on a FX100 Device
that has a different hardware status, only a restricted number of project settings may become
effective.
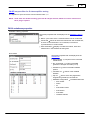
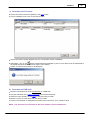
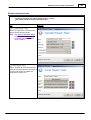
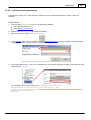
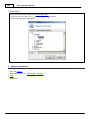
Click on the application button
delete your projects).
to save or load a project (use the Windows Explorer to rename, organize or
New
creates a new project (all current items of the
WorkArea are cleared)
Open
opens a previously saved *.FX project.
Alternative: select the requested project directly from the
"Recent Projects" list
Save
saves the current settings as *.FX project
Save as
name
saves the current *.FX project under a different
Print
prints out the contents of the WorkArea (refer also to
chapter 'View' ribbon)
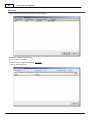
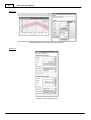
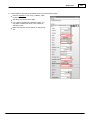
Options
opens the "Options" pop-up (see below)
Recent Projects
list of saved projects (Note: compatibility is
only checked when the project is opened)
Exit
Language
shuts down FX-Control
select the preferred language of the FX-Control menus & labels
Default Project Location
Startup Default Project
after startup
root directory for FX-Control projects
the corresponding project is opened automatically
Run Repeat Measurement at program startup
if this checkbox is ticked, the
Startup project is automatically loaded & executed in repeat mode after
running FX-Control
Save layout on program exit
the current layout
tick this checkbox to restart FX-Control with
Check for project changes
clear this checkbox if the system shall not ask
you to save any changes when you load another project
Adjust Date & Time
tick this checkbox to automatically synchronize the
internal FX100 clock with the PC
communication between the PC and FX100 in a file
© 2015 NTi Audio AG, MBe
Software
55
Open a new, existing project / Exit, save a project
Following general rules apply when you start FX-Control, open a new or an existing project, or when you exit or save
an open project.
i.
Start FX-Control
ii.
New Project
values
FX-Control copies all current settings of the connected FX100
FX-Control clears all items from the WorkArea, and resets all FX100 settings to the default
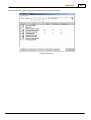
iii. Open Project
FX-Control loads the WorkArea status and the FX100 settings from the project file
iv. Exit Project
FX-Control prompts the user to confirm, whether the current project status shall be saved, or
not? (Hint: this interaction can be disabled, see above)
v.
Save Project
vi. Save Project As
© 2015 NTi Audio AG, MBe
FX-Control saves the current project status under the current name
FX-Control saves the current project status under a new, custom-defined name
56
3.3
FX-Control User Manual
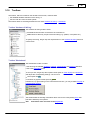
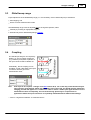
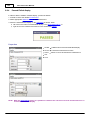
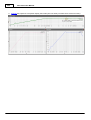
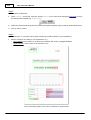
Quick access toolbar
The Quick access toolbar provides a direct access to preferred buttons and features. It can be customized as
follows to meet your individual needs:
Left-click on the arrow on the right-hand side to open the pull-down menu. Then select the required feature.
Right-click on any button in the ribbon and select "Add to Quick Access Toolbar".
Right-click on any button in the Quick access toolbar and select "Remove from Quick Access Toolbar"
Example of customized Quick access toolbar
© 2015 NTi Audio AG, MBe
Software
3.4
57
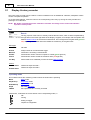
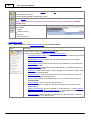
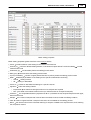
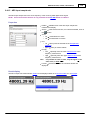
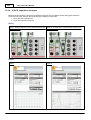
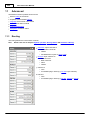
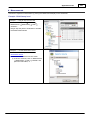
'Start' ribbon
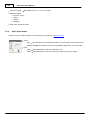
The Start ribbon comprises of three sections; Clipboard, Measurement and FX 1.
If a second or more FX100 Devices are connected to the controller PC, an additional section FX 2 etc. will be added
for each instrument.
Single FX100
Two or more FX100 Devices connected to the same controller PC
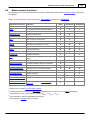
Button Description
Clipboard
Cuts the selected item from the Hardware & Wiring view or WorkArea
Copies the selected item from the Hardware & Wiring view or WorkArea
Pastes the selected item to the Hardware & Wiring view or WorkArea
Initiates a continuous Meter measurement
Initiates a continuous StepSweep measurement
Initiates a continuous GlideSweep measurement
Initiates the consecutive execution of all active measurements on the corresponding FX100 Device
Single shot (refers only to the selected sequence state)
Repeat
Abort
Opens the Sequence mode, i.e. sequential execution of a number of user-defined measurements
© 2015 NTi Audio AG, MBe
58
FX-Control User Manual
Initiates the consecutive single-shot execution of all active measurements (and of the complete sequence)
on all connected FX100 Devices
Initiates the repeated consecutive execution of all active measurements on all connected FX100 Devices
Stops the current ongoing measurement(s)
NOTE The green
and
buttons apply on all connected FX100 Devices, whereas the blue
buttons refer to the corresponding FX100 Device only.
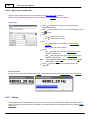
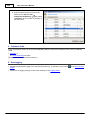
3.5
'View' ribbon
The buttons in the View ribbon are used to adjust the size, alignment and arrangement of the elements in the
WorkArea.
Zoom: enlarge or scale down the items in the WorkArea (same effect as Zoom slider).
Alignment and Size: select the panel(s) that require alignment or sizing, then click on the appropriate button.
Arrange: arrange the screen depth position of the selected panel in relation to each other.
Page Setup: click on the button "Show/Hide print Area" to show the area(s) of the WorkArea that will be printed
(e.g. via <Ctrl> + <P>)
© 2015 NTi Audio AG, MBe
Software
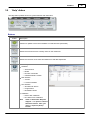
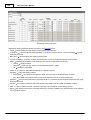
3.6
'Wiring' ribbon
The Wiring ribbon offers a number of standard items for use in the Hardware & Wiring view.
Hint
All buttons in the Wiring ribbon can be found also via right-click in the WorkArea when the
Hardware & Wiring view is active
Button Description
Executes a scan to detect all FX100 Devices or other devices that are connected to the controller PC
Adds a passive loudspeaker item to the Hardware & Wiring view
Adds an active loudspeaker item to the Hardware & Wiring view
Adds an M2010 measurement microphone item to the Hardware & Wiring view
Adds an M2015 measurement microphone item to the Hardware & Wiring view
Adds a generic microphone item to the Hardware & Wiring view
Adds an FA400 amplifier item to the Hardware & Wiring view
Adds a generic amplifier item to the Hardware & Wiring view
Adds an RT-IB external impedance box item to the Hardware & Wiring view
© 2015 NTi Audio AG, MBe
59
60
FX-Control User Manual
Adds a generic item, with an analog input & output, to the Hardware & Wiring view
(e.g. representing an equalizer, mixing console channel or other electronic circuit)
Adds an external signal source item to the Hardware & Wiring view
Adds an FX100 simulator item to the Hardware & Wiring view (e.g. for demo mode)
NOTE Projects that have been established with an FX100 simulator can not be applied on a real
FX100 Device
© 2015 NTi Audio AG, MBe
Software
3.7
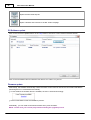
61
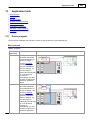
'Worksheets' ribbon
The buttons in the Worksheets ribbon are used to open new test parameter panels, measurement result displays or
calculation items.
Hint
All buttons in the Worksheets ribbon can be found also via right-click in the WorkArea when the
Worksheets view is active
Views
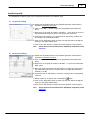
Button Description
Opens a new worksheet (aside from the existing ones). Thus, an overview of complex test setups or
comprehensive measurements is possible.
Click on the corresponding tab to access the worksheet.
Right-click on a tab to
o rename it
o close it or close all sheets but this one
o switch it to floating, dockable or tabbed
Place the required items (e.g. generator, analyzer panel or measurement display) on any worksheet
all items on all sheets are active
If a specific item is placed several times on the worksheet(s), then all these items are connected with
each other, i.e. if the contents of one item is edited, the connected items will change accordingly.
Adds a new test parameter / settings panel to the active worksheet
Generator
test signal parameters
Analyzer
input settings
Measurement
tolerance limits
Advanced
special settings (e.g. routing or headphone control)
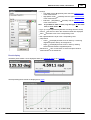
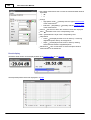
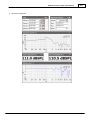
Adds a Meter measurement display that shows the acquired results numerically.
Adds a Meter measurement display that shows the acquired results numerically and in a bargraph.
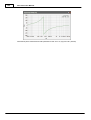
Adds a Meter, StepSweep or GlideSweep measurement display that shows the acquired result curve(s)
and tolerance limits in a graph.
© 2015 NTi Audio AG, MBe
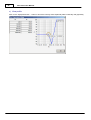
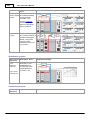
62
FX-Control User Manual
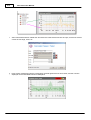
Adds a graphical measurement result display that records all acquired result curves, for example
all recorded FFT spectra
all recorded StepSweep or GlideSweep curves
Adds a display that shows the PASSED / FAILED result of the related measurement
NOTE The measurement must have tolerance limits set in order to implement a PASSED /
FAILED rating
Adds a text panel to the active Worksheet
with editable
header
contents (memo)
font size
background color
Calculation Items
Hint
Button
Please refer also to the detailed description of the Calculation Items
Description
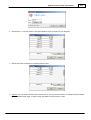
Upper section: adds a new generic calculation item.
Lower section: provides access to the default calculation items
o Calculated Passed / Failed: checks the output of another calculation item against the
user-defined Pass/Fail limits
o Overall Passed Failed: combines the individual Passed/Failed results of several
calculation items
o Unit Converter: shows the active measurement with a different unit of measurement
(e.g. V instead of dBV)
o Linear Interpolation: calculates the interpolated result at a user-defined frequency (xvalue) of a measured curve
o Smoothing: smooths the acquired curve by averaging the measurement results within
a window of user-defined width
o Relative Response: plots the acquired result curve relative in dB to the Y-value of a
reference point at an user-defined X-value
o Custom Curve: creates a user-defined curve (e.g. to be used as tolerance limit or
calculation data)
o Previous Result: shows the previous acquired result
o Linear Fit: calculates a straight line that represents the optimum linear fit to the
measured curve
o Sample Rate Deviation: shows the deviation of the sample rate, i.e. of the Frequency,
AES input sample rate, Sync input sample rate vs. the standardized digital sampling
frequencies (32 / 44.1 / 48 / 88.2 / 96 / 176.4 / 192 kHz)
o Curve Subrange: extracts the data of a restricted, user-defined frequency band from
within the full range of measured results.
© 2015 NTi Audio AG, MBe
Software
63
Regulators
Hint
Please refer also to the detailed description of the Regulators
Button
Description
The button opens the list of available regulator functions.
Generator Level: adjusts the FX100 output volume so that either the level or THD
of the test signal reaches a user-defined value at a specific point in the test setup
GlideSweep Range: evaluates the optimal FX100 input range (i.e. sensitivity) for
accurate GlideSweep measurements
Generator Equalization: calibrates the FX100 output signal so that it
compensates for the characteristics of the downstream device(s)
Sensitivity Calibration: measures the sensitivity of a connected microphone with
the aid of a microphone calibrator
© 2015 NTi Audio AG, MBe
64
3.8
FX-Control User Manual
'Logging' ribbon
This tab is used to enable data logging and adjust the log settings
Button
Description
Activate the data logging (this button is also located in the Quick access toolbar by default)
Adjust the logging parameters
i.
Default Folder: root directory where the log
files are stored.
ii.
File Type: log file format, e.g.
CSV (comma-separated values)
Text (tabbed text)
XLSX (open office XML)
iii. Renewal Conditions:
Never (all acquired results are saved to the
same log file)
Weekly (a new log file is created at the
beginning of a new week)
Daily (a new log file is created every day)
At Each Measurement (the results of
every measurement are saved in an
individual log file)
Adjust the parameters of the 'Full Resolution'
logging mode
i.
Default Folder: root directory where the log
files are stored.
ii.
File Type: log file format, e.g.
CSV (character-separated values)
Text (tabbed text)
Matlab (*.MAT file format)
Int 24bit WAV (integer WAV file, 24 bit
resolution)
Float WAV (floating point WAV file, 32 bit
resolution)
iii. Analog Peak Level Reference: editable value
of the maximum input signal amplitude;
corresponds to 100% (applies only for WAV
files)
© 2015 NTi Audio AG, MBe
Software
3.9
'Help' ribbon
The Help ribbon provides access to general features and information.
Buttons
Button
Description
Checks for updates of FX-Control software or FX100 firmware (see below)
Shows the licenses that are currently active on the instrument
Shows the real-time clock status and allows time and date adjustment
Shows the general instrument information
Hardware
o Serial number
o Model
o Number of channels
o Installed boards & version
DSP firmware
o Version
o Licenses installed
CPU firmware
o Windows CE version
o Image version
o Bootloader version
Calibration
o Date of last calibration
o Due date of next calibration
Hint
© 2015 NTi Audio AG, MBe
Click on the button "Request
Support..." to open an e-mail to
NTi Audio service. Thus, you
can e.g. request a (demo)
license
65
66
FX-Control User Manual
Opens the FX-Control help file
Opens a browser and connects to the NTi Audio homepage
PC-Software update
Click on the 'Check for Updates button' in the 'Help' ribbon to check for a new FX-Control software version.
Click on the 'Download' button to install the new version or to store it on your PC.
Firmware update
After startup, the software automatically checks the status of FX-Control as well as the connected FX100 Device
(assuming the PC is connected to the internet).
If a new software or firmware version is available, the user is informed accordingly.
Click on 'Download' to start the installation process.
Alternatively, you can install a new FX100 firmware at any time as follows.
NOTE Please save your current project before starting the upgrade process.
© 2015 NTi Audio AG, MBe
Software
67
a) Download via FX-Control
Click on the button 'Check for Updates' in the 'Help' ribbon
In the 'FX Updater' panel, click on the 'Check' button.
Click on the button 'Update' (appears only if a new firmware version is available).
Alternatively, click on the
button to download the firmware file to your PC, from where it can be transferred to
the FX100 instrument via a USB stick (refer to next chapter).
Confirm to continue the process in the dialog box.
b)
Download via USB-stick
Save the new firmware file in the root directory of a USB stick.
Plug the USB-stick into a USB-A connector of the FX100 instrument
Select the menu 'System' on the LCD by using the rotary encoder
Move the cursor to '=VER' and press the rotary encoder
Click on 'FW-UPDATE' to download the firmware to the instrument, or on 'Cancel' to abort.
NOTE The firmware file must match to the serial number of your FX100 Device.
© 2015 NTi Audio AG, MBe
68
FX-Control User Manual
Licenses
Click on the button 'Licenses' to show the active licenses.
To add (i.e. activate) a new license,
click on the button 'Next',
enter the license key (as provided by NTi Audio),
click on the button 'Add'.
© 2015 NTi Audio AG, MBe
Software
3.10
69
Toolbox
The toolbox, which is located on the left side of FX-Control, contains either
the available hardware elements for the wiring, or
the 'tree' with all control & results panels.
The toolbox allows to switching between the two views Hardware & Wiring – Worksheet
Toolbox 'Hardware & Wiring'
The Hardware & Wiring toolbox shows
all FX100 Devices that are connected to the controller PC
additional items that may be part of the test setup (e.g. speaker, microphone etc.)
To specify the wiring, drag & drop the required items to the Hardware & Wiring view and
connect them.
Toolbox 'Worksheets'
The Worksheets toolbox contains
the full range of available generator, analyzer, measurement and advanced elements
the active Calculation items
To set up a test, drag & drop the required control panel or result display to a WorkArea
and adjust the corresponding settings. The icon for a
control panel is blue
numerical or graphical result panel is green
Furthermore, by right-clicking on the measurement function, you may activate bargraph or
Passed/Failed displays.
The entries below the heading 'Calculation Items' refer to the corresponding items that
have been defined by the operator.
Hint
© 2015 NTi Audio AG, MBe
Calculation items are saved in the project file
70
3.11
FX-Control User Manual
Hardware & Wiring
The central area of FX-Control hosts the Hardware & Wiring view, where you can
establish a virtual 'replica' of the actual test setup,
access the properties of the employed hardware items.
Click on the
button in the Toolbox to activate the Hardware & Wiring view.
Add remotecontrolled device
Click on the 'Scan' button in the Wiring ribbon to show all connected devices that have been
recognized by the controller PC.
Add passive
device
Drag & drop the required item (e.g. speaker, microphone) from the toolbox to the Hardware
& Wiring view
or
Click on the corresponding button in the Ribbon.
Adjust domain of
device
Adjust the domain of an installed FX-AES board (Analog or AES) or 'Generic I/O', 'External
Source' device (Analog or Digital) via the properties.
Delete device
from the view
Right-click on the item and select 'Delete' or press the 'Delete' key on your PC-keyboard.
Arrange items in
the view
Left-click and hold on an item
button.
Link connector to
item
a) Left-click and hold on the first item in the view, move the cursor to the second item and
release the mouse button
Note: only valid connections (e.g. output
input) can be drawn
, move it to the required place and release the mouse
b) Right-click on the connector and select the required Routing
Mute output
connector
Right-click on the generator and select 'Mute On' or activate the mute state in the
Properties.
Route input
connectors
Right-click on an analyzer XLR or BNC connector, or left-click on the small
Amend bias of
input connector
Right-click on the requested input connector and select the requested Bias.
Re-size all items
in the view
arrow.
Use the Zoom slider
NOTE Some settings in the Hardware & Wiring view are mirrored in the Worksheets, i.e. amending them
in either view also has an immediate effect on the other view.
© 2015 NTi Audio AG, MBe
Software
71
Example 1 – A-A setup
Test setup established by FX100 with FX-SIL option installed, external audio amplifier, passive speaker and M2010
measurement microphone
FX100 generator CH 1
linked to Amplifier input
Amplifier output
linked to SIL input CH B
SIL output CH B
linked to speaker pins
SIL shunt resistor
Microphone
linked to FX100 analyzer CH 2 via Inbus 2
linked to FX100 analyzer CH 1
© 2015 NTi Audio AG, MBe
72
FX-Control User Manual
Example 2 – D-A setup
Test setup established by FX100 with FX-AES option installed and generic I/O device (e.g. D/A converter).
FX100 generator CH 1
DUT analog output
Hint
linked via FX-AES board to the DUT
linked to FX100 analog analyzer CH 2
In case of a digital setup, you have to adjust the properties of the FX100 and of the generic I/O device
accordingly.
© 2015 NTi Audio AG, MBe
Software
3.12
73
Worksheets
The WorkArea of FX-Control hosts the Worksheets, where you can
arrange the required generator & analyzer panels,
activate measurement functions,
display the acquired test results.
Click on the
Hint
button in the Toolbox to show the Worksheets.
The WorkArea may be enlarged by adding another sheet (
'Worksheets' ribbon)
click on the 'New Sheet' button in the
Add panel from
the Toolbox
Drag & drop the required panel (e.g. Generator Level Channel1) from the toolbox to the
WorkArea.
Add panel via
the Ribbon
Click on the corresponding button in the 'Results' ribbon and select the required panel.
Delete panel
from the view
Click on the
Move panel
button of the corresponding panel.
Left-click and hold on the item
button.
, move it to the required place and release the mouse
Align panel
First click on the root panel, second on the target panel, and then on the corresponding button
in the 'View' ribbon to align the target panel.
Re-size panel
a) Click on the panel, then on its frame and adjust its size with the mouse.
b) Click on the root panel, then on the target panel, and finally on the corresponding button
in the 'View' ribbon to align the target to the root panel.
Re-size all
panels in the
view
Use the Zoom slider
Arrange panel
Click on the panel and then on the corresponding button in the 'View' ribbon.
Amend test
parameters
Enter the required values directly in the corresponding panel or via the Properties section
NOTE Some settings in the Worksheets are mirrored in the Hardware & Wiring view, i.e. amending them
in either view also has an immediate effect on the other view.
© 2015 NTi Audio AG, MBe
74
FX-Control User Manual
Example
*: select the required panel from the tree, or the list of measurement functions
© 2015 NTi Audio AG, MBe
Software
3.13
75
Properties
All items and panels in the Toolbox, the Hardware view or a Worksheet have individual properties, i.e. adjustable
parameters.
Click on any item in a Toolbox or the WorkArea to show these properties and get access to the editable
parameters.
Example 1
Generator GlideSweep panel and properties
Hints
Click on the
properties.
button in the panel, or on
in the properties section to show all available
The properties section is directly linked to the related panel, i.e. amending a parameter in either
place is amended immediately in the other.
© 2015 NTi Audio AG, MBe
76
FX-Control User Manual
Example 2
GlideSweep frequency response graph and properties
Example 3
Properties of the analyzer board
© 2015 NTi Audio AG, MBe
Software
3.14
Trace
The trace in the lower section of the FX-Control window shows
the full communication between the controller PC and the FX100 Device
Warnings and error messages
© 2015 NTi Audio AG, MBe
77
Part
IV
Generator settings
4
Generator settings
FX100 can be used to generate Meter, StepSweep or GlideSweep test signals.
To get access to the editable properties of the available output channels,
drag & drop the required generator panel(s) to the WorkArea, or
use the generator properties
Numerical values (e.g. level, frequency)
Click on an input box and adjust the value as follows.
Exact value: enter the required value directly via the keyboard (e.g. "0.514" or "8k" etc.)
Stepwise: use the up, down arrow keys or the scroll wheel of your mouse
Measurement Units (e.g. Vp, dBu, dBV)
There are two ways to select the level unit of measurement.
a) Click on the
button and select the required unit
b) Enter the unit directly together with the level (e.g. "320mV" or "-12.5 dBV" etc.)
Connector status (e.g. Mute On/Off, waveform)
Activate or select the required state by clicking on the related
On/Off button (e.g. output channel 1)
button (e.g. channel OutState, StepSweep signal source, frequency spacing etc.)
© 2015 NTi Audio AG, MBe
79
80
FX-Control User Manual
Meter
StepSweep
GlideSweep
© 2015 NTi Audio AG, MBe
Generator settings
4.1
81
Domain
Hint
The property "Domain" is only available if the FX-AES board is installed.
If the generator is switched to digital domain, the domain-specific properties will be displayed in
blue color.
The FX100 generator can be switched to analog or digital domain via the properties in the
Hardware & Wiring or
Worksheets view.
NOTE The generator level and the tolerance limits are handled independently in the analog, digital
domain. If you amend e.g. the digital output level, the previously adjusted analog level will not
be changed.
4.2
Level
The generator level can be adjusted individually on each output channel.
Level & Measurement Unit
The supported level ranges are
0.001...12.430 V
0.0014...17.58 Vp
–60.00...21.89 dBV
–57.00 ...24.90 dBVp
–57.78 ...24.11 dBu
–54.77...27312 dBup
NOTE Discrepancies between the entered level and the displayed value are due to rounding effects.
In case of a PinkNoise or WhiteNoise output signal, please obey the corresponding Crest factors.
Channel On/Off
Click the ON/OFF button to activate or deactivate (i.e. mute) the corresponding output channel.
The default state of generator output channels is OFF
W (weighting active)
If a sweep weighting is active for an output channel, the character "W" appears in the generator level panel.
© 2015 NTi Audio AG, MBe
82
4.3
FX-Control User Manual
Outstate
The generator XLR, BNC output connectors are permanently linked together.
Pin 2 of the XLR is connected to the center pin of the BNC
Pin 3 of the XLR is linked to the BNC shield
Balanced
Standard operating mode for typical Audio circuits.
If XLR pin 2 or 3 are shorted to GND, the FX100 generator will be switched off automatically
Unbalanced
The FX100 generator must be switched to unbalanced mode, if XLR pin 3 or BNC shield is shorted to GND.
The maximum FX100 output voltage in unbalanced mode is +15.9 dBV
NOTE The generator output is switched OFF automatically if XLR pin 2 or BNC pin 1 are shorted to GND.
4.4
Meter
The following generator settings can be adjusted in the Meter mode.
Output Activation
defines when the test signal is
generated
o AlwaysOn
FX100 continuously generates the active
signal, regardless whether a measurement is ongoing or
not
o MeasurementDriven
FX100 only generates the active
signal as long as a measurement is going on
Waveform Mono
o On
both output channels of a FX100 generator
module (1&2 or 3&4) generate the same signal
o Off
every output channel can generate a different
signal (e.g. CH1 with Sine 1 kHz / CH 2 with Sine 3,15
kHz or CH1 with WhiteNoise / CH 2 with Sine 2 kHz)
Waveform Type
o Sine wave
o WhiteNoise 1)
o PinkNoise 2)
Sine Frequency (applies only for Sine signal)
1)
: The WhiteNoise has a Crest factor of 3.646
WhiteNoise RMS level = –8.226 dBV
2)
: The PinkNoise has a Crest factor of 3.846
PinkNoise RMS level = –8.710 dBV
if the Generator output level is adjusted to 0 dBV = 3.01 dBVp, the
if the Generator output level is adjusted to 0 dBV = 3.01 dBVp, the
© 2015 NTi Audio AG, MBe
Generator settings
4.5
83
StepSweep
FX100 supports four different StepSweep modes.
a) Frequency
the frequency of the generated test signal changes according to the user settings, while the signal
amplitude remains fixed
b) Amplitude
the level of the generated sine wave changes according to the user settings, while the signal
frequency remains fixed
c) Time
the measurements are acquired over a user-defined time period
d) Table
a sequence of isolated test signals with individual levels & frequencies is generated according to the
user settings
NOTE Some sweep parameters are only accessible via the Generator properties, if the analyzer
synchronization source is switched to 'Generator'.
Otherwise, for example in case of an external sweep analysis, these parameters must be defined
via the Analyzer properties.
If you switch from one StepSweep mode to another, all tolerance limits of active measurement
functions are deleted
Frequency sweep
The frequency of the generated sine signal is swept in equidistant steps over a user-defined frequency range.
Examples of generated logarithmic, linear frequency sweep test signals
© 2015 NTi Audio AG, MBe
84
FX-Control User Manual
Waveform
Type
supported StepSweep test signal (i.e.Sine)
Sine
Fadein
Source
duration of generator fade-in before the sweep starts
Frequency
Frequency
Spacing
o Linear
the generated frequencies are distributed linearly over
the X-axis
o Logarithmic
the generated frequencies are distributed
logarithmically over the X-axis
o R10, R20, R40, R80
the generated frequencies are distributed
according to the ISO-standard over the X-axis
Start
start frequency of the generated StepSweep (e.g. 20 Hz;
Start frequency may be > Stop frequency)
Stop
end frequency of the generated StepSweep (e.g. 20 kHz;
Stop frequency may be > Start frequency)
Points
number of generated frequencies between the start, stop
frequencies
Start Tone On
a 1 kHz start tone with fixed duration of 1 second is
generated prior to the StepSweep execution
Weighting
An individual weighting of the generated frequency sweep signal can be
applied to each channel. It is possible, for example, to equalize the
generator output, or to apply a user-defined amplitude profile. In either
case, the equidistant frequency sweep steps are not affected.
YAxisUnit
o Linear
the generated signal level between StepSweep points
is interpolated linearly
o Logarithmic
the generated signal level between StepSweep
points is interpolated logarithmically
Amplitude equalization
o Enable
activates the generator equalization
o Data View
shows the current values of the generator equalization file
o Data Copy
copies the contents of the generator equalization file to the clipboard
o Data Paste
pastes the clipboard contents to the generator equalization file
Amplitude profile (see below)
o Enable
activates the amplitude profile feature
o Data Edit...
o Data Copy
o Data Paste
opens a graph with the current amplitude profile
copies the numerical values of the current profile to the clipboard
pastes the numerical data from the clipboard to the profile
o Superposed View...
Hints
shows current amplitude profile values and curve
The frequency sweep analyzer parameters have to be defined via the Analyzer StepSweep
properties. The required StepSweep measurements have to be activated separately. If an externallygenerated frequency sweep is being analyzed, it is recommended to mute the FX100 output
channels
© 2015 NTi Audio AG, MBe
Generator settings
Amplitude sweep
The level of the generated sine signal is swept in equidistant steps over a user-defined level range.
Examples of generated amplitude sweep test signals (linear spacing)
© 2015 NTi Audio AG, MBe
85
86
FX-Control User Manual
Waveform
Type
supported StepSweep test signal (i.e.Sine)
Sine
Frequency
the user-defined frequency of the generated sine wave
Fadein
duration of generator fade-in before the sweep starts
Source
Amplitude
Amplitude
Start
start level of the StepSweep (e.g. -20 dBV; Start amplitude
may be > Stop amplitude)
Stop
end level of the StepSweep (e.g. +10 dBV; Stop amplitude
may be > Start amplitude)
Points
number of measurements between the start and stop
amplitudes
Spacing
o Linear
the generated sweep level steps are distributed linearly
(standard application)
o Logarithmic
the generated sweep level steps are distributed
logarithmically (only used if level is expressed in V or Vp)
Start Tone On
a 1 kHz start tone with fixed duration of 1 second is
generated prior to the StepSweep execution
Hints
The amplitude sweep analyzer parameters have to be
defined via the Analyzer StepSweep properties
The required StepSweep measurements have to be
activated separately
If an externally-generated amplitude sweep is being
analyzed, it is recommended to mute the FX100 output
channels
© 2015 NTi Audio AG, MBe
Generator settings
Time sweep
FX100 records the active measurement(s) over time, during which an optional test signal may be generated
Example of generated test signal during a time sweep
© 2015 NTi Audio AG, MBe
87
88
FX-Control User Manual
Waveform
Type
supported StepSweep test signal (i.e.Sine)
Sine
Frequency
frequency of the generated sine wave
Fadein
duration of generator fade-in before the sweep starts
Source
Time
Start Tone On
a 1 kHz start tone with fixed duration of 1 second is
generated prior to the StepSweep execution
Hints
If the time sweep is to be executed without generating a
signal, simply mute the FX100 output channels
The time sweep analyzer parameters have to be defined via
the Analyzer StepSweep properties
The required StepSweep measurements have to be
activated separately
© 2015 NTi Audio AG, MBe
Generator settings
Table sweep
The level and frequency of the generated sine signal follow a user-defined table.
Example of generated table sweep test signal
© 2015 NTi Audio AG, MBe
89
90
FX-Control User Manual
Waveform
Type
supported StepSweep test signal (i.e.Sine)
Sine
Fadein
Source
duration of generator fade-in before the sweep starts
Table
Table-Set
Edit Data
opens the panel that allows the definition of the table
sweep frequency / amplitude values
Unit Y
select the measurement unit for the level values
To ... Convert
this button changes the level measurement unit
in which the table is expressed
Add
enter the required frequency & level and click on the
'Add' button to add a new point to the table
moves the corresponding line upwards by one position
within the table
moves the corresponding line downwards by one position
within the table
deletes the corresponding line from the table
Hint
The table values may be defined in any order (i.e. rising
and/or decreasing)
o Copy Data
copies the contents of the current table into the
clipboard (minimum "V" and "Hz")
o Paste Data
pastes the contents of the clipboard to the table
(thus it is possible to import the table values from an existing
file)
Start Tone On
a 1 kHz start tone with fixed duration of 1 sec. is
generated prior to the StepSweep execution
Hints
The analyzer sweep parameters have to be defined via the Analyzer StepSweep properties
The required StepSweep measurements have to be activated separately
© 2015 NTi Audio AG, MBe
Generator settings
91
Amplitude profile
The StepSweep amplitude profile can be displayed and edited in two different ways.
a)
Graphical editing
a) Enable the amplitude profile for the requested generator channel via the
Generator StepSweep properties.
b) Click on the "Edit..." button to open the "StepSweep Edit Profile Data"
panel.
c) Right-click on the graph and select "Add Point...", then place the cursor at
the required level / frequency value, and confirm with a left-click.
d) Amend the level, frequency of a profile point by left-clicking, holding on it
and moving it to the desired position.
e) Click on the "Normalize" button to make sure that the level of the highest
point(s) in the profile equals 100%.
f) Click on the "OK" button to confirm the current profile & close the panel.
Hint
b)
Please observe the aforementioned StepSweep amplitude profile
definition.
Numerical editing
a) Enable the amplitude profile for the requested generator channel via the
generator StepSweep properties.
b) Click on the "Edit..." button to open the "StepSweep Edit Profile Data"
panel.
c) Right-click on the graph and select "Edit Data..." to open the "Edit Profile
Data" panel.
d) Enter the numerical frequency & attenuation of a profile point and click on
the "Add" button (click on the "Convert" button to toggle the attenuation
between % or dB).
e) Amend the level or attenuation of a point by clicking on the corresponding
input box.
f) Delete a point by clicking on the corresponding
button.
g) Click on the "Normalize" button to make sure that the level of the highest
point(s) in the profile equals 100%.
h) Click on the "OK" button to confirm the current profile & close the panel.
Hint
© 2015 NTi Audio AG, MBe
Please observe the aforementioned StepSweep amplitude profile
definition.
92
c)
FX-Control User Manual
View profile
Click on the "Superposed View..." button to show the currently active amplitude profile numerically and graphically.
© 2015 NTi Audio AG, MBe
Generator settings
4.6
93
GlideSweep
FX100 supports the generation of either logarithmic or linear chirps, whereby a sine wave sweeps continuously over
a frequency range.
NOTE Only PureSound analysis, and not level, distortion etc. measurements are possible with Linear
GlideSweep transmission
Examples of generated logarithmic, linear GlideSweep test signals
© 2015 NTi Audio AG, MBe
94
FX-Control User Manual
Generator properties
Bandwidth
The bandwidth of the FX100 analyzer can be limited to 20 kHz in order to
prolong the maximum GlideSweep duration.
20kHz
80kHz
max. 40 seconds GlideSweep duration
max. 10 seconds GlideSweep duration
Frequency
Spacing
o Linear
the rate at which the sweep moves over the frequency axis is
linear (NOTE: level or distortion measurements are not possible with
linear GlideSweep transmission)
o Logarithmic
the rate at which the sweep moves over the frequency
axis is logarithmic
Start
start frequency of GlideSweep (must be < stop frequency)
Stop
stop frequency of GlideSweep (must be > start frequency)
NOTE The difference between the Start
Stop frequency must be
greater than 1/3rd octave. Please observe also chapter
"GlideSweep artifacts".
Fade-In
user-defined duration of a special signal that precedes every
GlideSweep
Length
user-defined duration of the GlideSweep
Fade-Out
Total Length
duration of the terminating signal (not editable)
overall duration of Fadein + Length + Fadeout (not editable)
Max Length
maximum possible length of the GlideSweep (depends on
start, stop frequencies; not editable)
Highest Harmonic
uppermost harmonic that can be measured (depends
on start, stop frequencies; not editable)
Hint
The Fade-In signal duration should be about 5 x 1/fStart (e.g. fStart = 20 Hz
Fade-In = 0.25 s)
External
Export
click on the "Generate..." button to generate a wav or mp3 file with the current GlideSweep (see below)
© 2015 NTi Audio AG, MBe
Generator settings
95
Weighting
An individual weighting of the generated GlideSweep signal can be applied to each channel. It allows you, for
instance, to equalize the generator output, or to apply a user-defined amplitude profile. In either case, neither the
GlideSweep spacing nor duration are affected.
YAxisUnit
o Linear
the generated signal level between GlideSweep points is interpolated linearly
o Logarithmic
the generated signal level between GlideSweep points is interpolated logarithmically
Amplitude equalization
o Enable
activates the generator equalization
o Data View
shows the current values of the generator equalization file
o Data Copy
copies the contents of the generator equalization file to the clipboard
o Data Paste
pastes the clipboard contents to the generator equalization file
Amplitude profile (see below)
o Enable
activates the amplitude profile feature
o Data Edit...
o Data Copy
o Data Paste
opens a graph with the current amplitude profile
copies the numerical values of the current profile to the clipboard
pastes the numerical data from the clipboard to the profile
o Superposed View...
Hints
shows the superposed amplitude equalization + profile weightings.
The GlideSweep analyzer parameters have to be defined via the corresponding analyzer properties;
the required GlideSweep measurements have to be activated separately. Mute the FX100 output
channels if an externally-generated GlideSweep is being analyzed.
GlideSweep artifacts
Due to the nature of the GlideSweep measurement, artifacts can occur in the low-frequency region. These artifacts
become noticeable in the form of increased THD (i.e. harmonic distortions) measurement results. The amount of
these artifacts and the affected frequencies depend on the particular GlideSweep parameters.
The same limitation applies also for acoustical measurements, where the low frequency noise can interfere with the
synchronization. This can also result in measurement errors.
Distortion artifacts in low-frequency GlideSweep region
Since the artifacts can degrade the accuracy of a THD, distortion measurement, it is advised to apply a minimum
GlideSweep Length (i.e. duration), which depends on the Start frequency that has to be measured.
© 2015 NTi Audio AG, MBe
96
FX-Control User Manual
The relation between Glidesweep Start frequency and Length is shown by the following curve. Any setting below the
red line may show artifacts and should therefore be avoided.
Critical area of GlideSweep Start frequency / Length settings
In addition to the aforementioned effects, the GlideSweep analysis is sensitive to DC offset voltages at the analyzer
inputs. Such offset voltages may come e.g. from the DUT, but also occur after switching from a different
measurement mode (e.g. Meter or StepSweep) or after changing the input range.
The impact of this sensitivity can be minimized by following measures:
Allow enough time between switching the FX100 from Meter or StepSweep mode to GlideSweep analysis.
Adjust the input range and the GlideSweep range to the same value.
Increase the duration of the Fade-In.
© 2015 NTi Audio AG, MBe
Generator settings
97
Amplitude profile
The GlideSweep amplitude profile can be displayed or edited in two different ways.
NOTE Please observe the following restrictions
The number of transitions in a GlideSweep amplitude profile is limited to six (6).
Every transition is automatically smoothed by the system.
If a transition gets too steep, it will be shown as a dotted line together with the message
"Invalid Transitions".
a)
Graphical editing
a) Enable the amplitude profile for the requested generator channel via the
generator GlideSweep properties.
b) Click on the "Edit..." button to open the "GlideSweep Edit Profile Data"
panel. The top line of the panel shows the GlideSweep parameters that
may be amended, e.g. if required due to the amplitude profile restrictions.
c) Right-click on the graph and select "Add Point...", then place the cursor
at the required level / frequency value, and confirm with a left-click.
d) Amend the level, frequency of a profile point by left-clicking, holding on it and moving it to the desired position.
e) Click on the "Normalize" button to make sure that the level of the highest point(s) in the profile equals 100%.
f)
Click on the "OK" button to confirm the current profile & close the panel.
Hint
b)
Please observe the aforementioned GlideSweep amplitude profile definition.
Numerical editing
a) Enable the amplitude profile for the requested generator channel via the
generator GlideSweep properties.
b) Click on the "Edit..." button to open the "GlideSweep Edit Profile Data"
panel.
c) Right-click on the graph and select "Edit Data..." to open the "Edit Profile
Data" panel.
d) Enter the numerical frequency & attenuation of a profile point and click on
the "Add" button (click on the "Convert" button to toggle the attenuation
between % or dB).
e) Amend the level or attenuation of a point by clicking on the corresponding
input box.
f)
Delete a point by clicking on the corresponding
button.
g) Click on the "Normalize" button to make sure that the level of the highest point(s) in the profile equals 100%.
h) Click on the "OK" button to confirm the current profile & close the panel.
Hint
c)
Please observe the aforementioned GlideSweep amplitude profile definition.
View profile
Click on the "Superposed View..." button to show the actual amplitude profile numerically and graphically.
© 2015 NTi Audio AG, MBe
98
FX-Control User Manual
Export GlideSweep
FX-Control allows to export the current GlideSweep, i.e. to create a wav or mp3 file of the GlideSweep. This file can
then be replayed by an external device, and analyzed by FX100.
The spacing of the exported GlideSweep can be linear or logarithmic
The GlideSweep is always exported WITHOUT any weighting.
The GlideSweep sound file always starts with a fixed header that allows the FX100 analyzer to trigger &
synchronize correctly to the incoming signal.
NOTE It is essential that the GlideSweep generator parameters of the analyzing FX100 are identical to
those of the externally replayed GlideSweep signal.
File Type
demands.
select 'Wav' (recommended) or 'Mp3' format according to your
File Name
FX-Control automatically proposes a file name in the default
directory (can be edited).
Attenuation
0 dB)
output level attenuation of the generated GlideSweep (–80 dB to
Output Channel
the sound file can be generated with the GlideSweep on
o Mono (1-chn signal)
o Stereo Both (2-chn signal)
o Stereo Left (2-chn signal, but right channel muted)
o Stereo Right (2-chn signal, but left channel muted)
Sample Rate
select the sample rate of the GlideSweep sound file fitting to
the replay device.
Bits per Sample
resolution (8, 16 or 24 bits) of the generated GlideSweep.
Click on the 'Generate' button to create & save the GlideSweep sound file.
© 2015 NTi Audio AG, MBe
Generator settings
4.7
99
Weighting
The term 'weighting' refers to the ability of FX100 to shape the level vs. frequency of a generated StepSweep or
GlideSweep. There are two different weighting types for the following applications,
a) Amplitude equalization
The amplitude equalization compensates, e.g. the characteristics of an external amplifier, thus resulting in a flat
frequency response at the speak er input pins (refer to regulators, generator equalization)
b) Amplitude profile
Amplitude profiles are used to drive a transducer at its maximum allowed level over the frequency range (refer to
chapters StepSweep, GlideSweep amplitude profile)
© 2015 NTi Audio AG, MBe
Part
V
Analyzer settings
5
101
Analyzer settings
FX100 is able to analyze internally or externally generated Meter, StepSweep or GlideSweep test signals.
Hint
In case of external signal analysis, special attention must be paid to properly synchronizing the
analyzer
To get access to the editable properties of the available input channels,
drag & drop the required analyzer panels to the WorkArea, or
use the analyzer properties
Numerical values (e.g. input range, mic sensitivity, start/
stop frequencies)
Click on an input box and adjust the value as follows.
Exact value: enter the required value directly via the keyboard (e.g.
"0.514" or "8k" etc.)
Stepwise: use the up, down arrow keys or the scroll wheel of your
mouse
Measurement Units (e.g. Vp, dBu, dBV)
There are two ways to select the level measurement unit.
1. Click on the
button and select the required unit
2. Enter the unit directly together with the level (e.g. "320mV" or "-12.5
dBVp" etc.)
States (e.g. coupling, bias, filter)
Click on the
© 2015 NTi Audio AG, MBe
button and select the required state.
102
FX-Control User Manual
5.1
Domain
Hint
The property "Domain" is only available if the FX-AES board is installed.
If the analyzer is switched to digital domain, the domain-specific properties will be displayed in blue
color.
The FX100 analyzer can be switched to analog or digital domain via the properties in the
Hardware & Wiring or
Worksheets view.
NOTE The analyzer reference dBr and the tolerance limits are handled independently in the analog,
digital domain. If you amend e.g. the digital reference level, the previously adjusted analog
reference level will not be changed.
5.2
Range (Meter, StepSweep)
The input range represents the 'sensitivity' of the FX100 analyzer.
Proper adjustment of the input range is essential to
avoid clipping, and
ensure accurate measurement results.
Automated ranging
Manual range
Auto ranging is recommended if the input signal level is
unknown prior to the measurement.
Manual ranging is recommended
In this mode, a special circuit in FX100
continuously monitors the input signal level (i.e. also
during the measurement),
automatically adapts the analyzer sensitivity.
if the input signal shows a rapidly changing level, and/
or
to speed up the measurement.
The operator has to manually enter an appropriate
analyzer range prior to the measurement.
The input range must be defined in terms of a peak
measurement unit, i.e. Vp, dBVp or dBup
NOTE The input range is divided in fixed stages, i.e. a manually-entered value may be rounded to the
next higher stage.
The GlideSweep input range must be adjusted separately
© 2015 NTi Audio AG, MBe
Analyzer settings
5.3
103
GlideSweep range
Proper adjustment of the GlideSweep range (i.e. the 'sensitivity' of the FX100 analyzer) is essential to
avoid clipping, and
ensure accurate measurement results.
The GlideSweep range must be adjusted prior to the signal acquisition, either
manually by entering an appropriate range, or
automatically via the 'GlideSweep Range' regulator
5.4
Coupling
The FX100 input stage is AC-coupled by
default, i.e. any DC signal component
(e.g. Phantom power) that is present at
the input connector will be filtered out.
Alternatively, the DC-coupling can be
activated, so that a DC-offset at the input
connectors will also go into the
measurement result.
Hint
If the input is AC-coupled, a change of the bias to/from 48 V, 2 V or ICP* may cause that the analyzer
input capacitor gets charged, which may take some time. In this case, the FX100 analyzer detects the
charging process and applies a 1.2 s timeout in order to ensure a stable input signal and thus correct
measurement result. Consequently, the overall measuring speed may be compromized in
applications where the input connectors are repeatedly switched between different bias settings.
*: ICP® is a registered trademark of PCB Piezotronics
© 2015 NTi Audio AG, MBe
104
5.5
FX-Control User Manual
Bias
The term 'Bias' stands for an optional offset voltage or current that is applied to an input connector.
With the FX100 it is possible to activate different types of bias on input channels.
Off
No bias (default)
2V
Phantom power for 2 V microphones
48 V
Phantom power for 48 V microphones
DCR 5k range
the analyzer generates a 1.6 mA current to measure the output impedance of the
DUT (Device Under Test) (up to 5 k )
DCR 100k range
the analyzer generates a 100 A current to measure the output impedance of the
DUT (up to 100 k )
ICP*
constant current microphone power supply (4 mA)
NOTE As soon as a microphone is added to the Hardware & Wiring and connected to an FX100 input
the bias of the corresponding channel is only accessible via the microphone properties in the
Hardware & Wiring view.
Hint
If the input is AC-coupled, a change of the bias to/from 48 V, 2 V or ICP* may cause that the analyzer
input capacitor gets charged, which may take some time. In this case, the FX100 analyzer detects the
charging process and applies a 1.2 s timeout in order to ensure a stable input signal and thus correct
measurement result. Consequently, the overall measuring speed may be compromized in
applications where the input connectors are repeatedly switched between different bias settings.
*: ICP® is a registered trademark of PCB Piezotronics
5.6
Microphone sensitivity
The sensitivity of any microphone that is connected to an FX100 input must be entered properly to ensure correct
measurements.
The microphone sensitivity is expressed either in [mV/Pa] or [dBV/Pa], and can be edited in the properties section
of the Hardware & Wiring view or the Worksheets.
© 2015 NTi Audio AG, MBe
Analyzer settings
5.7
105
Reference dBr
The panel allows to manually enter the reference value for the dBr level, distortion measurements.
Supported measurement units and ranges of the reference value
Volt: 0.0001 V .... 10 MV
dBV: -200...+200 dBV
dBPa: (range depends on microphone sensitivity)
dBSPL: (range depends on microphone sensitivity)
dBu: -197.8...202.2 dBu
Hint
5.8
Alternatively, you may press Ctrl + 1 (or 2) or right-click on the Meter.Level panel in order to assign
the actual input level of channel 1 or 2 as the new reference level.
Reference frequency
Enter the reference value for frequency measurements expressed in ppmr.
The reference frequency is freely adjustable from 5 Hz to 80 kHz.
Hint
Please refer also to the calculation item "Sample Rate Deviation".
© 2015 NTi Audio AG, MBe
106
5.9
FX-Control User Manual
Filter
FX100 features a number of frequency weightings and filters.
Weighting
HighPass filter
LowPass filter
A-weighting
10 Hz
3.4 kHz
C-weighting
22.4 Hz
8 kHz
100 Hz
15 kHz
300 Hz
20 kHz brickwall (AES17)
400Hz
22.4 kHz
40 kHz
A-weighting
C-weighting
© 2015 NTi Audio AG, MBe
Analyzer settings
HighPass 10 Hz
HighPass 22.4 Hz
HighPass 100 Hz
© 2015 NTi Audio AG, MBe
107
108
FX-Control User Manual
HighPass 300 Hz
HighPass 400 Hz
LowPass 3.4 kHz
© 2015 NTi Audio AG, MBe
Analyzer settings
LowPass 8 kHz
LowPass 15 kHz
LowPass 20 kHz brickwall
© 2015 NTi Audio AG, MBe
109
110
FX-Control User Manual
LowPass 22.4 kHz
LowPass 40 kHz
© 2015 NTi Audio AG, MBe
Analyzer settings
5.10
111
Synchronization
FX100 supports the analysis of internally or externally generated signals. In both cases, the analyzer and the test
signal generator must be synchronized properly.
The synchronization can be adjusted individually for Meter and StepSweep analysis via the Analyzer properties.
Internal
External
The analyzer is directly synchronized to the FX100
generator frequency.
The FX100 analyzer synchronizes automatically to the
incoming signal.
This mode allows maximum measurement speed
without compromising accuracy.
This mode supports applications where the test signal
is generated by an external device.
NOTE If the synchronization source is set to 'Generator', some sweep parameters have to be defined via
the Generator properties.
If the synchronization source is set to 'External', also the Analyzer properties must be adjusted
(see chapter 'Application hints
External signal analysis').
5.11
Meter
The Meter analysis is either synchronized to
source generator or
external signal source (i.e. dominant frequency of the incoming signal)
© 2015 NTi Audio AG, MBe
112
5.12
FX-Control User Manual
StepSweep
FX100 supports four different StepSweep modes.
a) Frequency
the frequency of the generated test signal changes according to the user settings, while the signal
amplitude remains constant
b) Amplitude
the level of the generated sine wave changes according to the user settings, while the signal
frequency remains constant
c) Time
the measurements are acquired over a user-defined time period
d) Table
a sequence of isolated test signals with individual levels & frequencies is generated according to the
user settings
NOTE If the synchronization source is switched to 'External', some StepSweep parameters are only
accessible via the Analyzer properties.
Otherwise, i.e. in case of an internal sweep analysis, these parameters must be defined via the
Generator properties.
NOTE If a noise level vs. frequency is to be measured, the analyzer synchronization must be switched to
'Generator' and the acquisition to 'Wideband'.
Synchronization
Source
o Generator
the analyzer StepSweep acquisition is controlled
by the generator
o External
the FX100 analyzer synchronizes to an external
signal source (i.e. the frequency of the dominant input signal)
External Sweep (only accessible with synchronization source
'External')
Sense Channel
active input channel
Freq. Spacing
minimum frequency difference that is required to be
accepted as a new step
Timeout
the data acquisition is automatically aborted, if no stable
sine signal step of an externally generated StepSweep is received
within this period (max. 120 sec.)
Acquisition (only accessible with synchronization source 'Generator')
o Wideband
the analyzes looks for the dominant frequency in
the incoming signal, regardless of the actual generated sweep
frequency
o GenTrack
the analyzer is directly linked to the FX100
generator, and thus measures only the actual sweep frequency
Type
Frequency, Amplitude, Time or Table (see above)
Frequency (only accessible with synchronization source 'External')
Start
start frequency of the incoming StepSweep (e.g. 20 Hz; Start frequency may be > Stop frequency)
Stop
end frequency of the incoming StepSweep (e.g. 20 kHz; Stop frequency may be > Start frequency)
Hint
In case of an externally generated StepSweep, the step duration depends on the start frequency.
Start frequency 10 Hz
1 second step duration
0.5 second step duration
© 2015 NTi Audio AG, MBe
Analyzer settings
113
Amplitude (only accessible with synchronization source 'External')
Start
start level of the StepSweep (e.g. -20 dBV; Start amplitude
may be > Stop amplitude)
Stop
end level of the StepSweep (e.g. +10 dBV; Stop amplitude
may be > Start amplitude
Time (only accessible with synchronization source 'External')
Duration
recording time period, expressed in seconds
Points
number of measurements, which are equally distributed
over the recording period
Table
definition of Table sweep parameters is only accessible via
the Generator properties
© 2015 NTi Audio AG, MBe
114
FX-Control User Manual
5.13
GlideSweep
FX100 supports the analysis of either logarithmic or linear chirps, whereby a sine wave sweeps continuously over a
frequency range.
NOTE Only PureSound analysis, but not level, distortion etc. measurements are available in Linear
GlideSweep transmission
Synchronization
Source
select the signal source for the GlideSweep analysis
o Generator
the FX100 analyzer triggers to and analyzes the internally generated
GlideSweep
o External
the FX100 analyzer triggers to and analyzes an externally generated
GlideSweep
External Sweep
Sense Channel
if the synchronization is set to "External", you can select an active
input channel that shall trigger to the incoming GlideSweep signal
NOTE Make sure the sense channel is active, i.e. routed correctly in the
Hardware & Wiring view
Sample Rate Adjust
the FX100 analyzer synchronizes to the sample rate of the
incoming GlideSweep
Timeout
time period (max. 120 sec.), after which the data acquisition is
automatically aborted if no external GlideSweep signal is received
Bandwidth
o 20kHz
o 80kHz
Points
the analyzer bandwidth has an impact on the max. GlideSweep duration
max. 40 seconds GlideSweep duration
max. 10 seconds GlideSweep duration
resolution of the GlideSweep analysis (max. 500 points)
Highest harmonic
read-only indicator for the highest measurable harmonic (depends
mainly on the GlideSweep start, stop frequency)
PureSound
Analysis Range
Points
PureSound filter bank (refer to measurement function 'PureSound')
resolution of the steepness analysis (max. 500 points)
Max Runs
the number of times the PureSound test is repeated if the measurement results exceed the
tolerance limits. The system then compares the data of the executed cycles to eliminate all non-recurring peaks
(e.g stochastic ambient noise), and thus considers only systematic events (refer to measurement function
'PureSound').
NOTE The 'Max Runs' feature is only available in the synchronization mode 'Generator'
Time Window
The time window allows to limit the impulse response measurement, in order to exclude the impact of room
reflections on the frequency response. The reflections that occur in a reverberant room can thus be filtered out by
limiting the acquired impulse response of the system.
Position
Hint
end point of the time window, expressed in milliseconds [ms] or meters [m] or feet [ft]
The conversion distance
'Advanced
General'
Active Channels
Adjust
time refers to the ambient temperature that is defined via the toolbar
enable or disable the time window for the corresponding analyzer channel(s)
click on this button to open the panel "Adjust Time Window"
© 2015 NTi Audio AG, MBe
Analyzer settings
115
Adjust Time Window
The panel contains two graphs,
i. the ETC or Impulse response graph with the adjustable end point of the time window (vertical red bar)
ii. the Level curve, i.e. the frequency response that represents the impact of the impulse response time window
In other words, if the time window end point is moved within the ETC or Impulse response graph, the system directly
shows the impact on the frequency response measurement.
Settings
Measure
select the display mode
o ETC (Energy-Time Curve)
envelope of the rectified impulse in logarithmic
scale
o Impulse
display of the calculated Impulse Response curve in linear scale
Unit
supported units of the ETC (logarithmic) or Impulse response (linear) display
modes.
Channel
active channel
Position
enter the end point of the time window, expressed in ms (milliseconds)
Hint
To adjust the time window / vertical bar, right-click on the graph or
numerically enter the position in [ms].
Active
enable or disable the time window
Start, Stop
Hint
define the zoom range of the ETC or impulse response graph
Use the mouse on the graph to directly zoom in.
Default Start Stop
undo the zoom = reset the Start / Stop time to their default
values (i.e. –30 ms / 100 ms)
Level Unit
supported units for the Level measurement (linear or logarithmic)
Control elements
"Acquire" button
"Abort" button
starts a measurement cycle (including signal acquisition)
aborts the ongoing measurement cycle
Delay
the measured time delay from the signal source to the sensor (i.e.
microphone)
Distance
the calculated distance between the sound source (loudspeaker) and
the microphone
"OK", "Cancel" buttons
confirm or ignore the amendments ("OK"
applies the
settings Position, Active, Level Unit and ETC or Impulse response Unit).
Example
The following two screenshots show the "Adjust Time Window" with an acquired measurement; the impact of
placing the time window end point in front of the first reflections becomes clearly visible in the frequency response
curve (less ripple).
© 2015 NTi Audio AG, MBe
116
FX-Control User Manual
Time window end point at default position (i.e. @ 100 ms)
Time window end point placed in front of the first reflection (i.e. @ 12 ms)
Hint
The grey bar in the low-frequency range of the Level graph indicates that the corresponding results
become uncertain due to the time windowing.
© 2015 NTi Audio AG, MBe
Analyzer settings
Time window type
The time window implemented on the FX100 is a "Tukey Window 10% Taper"
Time window "Tuk ey Window 10% Taper"
© 2015 NTi Audio AG, MBe
117
Part
VI
Digital
6
119
Digital
The branch 'Digital' in the toolbox is only available if the FX-AES board is installed in the FX100. It provides access
to the installed digital audio option.
6.1
AES
The FX-AES board supports the generation & analysis of digital audio signals according to the AES-3ID standard.
Settings
basic settings of the digital generator, analyzer
Carrier status
carrier status, error flags and active bits monitor
Channel status
Sync status
Hint
6.1.1
channel states of the generator (editable) and analyzer (monitor only)
carrier status of the Sync Ref. Input
For more technical details or background information, please refer to the AES-3ID standard http://
tech.ebu.ch/docs/tech/tech3250.pdf
Settings
The AES settings define the physical state of the digital audio signal.
Output
Carrier active On / Off
the digital audio signal is generated / not generated
Sample rate
Source
o Internal
the generator clock is created internally
o AESInputRecovered
the generator synchronizes to the clock of the incoming
signal source
o SyncInput
the generator synchronizes to the clock of the Sync Ref. Input
Frequency
the sampling rate of the digital audio signal can be adjusted to
o a standardized frequency (32, 44.1, 48, 88.2, 96, 176.4, 192 kHz) or
o any user-defined frequency in the range from 28 to 220 kHz
BNC carrier
o AES-3ID
o SPDIF
Word length
the physical signal level (Voltage) of the generator output = 1.2 Vpp
the physical signal level (Voltage) of the generator output = 0.6 Vpp
selectable 16, 18, 20, 24 bits
Send invalid Off / On
© 2015 NTi Audio AG, MBe
the status of the generated digital audio signal is valid / invalid
120
FX-Control User Manual
Input
Connector
o XLR
the analyzer is linked to the XLR input connector
o BNC
the analyzer is linked to the BNC input connector
o Optical
the analyzer is linked to the TOSLINK input connector
o AES Output Monitor
Impedance
o 110 Ohm
o 75 Ohm
o Hi-Z
the analyzer is internally linked to the generator output
impedance of input connectors 110
impedance of input connectors 75
impedance of input connectors >10 k
Indicate OV at x smpl
if an overflow (OV) occurs in the digital audio signal, the active measurement panel(s)
will indicate this event as soon as the overflow exceeds the user-defined number of samples
Sync input
Impedance
Hi-Z
impedance of Sync Ref. Input connector >10 k
75 Ohm
6.1.2
impedance of Sync Ref. Input connector 75
Carrier status
The AES carrier status provides information on the correctness of the digital audio data transmission.
Carrier
Sync
LED indicates whether the analyzer is synchronized to the input signal
Sample rate
indicates the detected sampling rate, e.g.
o standardized frequencies
32, 44.1, 48, 88.2, 96, 176.4, 193 kHz or
o customized sampling rate
"No standard SR"
Error flags
Coding
LED indicates that a bi-phase error has occurred and the data sampled from the
biphase stream may not be correct
Parity
LED illuminates if the digital audio data was received with odd parity, which
indicates a potential transmission error
Invalid CH1/2
invalid
LEDs indicate that the digital audio signal of the corresponding channel is
Active bits
LEDs represent the active bits of the embedded audio signal (e.g. 18 bit)
© 2015 NTi Audio AG, MBe
Digital
6.1.3
121
Channel status
The AES channel status carries information associated with the digital audio data.
The FX-AES board allows to
edit the channel status of the generated signal (settings apply simultaneously on both output channels)
analyze the channel status of the received signal (independent analysis of the two input channels)
Mode
Consumer or Professional
Consumer mode
Audio Mode
Audio or Data
Copyright
active or inactive
Emphasis
inactive or 50/15 s
Category code
list of typical devices
Source number
Don't care or #1...15
Channel number
Don't care or A+B
Max Audio word length
Max. 20 or 24 bits
Audio word length
NotIndicated or 16 / 17 / 18 / 19 / 20 bits
Sample frequency
kHz
NotIndicated or 22.05 / 24 / 32 / 44.1 / 48 / 88.2 / 96 / 176.4 / 192
Hint
The indicated sample frequency does not have to match the actual sample
rate
Clock accuracy
Level I / Level II / Level III / Reserved
Professional mode
Audio Mode
Normal or NonAudio
Emphasis
o NotIndicated
o None
o 50/15 s
o CCITT J-17
Frequency Mode
Locked or Unlocked
Sample frequency
Hint
NotIndicated or 22.05 / 24 / 32 / 44.1 / 48 / 88.2 / 96 / 176.4 / 192 kHz
The indicated sample frequency does not have to match the actual sample rate
Scaling
NoScaling or 1 / 1.001
Channel mode
list of typical modes
User Bits
o NotIndicated
o 192-bit clock
o Reserved
o User Defined
Auxiliary Bits
o Max. 20-bit, not defined
o Max. 24-bit main audio
o Max. 20-bit single coord
o Reserved
© 2015 NTi Audio AG, MBe
122
FX-Control User Manual
Audio word length
NotIndicated or 16 / 17 / 18 / 19 / 20 bits
Reference Signal
o Not a ref. signal
o Grade 1
o Grade 2
o Reserved
CRC Valid
6.1.4
Valid or Invalid
Sync input status
The AES sync input status refers to the incoming clock signal of the Sync Ref. Input.
Carrier
o Sync
LED illuminates if the FX-AES generator is synchronized to the external clock
o Sample rate
Flags
o Audio
o Video
if the external clock has a standardized sample rate, it is shown here
LED illuminates in case of an AES-3ID clock
LED illuminates in case of a black-burst video clock (PAL or NTSC)
© 2015 NTi Audio AG, MBe
Part
VII
124
FX-Control User Manual
7
Regulators, equalization
The 'Regulator' is used to execute iterative procedures that optimize specific settings, e.g.
Generator level
adjusts the FX100 output volume so that the feedback line shows the user-defined level or THD
GlideSweep range
optimizes the FX100 analyzer input range for the transmitted GlideSweep signal
Generator equalization
response
Sensitivity calibration
weights the generated test signal so that the feedback line shows a flat frequency
determines the sensitivity [mV/Pa] of a connected microphone
Every regulator application requires a feedback line to the FX100 analyzer.
The feedback line can, but does not have to, be identical to the connection between DUT (Device Under Test) and
FX100.
Example 1: Generator level
A temporary feedback line to the FX100 analyzer
allows adjustment of the generator level so that
the driving voltage for the DUT reaches the
required level
Hint
Example 2: Generator equalization
A temporary feedback line from the amplifier output to the
FX100 analyzer input allows equalization of the FX100
generator output signal, whereas the microphone signal is
measured in the final application
The acquired regulator data can be kept by saving it in a project (together with the current system
settings).
© 2015 NTi Audio AG, MBe
Regulators, equalization
7.1
125
Generator level
The generator level regulator is used to adjust the FX100 output volume so that either the
level or
THD
of the test signal reaches a user-defined value at a specific point in the test setup.
Recommended procedure
1. Establish the test setup and the corresponding Hardware & Wiring schematic.
2. If required, temporarily amend the wiring to regulate the target parameter (see Example).
3. Click on
in the Worksheets ribbon, select the FX100 Device being employed and confirm
("OK")
the 'Generator Level' panel opens.
4. Adjust the generator & analyzer properties according to the setup and your requirements, e.g.
o The generator channel to be equalized
o The Start level and the maximum allowed generator output level for the regulation process
o The analyzer channel that is used for the feedback measurement
o The test signal parameter that has to be adjusted (i.e. level or THD)
o The target value of the aforementioned parameter, as well as its acceptance range
o The max. number of iterations of the regulation process
5. Make sure that the generator outputs are not muted, start the procedure ('Run') and apply the results ('Apply
Level').
6. Re-establish the wiring that is required for device testing.
Hint
The acquired generator level can be kept by saving it in a project (together with the current system
settings).
© 2015 NTi Audio AG, MBe
126
FX-Control User Manual
Example
The following example demonstrates how to adjust the FX100 generator voltage so that the THD of the test signal is
below -80 dB at the DUT (Device Under Test) input pins.
Step 1
The FX100 generator output volume is adjusted so that the THD of the test signal is below the specified value at
the DUT input pins
Step 2
Temporary wiring with feedback line to FX100 analyzer input
© 2015 NTi Audio AG, MBe
Regulators, equalization
127
Step 3
Click on the 'Generator Level' button in the Work sheets ribbon, select the FX100 Device being employed and
confirm via the 'OK' button
Step 4
Adjust the generator, analyzer properties for generator level regulation
© 2015 NTi Audio AG, MBe
128
FX-Control User Manual
Step 5
Calculated FX100 output level that results in < -80 dB THD at the DUT input pins
Step 6
Required wiring for device testing
© 2015 NTi Audio AG, MBe
Regulators, equalization
7.2
129
GlideSweep range
An accurate GlideSweep measurement requires that the input range (i.e. sensitivity) of the FX100 analyzer has been
adjusted properly prior to the signal transmission.
For this purpose, FX-Control provides an automated procedure that evaluates the optimum individual input ranges for
the analyzer channels.
Recommended procedure
1. Establish the test setup and wiring.
2. Adjust the generator GlideSweep properties (e.g. output level, start & stop frequency).
3. Click on the
confirm ("OK")
button in the Worksheets ribbon, select the FX100 Device being employed and
the 'GlideSweep Range' panel opens.
4. Adjust the regulator properties, i.e.
the analyzer channel(s) to be regulated
the headroom (i.e. additional "offset" to the minimum required input range)
5. Make sure that the generator outputs are not muted, and start the procedure ('Run and Apply Range').
Hint
The acquired GlideSweep range can be kept by saving it in a project (together with the current
system settings).
© 2015 NTi Audio AG, MBe
130
FX-Control User Manual
7.3
Generator equalization
The generator equalization is used to calibrate the FX100 output signal so that it compensates for the
characteristics of the downstream device(s).
Hint
Maximum equalization range is 60 dB
Recommended procedure
1. Establish the test setup and the corresponding Hardware & Wiring schematic.
2. If required, temporarily amend the wiring to allow equalization of the target parameter (see Example).
3. Click on
in the Worksheets ribbon, select the FX100 Device being employed and confirm
("OK")
the 'Generator Equalization' panel opens.
4. Adjust the generator & analyzer properties according to the setup and your equalization requirements, e.g.
o The generator channel to be equalized
o StepSweep or GlideSweep parameters, respectively (e.g. spacing, bandwidth, number of points)
o The Start level and the maximum allowed generator output level for the regulation process
o The analyzer channel that is used for the feedback measurement
o Analyzer parameters (e.g. reference frequency & level, acceptance range, max. number of iterations)
o The sweep mode(s), for which the equalization results are required (NOTE: GlideSweep equalization data
can be applied for StepSweep testing and vice versa)
5. Make sure that the generator outputs are not muted, start the equalization process ('Run') and apply the results
('Apply').
6. Re-establish the wiring that is required for device testing.
Hint
The acquired generator equalization data can be kept by saving it in a project (together with the
current system settings).
Example
a) Equalization of amplifier output
The FX100 generator output must equalize the amplifier
characteristics
flat frequency response of the
speak er driving signal
b) Equalization of speak er output
The FX100 must equalize the amplifier + loudspeak er
characteristics
flat frequency response of the
generated sound pressure level
© 2015 NTi Audio AG, MBe
Regulators, equalization
131
Step 1
For the amplifier output equalization, the FX-SIL
Speak on™ connector must be temporarily link ed to
analyzer channel 2
For SPL equalization, the microphone link to analyzer
channel 1 is used as feedback line
Step 2
Click on the 'Generator Equalization' button in the Work sheets ribbon, select the FX100 Device being employed
and confirm via the 'OK' button
© 2015 NTi Audio AG, MBe
132
FX-Control User Manual
Step 3
Adjust the generator, analyzer properties for SPL
equalization (k ey parameter settings highlighted)
Adjust the generator, analyzer properties for amplifier
equalization (k ey parameter settings highlighted)
© 2015 NTi Audio AG, MBe
Regulators, equalization
Step 4
Click on the 'Run' button to start the equalization and, if it was completed successfully, on 'Apply'
© 2015 NTi Audio AG, MBe
133
134
FX-Control User Manual
Step 5
Required wiring for speak er testing
7.4
Sensitivity calibration
The sensitivity calibration allows to measure the exact sensitivity of a connected microphone with the aid of a
microphone calibrator.
Recommended procedure
1. Click on
FX100 Device.
in the Worksheets ribbon, and select the connected
2. Click on the 'Sensitivity Calibration' panel and adjust its properties, i.e.
o Level
specified SPL of the microphone calibrator (typically 94 dBSPL)
o Channel
analyzer input, to which the microphone is connected
o Initial Delay
user-defined delay that allows the system to settle before the
calibration procedure starts
3. Plug the microphone into the mic calibrator and switch ON the calibrator
4. Click on the
5. Click on
button
the system displays the acquired sensitivity in [mV/Pa]
and close the panel.
© 2015 NTi Audio AG, MBe
Part
VIII
136
8
FX-Control User Manual
Measurements, results, calculations
FX100 supports Meter, StepSweep and GlideSweep measurements in three operating modes.
i. Single shot, i.e. singular acquisition of the active measurements of all operating modes
ii. Repeat, i.e. cyclic execution of the active measurements of all operating modes
iii. Continuous, i.e. permanent execution of the selected measurement only
Preparations
1. Adjust the generator settings (i.e. test signal parameters).
2. Adjust the analyzer settings (e.g. synchronization, range, coupling).
3. Activate the required measurement(s) in the Worksheets, i.e. either
drag & drop it from the toolbox to the worksheet, or
right-click on the measurement icon in the toolbox and select the display type, or
left-click on the related button in the worksheets ribbon and select the measurement function.
NOTE A measurement is only executed if a corresponding result display is placed on a Worksheet.
Single shot
Click on the
button in the 'Start' ribbon to initiate the single shot sequential execution of the active
measurement functions.
Example: Meter & StepSweep level
NOTE The blue 'Single' and 'Repeat' buttons refer to the corresponding FX100 instument only, whereas
the green 'All Single' and 'All Repeat' buttons apply on all connected FX100 Devices.
Repeat
Click on the
button in the 'Start' ribbon to initiate the repeated consecutive execution of the active
measurement functions.
Example: Meter & StepSweep level
© 2015 NTi Audio AG, MBe
Measurements, results, calculations
137
Continuous
Click on the
measurements.
,
or
button in the 'Start' ribbon to initiate the continuous acquisition of the respective
Example: StepSweep level
Hint
Result display and calculations are described in the corresponding chapters.
© 2015 NTi Audio AG, MBe
138
8.1
FX-Control User Manual
Meter
In the Meter mode, the FX100 analyzes the incoming signal and shows the single-value measurement results
numerically or in a bargraph.
Both the analysis of internally or externally generated test signals is supported
The test signal parameters (generator settings) may be amended during the measurement.
The analyzer ranging can be adjusted automatically or manually.
The Meter mode is typically used for single-value measurements (e.g. frequency, level, THD) or monitoring
applications.
Measurements
Frequency
Level
Input level
Selective level
FFT
Gain
THD
THD+N
Harmonics
Phase
XTalk
PureSound
DCV
DCV common high
DCV common low
DCR
Speaker Impedance
Settling
FX100 applies an automated settling procedure to ensure that the acquired measurement results are stable and
relevant.
Some static and dynamic parameters of this procedure can be edited manually if required.
NOTE Be very careful if you edit the settling parameters. Inappropriate settings can prolong test cycle
time or even inhibit the acquisition of valid measurement results.
In case of continuous Meter measurements, the settling is not active
© 2015 NTi Audio AG, MBe
Measurements, results, calculations
139
Meter settling properties
Meter settling properties (please refer also to the Example below)
Active
overall activation of the settling for all measurement functions
Timeout [s]
maximum allowed settling duration; if the timeout expires without successful settling
measurement result
Initial Delay [s]
Delay [ms]
no valid
one-time delay before the settling process starts
idle time before the settling process starts
Cycle (not editable)
number of signal periods that have to pass by before the settling process starts
Mode
individual (de-)activation of the settling for the specific measurement function(s)
o Normal
settling is active
o Off
settling is deactivated
Active Ch
activate or deactivate the settling for a specific channel
Algorithm
select the settling method
o Exponential
o Flat
the tolerance band gets wider as more samples are acquired
the width of the tolerance band is fixed (i.e. identical limits for all acquired samples)
Tolerance
the acceptable headroom (expressed in dB or %) between the last acquired sample and the upper,
lower tolerance limit
Sample
Floor
the number of samples that must be within the tolerance limits to fulfill the settling condition.
minimum signal level that a sample must have to be considered for the settling process
Noise
the inherent noise of the connected device(s) or analyzer is added to the acquired result, thus widening
the acceptance criterion
© 2015 NTi Audio AG, MBe
140
FX-Control User Manual
Example
Settling procedure
Sample
Comments
#x, #y, #z
samples are not considered for the current settling process, as they were acquired before the
expiration of Cycle, Delay
#1
sample rejected since it is below the Floor level (though it would meet the Exponential limit)
#2
sample rejected since it meets neither Exponential nor Flat tolerance limits
#3, #4
samples within Exponential, but not Flat limits
#5, #6
samples meet both Exponential and Flat limits (NOTE: only one limit type applies in practice)
#7
valid sample = measurement result, since the current settling conditions are met
© 2015 NTi Audio AG, MBe
Measurements, results, calculations
8.2
141
StepSweep
FX100 StepSweep analysis supports several audio measurements (Y-axis) versus three different parameters (XAxis).
Test signal parameters (generator settings) must be defined prior to the measurement and can not be amended
during the sweep.
Ranging can be adjusted automatically or manually.
The key advantage of StepSweep measurements is a high signal-to-noise ratio, thus providing highly accurate test
results.
NOTE If a noise level shall be measured, the analyzer synchronization must be switched to 'Generator'
and the acquisition to 'Wideband'.
StepSweep modes
a) Frequency
b) Amplitude
c) Time
d) Table
NOTE Special attention must be paid to the correct
synchronization between FX100 analyzer and the
signal generator
Measurements
Level
Selective level
Gain
THD
THD+N
Harmonics
Phase
XTalk
Speaker Impedance
Settling
FX100 applies an automated settling procedure to ensure that the acquired measurement results are stable and
relevant.
Some static and dynamic parameters of this procedure can be edited manually if required.
NOTE Be very careful if you edit the settling parameters. Inappropriate settings can prolong test cycle
time or even inhibit the acquisition of valid measurement results.
© 2015 NTi Audio AG, MBe
142
FX-Control User Manual
StepSweep settling properties
StepSweep settling properties (please refer also to the Example below)
Active
overall activation of the settling for all measurement functions
Timeout [s]
maximum allowed settling duration; if the timeout expires without successful settling
measurement result
Delay [ms]
no valid
idle time before the settling process starts
Cycle (not editable)
number of signal periods that have to pass by before the settling process starts
Mode
individual (de-)activation of the settling for the specific measurement function(s)
o Normal
settling is active
o Selective
o Off
settling is only active in the user-defined frequency range
settling is deactivated
Active Ch
activate or deactivate the settling for a specific channel
Algorithm
select the settling method
o Exponential
o Flat
the tolerance band gets the wider, the longer ago a sample has been acquired
the width of the tolerance band is fixed (i.e. identical limits for all acquired samples)
Tolerance
the acceptance headroom (expressed in dB or %) between the last acquired sample and the upper,
lower tolerance limit
Sample
Floor
the number of samples that must be within the tolerance limits to fulfill the settling condition.
minimum signal level that a sample must have to be considered for the settling process
Noise
the inherent noise of the connected device(s) or analyzer is added to the acquired result, thus widening
the acceptance criterion
© 2015 NTi Audio AG, MBe
Measurements, results, calculations
143
Example
Settling procedure
Sample
Comments
#x, #y, #z
samples are not considered for the current settling process, as they were acquired before the
expiration of Cycle, Delay
#1
sample rejected since it is below the Floor level
#2
sample rejected since it meets neither Exponential nor Flat tolerance limits
#3, #4
samples within Exponential, but not Flat limits
#5, #6
samples meet both Exponential and Flat limits (NOTE: only one limit type applies in practice)
#7
valid sample = measurement result, since the current settling conditions are met
© 2015 NTi Audio AG, MBe
144
8.3
FX-Control User Manual
GlideSweep
In GlideSweep mode, the FX100 samples the incoming chirp and then calculates the measurement results.
The following preparations are required to execute a GlideSweep ('chirp') measurement:
Definition of test signal parameters (generator settings; these settings can not be amended during the sweep).
Proper adjustment of the analyzer input range.
The key advantage of GlideSweep analysis is the short test cycle time, which makes this method very attractive for
high-volume production applications. Furthermore, PureSound steepness analysis is an extremely powerful measure
for detecting audible imperfections.
On the other hand, GlideSweep measuring accuracy decreases with very short sweep durations.
NOTE The analyzer GlideSweep range must be adjusted properly prior to the signal transmission &
measurement.
GlideSweep modes
a) Logarithmic
b) Linear (this mode supports only PureSound measurements)
NOTE PureSound analysis results that have been
acquired with a logarithmic GlideSweep are not
100% compatible to the data from a linear
GlideSweep
Measurements
Level
THD
Harmonics
PureSound
Phase
Speaker impedance
Signal latency
Impulse response
ETC
© 2015 NTi Audio AG, MBe
Measurements, results, calculations
8.4
145
Measurement functions
The following matrix shows the measurement functions supported by FX100, and the operating modes in which they
are available.
NOTE A measurement is only executed if a result display is placed on a Worksheet.
Measurement function
Comment
Frequency
dominant frequency of the input signal
Level
AC-coupled wideband level after filtering
InputLevel
DC-coupled unfiltered level
SelectiveLevel
bandpass-filtered level
FFT
signal spectrum (Fast Fourier Transformation)
Gain
ratio of input vs. output level
THD
Total Harmonic Distortion 1)
THD+N
Total Harmonic Distortion + Noise 1)
Harmonics
upper harmonics
Phase
interchannel phase
XTalk
interchannel crosstalk
PureSound
transient steepness
DCV
Differential DC voltage (between XLR pin 2
and 3)
DCVCommonLow
DC voltage between XLR pin 3 and GND
DCVCommonHigh
DC voltage between XLR pin 2 and GND
DCR
StepSweep
GlideSweep
2)
DC resistance
SpeakerImpedance
Signal latency
Meter
3)
4)
impedance of the connected speaker
propagation time of a GlideSweep
ImpulseResponse
impulse response
ETC
Energy-Time Curve
AESInputSampleRate
clock frequency of the AES input signal
5)
SyncInputSampleRate clock frequency at the Sync Ref Input
5)
connector
1)
Please refer to chapter THD calculation method
2)
PureSound analysis results from a logarithmic GlideSweep may vary from those of a linear GlideSweep
3)
Only available if a SIL or SIH option is installed (RSpeaker = USpeaker / UShunt )
4)
Only available for external GlideSweep transmission
5)
Only available if FX-AES board is installed
© 2015 NTi Audio AG, MBe
146
8.4.1
FX-Control User Manual
Frequency
The frequency measurement detects & analyzes the frequency of the dominant input signal component (Meter mode
only).
Properties
Header
editable name of the numerical frequency
measurement display
Source
the
measurement function; if it shall be amended, click on
button.
Active
o On
o Off
Unit
o Hz
measurement is active
measurement is inactive
Hertz
o ppmr
deviation in ppm relative to the current reference
frequency
Limit(s)
o Low
optionally enter the lower tolerance limit of the
frequency measurement
o High
optionally enter the upper tolerance limit of the
frequency measurement
Hint
It is possible to enter no limit, only the upper or the
lower limit, or both limits
Format
the format in which the numerical results are
displayed.
Result display
The frequency measurement results can be displayed either as a numerical value or in a bargraph.
© 2015 NTi Audio AG, MBe
Measurements, results, calculations
8.4.2
Level, input level, selective level
FX100 supports three different level measuring methods.
A) Level (wideband)
The level of the incoming signal after the input audio filter.
(available in Meter, StepSweep or GlideSweep mode)
B) Input level
The level of the incoming signal 'as is', i.e. without any audio filter.
(available only in Meter mode)
C) Selective level
The amplitude of the signal component with the dominant frequency
(available in Meter or StepSweep mode)
Hint
If no audio filter is active, the wideband level = input level
© 2015 NTi Audio AG, MBe
147
148
FX-Control User Manual
Properties
Header
editable name of the level measurement display.
Sources
measurement function.
o Clear the
checkbox to hide the corresponding curve in the
graph.
o Click on the
button to amend the measurement function.
o Click on the
button to delete the corresponding curve.
o Click on the
Active
o On
button to amend the curve color.
measurement is active
o Off
measurement is inactive
Unit
the measurement unit in which the measured level shall be
expressed
o V
o dBV
o dBPa
o dBSPL
o dBu
o dBr
Hint
With the dBr measurement you can compare the input
signal to a user-defined reference level.
Limit(s)
o Low (Meter mode)
optionally enter the lower tolerance limit
of the measurement
o High (Meter mode)
optionally enter the upper tolerance limit
of the measurement
o Edit Data... (Sweep mode)
optionally edit the tolerance
limits of the measurement
Hint
It is possible to enter no limit, only the upper or the lower
limit, or both limits
Type
Format
Color
Pen
not yet implemented (absolute or floating tolerance limits)
the format in which the numerical results are displayed.
selectable color of the corresponding curve.
selectable line style of the corresponding curve.
Interpolation
o Linear
the displayed result curve is drawn by connecting
neighbored points directly via straight lines.
o Steps
the displayed result curve is drawn by drawing
horizontal lines between neighbored points.
Add Source
click on this button to select and place another
measurement on the worksheet.
© 2015 NTi Audio AG, MBe
Measurements, results, calculations
The level measurement results can be displayed either
as numerical value (Meter mode)
in a bargraph (Meter mode)
in a graph (StepSweep or GlideSweep mode)
© 2015 NTi Audio AG, MBe
149
150
8.4.3
FX-Control User Manual
FFT
The FFT, scope measurements are only available in the Meter mode.
A) Spectrum analysis (frequency domain)
B) Scope mode (time domain)
© 2015 NTi Audio AG, MBe
Measurements, results, calculations
Header
151
editable name of the FFT measurement display
Sources
measurement function.
o Clear the
checkbox to hide the corresponding curve in the graph.
o Click on the
button to amend the measurement function.
o Click on the
button to delete the corresponding curve.
o Click on the
Active
o On
o Off
button to amend the curve color.
measurement is active
measurement is inactive
Domain
o Frequency
o Time
spectral signal analysis
time signal analysis ('scope' mode)
Trigger
the start of the signal acquisition can be triggered (only available
in Time domain mode)
o Active
On or Off
o Channel
select the input channel that is used for triggering
Window
the
o BlackmanHarris
o Hann
Unit
the measurement unit in which the FFT level shall be expressed
o V
o dBV
o dBPa
o dBSPL
o dBu
Limits: Edit Data...
Type
click on this button to edit the tolerance limit of the FFT measurement
not yet implemented (absolute or floating tolerance limits)
Size
the length (i.e. #samples or blocklength) of the FFT calculation gives the frequency resolution (see
Example 1 below).
o 512
375 Hz
o 16384
11.72 Hz
o 524288
0.37 Hz
o 1024
187.5 Hz
o 32768
5.86 Hz
o 1048576
0.18 Hz
o 2048
93.75 Hz
o 65536
2.93 Hz
o 2097152
0.09 Hz
o 4096
46.88 Hz
o 131072
1.46 Hz
o 8192
23.44 Hz
o 262144
0.73 Hz
Points
number of calculated & displayed FFT points between the start, stop frequency (less points
data transfer).
shorter
Detector Type
the result curve represents... (see Example 2 below)
o Max Peak (recommended for display)
...the maximum FFT bin value is searched and returned within the
width of one and the next graph points.
o Power (recommended for calculations)
...the energy within the width of one and the next graph points.
Spacing
linear or logarithmic distribution of the level results on the X-axis
Start
lower end of the displayed frequency range (side note: the FFT is always calculated over the full 80 k Hz
bandwidth)
Stop
upper end of the displayed frequency range
© 2015 NTi Audio AG, MBe
152
FX-Control User Manual
Average Type
for averaging of several consecutive FFT spectra
o Off
averaging disabled
o Exponential
o Normal
the averaged FFT spectra are weighted inversely proportional to their 'age'
all averaged FFT spectra are weighted equally
Average Cycles
number of the FFT spectra that are averaged for the current result display
Average 'Reset'
click on the button to re-start the averaging process.
'Write Full Res. Results to file'
o Active On
Full resolution mode is active
o Active Off
Format
the format, in which the numerical results are displayed.
Color
Pen
Full resolution mode is disabled
selectable color of the corresponding curve.
selectable line style of the corresponding curve.
Interpolation
o Linear
o Steps
Add Source
the displayed result curve is drawn by connecting neighbored points directly via straight lines.
the displayed result curve is drawn by drawing horizontal lines between neighbored points.
click on this button to select and place another measurement on the worksheet.
Example 1
Size (blocklength), No. of displayed Points and Resolution
© 2015 NTi Audio AG, MBe
Measurements, results, calculations
153
Example 2
Detector Type "Max Peak" vs. "Power"
Pink curve:
Max Peak @ 512 Points
frequency
Green curve:
Power @ 10 Points
band
© 2015 NTi Audio AG, MBe
each point of the curve shows the voltage at the corresponding
the displayed values represent the energy in the corresponding frequency
154
FX-Control User Manual
8.4.4
Gain
The ratio between the generated output level and the measured input level of the same channel gives the gain.
Hint
The link between the analyzer and the generator is established internally (i.e. there is no need for an
external connection)
Properties
Header
editable name of the gain measurement display.
Sources
measurement function.
o Clear the
checkbox to hide the corresponding curve in the
graph.
o Click on the
button to amend the measurement function.
o Click on the
button to delete the corresponding curve.
o Click on the
Active
o On
o Off
button to amend the curve color.
measurement is active
measurement is inactive
Unit
the measurement unit in which the measured gain shall be expressed
o dB
o %
Limit(s)
o Low (Meter mode)
o High (Meter mode)
optionally enter the lower tolerance limit of the measurement
optionally enter the upper tolerance limit of the measurement
o Edit Data... (StepSweep)
Hint
optionally edit the tolerance limits of the measurement
It is possible to enter no limit, only the upper or the lower limit, or both limits
© 2015 NTi Audio AG, MBe
Measurements, results, calculations
Type
Format
Color
Pen
155
not yet implemented (absolute or floating tolerance limits)
the format in which the numerical results are displayed.
selectable color of the corresponding curve.
selectable line style of the corresponding curve.
Interpolation
o Linear
the displayed result curve is drawn by connecting
neighbored points directly via straight lines.
o Steps
the displayed result curve is drawn by drawing
horizontal lines between neighbored points.
Add Source
click on this button to select and place another
measurement on the worksheet.
Result display
The Meter gain measurement results can be displayed either as a numerical value or in a bargraph.
The StepSweep gain measurement results are displayed in a graph.
© 2015 NTi Audio AG, MBe
156
8.4.5
FX-Control User Manual
THD, THDN, harmonics
FX100 supports three different harmonic distortion(s) measurements.
i. THD (Total Harmonic Distortion)
the sum of all harmonic distortions
ii. THDN (Total Harmonic Distortion + Noise)
the sum of all harmonic distortions + noise
iii. Harmonics
the sum of a user-defined selection of harmonic distortions (up to six simultaneous harmonics
measurements per channel are supported)
NOTE If the distortion of an externally generated test signal is to be measured, the analyzer
synchronization must be switched to 'External'.
The THD measurement result can be calculated according to IEC or IEEE
THD, THDN properties
Header
editable name of the THD, THDN measurement display.
Sources
measurement function.
o Clear the
checkbox to hide the corresponding curve in the
graph.
o Click on the
button to amend the measurement function.
o Click on the
button to delete the corresponding curve.
o Click on the
Active
o On
o Off
button to amend the curve color.
measurement is active
measurement is inactive
Ext. Fund. Rejection (THDN measurement only)
the width of the
notch filter that suppresses the fundamental sine wave. Example:
© 2015 NTi Audio AG, MBe
Measurements, results, calculations
157
Side bands, which are, due to generator jitter, very close to the
fundamental sine wave, can only be measured with 'Narrow'
rejection.
o Narrow
extremely sharp adaptive notch filter
o Wide
filter with Q-factor 1.6
Unit
the measurement unit in which the THD / THDN result is
expressed
o V
o dBV
o dBPa
o dBSPL
o dBu
o %
o dB
o dBr
Hint
Limit(s)
o High (Meter mode)
enter the upper tolerance limit for the THD, THDN measurement
o Edit Data... (Sweep mode)
Format
Color
edit the upper tolerance limits for the frequency sweep
the format in which the numerical results are displayed.
selectable color of the corresponding curve.
Pen
selectable line style of the corresponding curve.
Interpolation
o Linear
o Steps
Add Source
Hint
With the dBr measurement it is possible to compare the
input signal to a user-defined reference level.
the displayed result curve is drawn by connecting neighbored points directly via straight lines.
the displayed result curve is drawn by drawing horizontal lines between neighbored points.
click on this button to select and place another measurement on the worksheet.
With the THD+N measurement it is possible to select the width of the notch filter, which suppresses
the fundamental sine wave. The 'Ext. Fund. Rejection' is accessible via the properties of the THDN
item in the toolbox, and can have following states:
Narrow
Wide
extremely sharp adaptive notch filter
filter with Q-factor 1.6
Example
Side bands, which are, due to generator jitter, very close to the fundamental sine wave, can only be measured with
'Narrow' rejection.
© 2015 NTi Audio AG, MBe
158
FX-Control User Manual
Harmonics properties
Header
editable name of the THD, THDN measurement display.
Sources
measurement function.
o Clear the
checkbox to hide the corresponding curve in the graph.
o Click on the
button to amend the measurement function.
o Click on the
button to delete the corresponding curve.
o Click on the
Active
o On
o Off
button to amend the curve color.
measurement is active
measurement is inactive
Unit
the measurement unit in which the distortion result shall be
expressed
Hint
The selected measurement unit applies for all measurements of
the same type
Set
define the required harmonics group
o tick the harmonics that have to be measured
o clear the checkboxes of those harmonics that should be ignored
Click on the
button to
o Select All harmonics
o Clear All checkboxes
o sum up the Odd harmonics
o sum up the Even harmonics
Limit(s)
o High (Meter mode)
enter the upper tolerance limit for the harmonics
measurement
o Edit Data... (Sweep mode)
edit the upper tolerance limits for the
frequency sweep
Format
Color
Pen
the format in which the numerical frequency result is displayed.
selectable color of the corresponding curve.
selectable line style of the corresponding curve.
Interpolation
o Linear
the displayed result curve is drawn by connecting neighbored
points directly via straight lines.
o Steps
the displayed result curve is drawn by drawing horizontal lines
between neighbored points.
Add Source
click on this button to select and place another
measurement on the worksheet.
© 2015 NTi Audio AG, MBe
Measurements, results, calculations
Result display
The Meter distortion results can be displayed either as a numerical value or in a bargraph.
The StepSweep or GlideSweep distortion results are displayed in a graph.
© 2015 NTi Audio AG, MBe
159
160
8.4.6
FX-Control User Manual
Phase (interchannel)
The interchannel phase measures the phase shift between the generator, analyzer channels.
The test system has to be prepared as follows.
1. Switch the FX100 Meter, StepSweep generator to waveform 'Mono'.
2. Connect the generator output channel via the DUT (Device Under Test) to an analyzer input channel.
3. Link the alternate generator channel to the free analyzer channel.
NOTE The interchannel phase can only be measured between the channels of the same analyzer board,
i.e. chn1 - chn2 or chn3 - chn4.
Properties
Header
editable name of the phase measurement display.
Sources
measurement function.
o Clear the
checkbox to hide the corresponding curve in the
graph.
o Click on the
button to amend the measurement function.
o Click on the
button to delete the corresponding curve.
o Click on the
Active
o On
o Off
button to amend the curve color.
measurement is active
measurement is inactive
Unit
the measurement unit in which the phase result is
expressed
o deg
degree (0°...360°)
o rad
radiant (0...2 )
Scale
the value, at which the phase result rolls over by 360° / 2
(see example below)
© 2015 NTi Audio AG, MBe
Measurements, results, calculations
161
Limit(s)
o Low (Meter mode)
optionally enter the lower tolerance limit
of the measurement
o High (Meter mode)
optionally enter the upper tolerance limit
of the measurement
o Edit Data... (StepSweep)
optionally edit the tolerance limits
of the measurement
Hint
It is possible to enter no limit, only the upper or the lower
limit, or both limits.
Type
Format
Color
Pen
not yet implemented (absolute or floating tolerance limits)
the format in which the numerical results are displayed.
selectable color of the corresponding curve.
selectable line style of the corresponding curve.
Interpolation
o Linear
the displayed result curve is drawn by connecting
neighbored points directly via straight lines.
o Steps
the displayed result curve is drawn by drawing
horizontal lines between neighbored points.
Add Source
click on this button to select and place another
measurement on the worksheet.
Result display
The Meter phase results can be displayed either as a numerical value or in a bargraph.
The StepSweep phase results are displayed in a graph.
© 2015 NTi Audio AG, MBe
162
FX-Control User Manual
Interchannel phase measurements with parameter 'Scale' set to 0° (top) and 180° (bottom)
© 2015 NTi Audio AG, MBe
Measurements, results, calculations
8.4.7
163
XTalk (interchannel)
The amount by which the voltage of one channel interferes with the alternate channel gives the interchannel
crosstalk.
A typical XTalk measurement is executed as follows.
1. Establish the connections from the FX100 generator via the DUT (Device Under Test) to the analyzer.
2. Switch OFF (i.e. mute) the generator output of the channel to be measured.
3. Start the measurement. The active test signal is thereby transmitted through the active channel, while the level of
the inactive channel is measured.
NOTE The interchannel XTalk can only be measured between the channels of the same analyzer board,
i.e. chn1 - chn2 or chn3 - chn4.
Properties
Header
editable name of the XTalk measurement display.
Sources
measurement function.
o Clear the
checkbox to hide the corresponding curve in the
graph.
o Click on the
button to amend the measurement function.
o Click on the
button to delete the corresponding curve.
o Click on the
Active
o On
o Off
© 2015 NTi Audio AG, MBe
button to amend the curve color.
measurement is active
measurement is inactive
164
FX-Control User Manual
Unit
the measurement unit in which the measured XTalk shall be
expressed
o dB
o %
Limit(s)
o High (Meter mode)
optionally enter the upper tolerance limit
of the measurement
o Edit Data... (StepSweep)
optionally edit the tolerance limits
of the measurement
Format
Color
Pen
the format in which the numerical results are displayed.
selectable color of the corresponding curve.
selectable line style of the corresponding curve.
Interpolation
o Linear
the displayed result curve is drawn by connecting
neighbored points directly via straight lines.
o Steps
the displayed result curve is drawn by drawing
horizontal lines between neighbored points.
Add Source
click on this button to select and place another
measurement on the worksheet.
Result display
The Meter XTalk results can be displayed either as a numerical value or in a bargraph.
The StepSweep XTalk results are displayed in a graph.
© 2015 NTi Audio AG, MBe
Measurements, results, calculations
8.4.8
165
PureSound
NTi Audio's unique PureSound™ analysis measures the transient steepness of the received signal. The
measurement provides, for instance, the facility to identify audible imperfections or other irregularities, which can not
be detected by conventional test methods such as distortion analysis.
The schematic picture below explains the basic principle behind PureSound analysis.
Six filters divide the transmitted signal into separate components.
Every signal component is post-processed by the PureSound algorithm.
As opposed to distortion analysis, PureSound analysis operates in the time domain.
PureSound measurements are typically used for the analysis of
A) Sinusoidal signals
B) Complex sound
Constant sine tone (Meter mode)
Mobile phone ringing tone
Linear GlideSweep
Machinery noise
Logarithmic GlideSweep
Peak(s) in the resulting steepness graphs indicate
irritating noise.
Hint
The resulting steepness graphs represent a 'fingerprint'
of the original signal, and can be used for correlation
tests.
StepSweep is not suited for PureSound analysis
Properties
Common
Analysis Range
select the bandpass filters for steepness analysis,
o Low
60...480 Hz
o Mid
o High
340...2800 Hz
2...20 kHz (complies to the filters of RT-2M)
Points (GlideSweep only)
the number of steepness result values that are uploaded to the controller PC (i.e. the
resolution of the displayed steepness response curve - see Example below)
Max Runs (GlideSweep only)
the number of times the PureSound test is repeated if the measurement results
exceed the tolerance limits. The system then compares the data of the executed cycles to eliminate all nonrecurring peaks (e.g stochastic ambient noise), and thus considers only systematic events (see Example below).
© 2015 NTi Audio AG, MBe
166
FX-Control User Manual
ChannelX
BandX The six frequency bands of PureSound analyzes can be
enabled ('On') or disabled ('Off') individually.
Unit
the measurement unit in which the PureSound band result is
expressed
o Pa/s
o V/s
Limit(s)
o High (Meter mode)
enter the upper tolerance limit for the
PureSound measurement
o Edit Data... (GlideSweep mode)
the steepness analysis
edit the upper tolerance limits for
Result display (Meter or GlideSweep)
Header
editable name of the PureSound measurement display.
Sources
measurement function.
o Clear the
checkbox to hide the corresponding curve in the graph.
o Click on the
button to amend the measurement function.
o Click on the
button to delete the corresponding curve.
o Click on the
BandX
Unit
Hint
button to amend the curve color.
The six frequency bands of PureSound analyzes can be enabled ("On") or disabled ("Off") individually.
the measurement unit in which the PureSound band result is expressed
The selected measurement unit applies for all PureSound bands
Limit(s)
o High (Meter mode)
enter the upper tolerance limit for the
PureSound measurement
o Edit Data... (GlideSweep mode)
edit the upper tolerance limits for
the steepness analysis
Format
the format in which the numerical results are displayed.
Color (GlideSweep mode)
Pen (GlideSweep mode)
curve.
selectable color of the corresponding curve.
selectable line style of the corresponding
Interpolation (GlideSweep mode)
o Linear
the displayed result curve is drawn by connecting
neighbored points directly via straight lines.
o Steps
the displayed result curve is drawn by drawing horizontal
lines between neighbored points.
Add Source (GlideSweep mode)
click on this button to select and
place another measurement on the worksheet.
© 2015 NTi Audio AG, MBe
Measurements, results, calculations
167
Example for parameter 'Points'
Steepness response with 200 points
Steepness response with 20 points
Example for parameter 'Max Runs'
During the 1st cycle, a peak exceeds the given
tolerance limits
the test is repeated
During the 2nd cycle (same DUT - Device Under Test), all
steepness curves are within the limits
the peak from
the 1st cycle was caused by ambient noise, i.e. the DUT
is OK
Result display
The Meter steepness results can be displayed either as a numerical value or in a bargraph.
© 2015 NTi Audio AG, MBe
168
FX-Control User Manual
The GlideSweep PureSound results are displayed in a graph.
© 2015 NTi Audio AG, MBe
Measurements, results, calculations
8.4.9
169
DCV
FX100 supports three DC measurements. The analyzer coupling must be set to 'DC'.
1. DCV
the Voltage between
o XLR pin 2 and pin 3, or
o BNC center pin and shield
2. DCVCommonHigh
the common-mode Voltage between XLR pin 2 and pin 1
3. DCVCommonLow
the common-mode Voltage between XLR pin 3 and pin 1
Hint
Since DCV and the AC measurements require different settings, they must be executed sequentially.
Properties
Header
editable name of the DCV measurement display.
Sources
measurement function.
o Click on the
button to amend the measurement function.
o Click on the
button to delete the corresponding curve.
o Click on the
Active
o On
measurement is active
o Off
Unit
button to amend the curve color.
measurement is inactive
Volt
Limit
o Low
optionally enter the lower tolerance limit for the DCV
measurement
o High
optionally enter the upper tolerance limit for the DCV
measurement
Format
the format in which the numerical results are displayed.
Result display
The DCV results can be displayed either as a numerical value or in a bargraph.
© 2015 NTi Audio AG, MBe
170
FX-Control User Manual
8.4.10 DCR
For a DCR measurement, the analyzer generates a constant current to measure the voltage across the DUT (Device
Under Test).
Test setup & execution
Establish a link between the DUT input and the connectors of the analyzer channel
Switch the analyzer coupling to DC
Adjust the bias of the board that is directly connected to the DUT input, i.e.
o FX-ANA
bias "DCR 5k range" or "DCR 100k range"
o FX-SIL
"DCR 32E range"
o FX-SIH
"DCR 4E range"
Place a DCR measurement display on the Worksheet and start the measurement.
Hint
Since DCR and the AC impedance measurements require different settings, they must be executed
sequentially.
Example A
Measure the DC input impedance of a DUT that is directly connected to the
FX100 generator output.
1. Switch to the Hardware & Wiring view.
2. Activate the "DC Measurement" routing on the corresponding output channel, using
o a right-click on the
button of the generator board, or
o the generator board properties.
3. Switch the analyzer coupling of the corresponding channel to "DC".
4. Activate the analyzer bias current according to the expected impedance of the DUT
o DCR 5k range
1.6 mA for up to 5 k
o DCR 100k range
100 A for up to 100 k
© 2015 NTi Audio AG, MBe
Measurements, results, calculations
171
Example B
Measure the DC impedance of a loudspeaker that is
connected to FX100 via the FX-SIL board.
1. Switch to the Hardware & Wiring view.
2. Switch the analyzer coupling of the corresponding channel to
"DC".
3. Activate the "DCR32ERange" mode in the FX-SIL properties.
Properties
Header
editable name of the DCR measurement display.
Sources
measurement function.
o Click on the
button to amend the measurement function.
o Click on the
button to delete the corresponding curve.
o Click on the
Active
o On
o Off
Unit
button to amend the curve color.
measurement is active
measurement is inactive
Ohm
Limit
o Low
optionally enter the lower tolerance limit for the DCR
measurement
o High
optionally enter the upper tolerance limit for the DCR
measurement
Format
© 2015 NTi Audio AG, MBe
the format in which the numerical results are displayed.
172
FX-Control User Manual
Result display
The DCR results can be displayed either as a numerical value or in a bargraph.
© 2015 NTi Audio AG, MBe
Measurements, results, calculations
173
8.4.11 Speaker impedance
The speaker impedance measurement records the impedance response of the connected DUT (Device Under Test).
NOTE This measurement function is only available if an SIP, SIL or SIH board is installed
Test setup & execution ...
... with FX-SIP
... with FX-SIL or FX-SIH
1.
Select the operation mode, DUAL (2*10 W) or
BRIDGE (1*30 W)
1.
2.
3.
Connect the generator output(s) to the integrated 2.
amplifier(s)
3.
Connect the amplifier output(s) to the DUT(s)
4.
4.
Link the SIP current sensor(s) to the analyzer.
5.
Adjust the GlideSweep input range
6.
Start the measurement.
5.
Connect the generator output(s) to an external
amplifier.
Connect the amplifier output(s) to the SIL, SIH input(s).
Connect the SIL, SIH output(s) to the DUT(s).
Link the SIL, SIH current sensor(s) to an analyzer
channel.
Temporarily link the SIL, SIH input connector
(Speakon™) to a free analyzer channel and
o adjust the GlideSweep input range
o execute a generator equalization
o enter the calibrated amplifier output level as
'VoltageValue' in the properties (see below)
o re-establish the standard measurement link.
6.
Start the measurement.
Setup examples
SIP wiring for 1-channel speak er frequency & impedance SIL wiring for 1-channel speak er frequency & impedance
response measurement
response measurement
© 2015 NTi Audio AG, MBe
174
FX-Control User Manual
Properties
Header
editable name of the level measurement display.
Sources
measurement function.
o Clear the
checkbox to hide the corresponding curve in the
graph.
o Click on the
button to amend the measurement function.
o Click on the
button to delete the corresponding curve.
o Click on the
Active
o On
o Off
button to amend the curve color.
measurement is active
measurement is inactive
Reference Type
for a correct measurement, either
o select 'VoltageValue' and enter the calibrated amplifier output
voltage, or
o select 'Reading' and link the Speakon™ input connector to a free
analyzer channel
External Shunt Resistor (applies only if an external impedance test box
is used)
enter the impedance of the shunt resistor.
External Voltage Divider (applies only if an external voltage divider is
used)
enter the voltage divider ratio. Example: "10" stands for "10:1"
Unit
Ohm
Limit(s)
o Low (Meter mode)
optionally enter the lower tolerance limit of
the measurement
o High (Meter mode)
optionally enter the upper tolerance limit of
the measurement
o Edit Data... (Sweep mode)
optionally edit the tolerance limits of
the measurement
Hint
It is possible to enter no limit, only the upper or the lower
limit, or both limits
Type
Format
Color
Pen
not yet implemented (absolute or floating tolerance limits)
the format in which the numerical results are displayed.
selectable color of the corresponding curve.
selectable line style of the corresponding curve.
Interpolation
o Linear
the displayed result curve is drawn by connecting
neighbored points directly via straight lines.
o Steps
the displayed result curve is drawn by drawing horizontal
lines between neighbored points.
Add Source
click on this button to select and place another
measurement on the worksheet.
© 2015 NTi Audio AG, MBe
Measurements, results, calculations
175
Result display
The Meter speaker impedance measurement results can be displayed either as a numerical value or in a bargraph.
The speaker impedance response results are displayed in a graph.
© 2015 NTi Audio AG, MBe
176
FX-Control User Manual
8.4.12 Signal latency
The signal latency is the time that it takes for a GlideSweep to propagate from the generator to the analyzer.
Schematic test setups for internal and external signal latency measurement
NOTE If the signal latency shall be measured from an external device to the FX100 analyzer, you must
make sure that the analyzer is started at the same time when the signal is generated by the
external device (e.g. by triggering the two devices with an electrical signal).
Test setup & execution
Follow the instructions given in the chapter "Application hints
External signal analysis".
Properties
Active
select the channel(s) for the signal latency measurement
Unit
the measured delay can be expressed in seconds, or as distance*
o seconds
o meter
o feet
Limit(s)
o Low
o High
optionally enter the lower tolerance limit for the measurement
optionally enter the upper tolerance limit for the measurement
Result display
The GlideSweep signal latency measurement results can be displayed either as a numerical value or in a bargraph.
*: The calculation time
"Advanced
General"
distance refers to the ambient temperature, which is defined in the toolbox under
© 2015 NTi Audio AG, MBe
Measurements, results, calculations
177
8.4.13 Impulse response
The impulse response is directly calculated from the acquired GlideSweep data.
Properties
Active
Unit
enable the channel(s) for the impulse response measurement
Unity (–1...+1)
Start, Stop
Limits
define the zoom range of the impulse response graph
optionally enter the lower, upper tolerance limits for the measurement
'Write Full Res. Results to file'
o Active On
Full resolution mode is active
o Active Off
Full resolution mode is disabled
Result display
The impulse response results are displayed in a graph, whereby the grey vertical line indicates the end point of the
active time window.
© 2015 NTi Audio AG, MBe
178
FX-Control User Manual
8.4.14 ETC
The ETC (Energy-Time Curve) is directly calculated from the acquired GlideSweep data.
Properties
Active
Unit
enable the channel(s) for the ETC measurement
the unit of the Y-axis
Start, Stop
Limits
define the zoom range of the ETC graph
optionally enter the lower, upper tolerance limits for the measurement
'Write Full Res. Results to file'
o Active On
Full resolution mode is active
o Active Off
Full resolution mode is disabled
Result display
The ETC results are displayed in a graph, whereby the grey vertical line indicates the end point of the active time
window.
© 2015 NTi Audio AG, MBe
Measurements, results, calculations
179
8.4.15 AES input sample rate
The AES input sample rate is the clock frequency of the incoming AES digital Audio signal.
NOTE This measurement function is only available if the FX-AES board is installed
Properties
Header
editable name of the AES input sample rate
measurement display
Source
the
measurement function; if it shall be amended, click on
button.
Active
o On
o Off
measurement is active
measurement is inactive
Unit
o Hz
Hertz (must be selected for the Sample Rate
Deviation)
o ppmr
parts per million relative
Limit(s)
o Low
optionally enter the lower tolerance limit of the
frequency measurement
o High
optionally enter the upper tolerance limit of the
frequency measurement
Hint
It is possible to enter no limit, only the upper or the
lower limit, or both limits
Format
the format in which the numerical results are
displayed.
Result display
The AES sample rate measurement results can be displayed either as a numerical value or in a bargraph.
© 2015 NTi Audio AG, MBe
180
FX-Control User Manual
8.4.16 Sync input sample rate
The Sync input sample rate is the clock frequency at the Sync Ref. Input connector.
NOTE This measurement function is only available if the FX-AES board is installed
Properties
Header
editable name of the Sync input sample rate
measurement display
Source
the
measurement function; if it shall be amended, click on
button.
Active
o On
o Off
measurement is active
measurement is inactive
Unit
o Hz
Hertz (must be selected for the Sample Rate
Deviation)
o ppmr
parts per million relative
Limit(s)
o Low
optionally enter the lower tolerance limit of the
frequency measurement
o High
optionally enter the upper tolerance limit of the
frequency measurement
Hint
It is possible to enter no limit, only the upper or the
lower limit, or both limits
Format
the format in which the numerical results are
displayed.
Result display
The Sync input sample rate measurement results can be displayed either as a numerical value or in a bargraph.
8.4.17 Settling
FX100 applies an automated settling procedure to ensure that the acquired results are stable and relevant. Some
static and dynamic parameters of this procedure can be edited manually if required (please refer to chapters Meter,
StepSweep).
© 2015 NTi Audio AG, MBe
Measurements, results, calculations
181
8.4.18 Units
The units of the FX100 measurement functions can be divided into two groups, absolute and relative units.
a) Absolute units
Unit
Explanations
A
Ampere – current (only available for calculation items)
dBFS
decibel full scale – for digital Audio
dBFSp
decibel full scale peak – for digital Audio
dBPa
decibel Pascal – for acoustic measurements
dBSPL
decibel sound pressure level – for acoustic measurements
dBu
decibel relative to 0.7746 V – for Voltage measurements
dBup
decibel relative to 0.7746 V peak – for Voltage measurements
dBV
decibel relative to 1.0 V – for Voltage measurements
dBV / Pa
decibel Volt per Pascal – microphone sensitivity
dBVp
decibel Volt peak – for Voltage measurements
deg
degree [angle] – for Phase measurements
Deg C
degree Celsius – temperature (only available for calculation items)
Deg F
degree Fahrenheit – temperature (only available for calculation items)
Feet
Feet – distance (only available for calculation items)
FFS
fraction of full scale – for digital Audio
FFSp
fraction of full scale peak – for digital Audio
Hz
Hertz – for frequency measurements
Meter
Meter – distance (only available for calculation items)
mV / Pa
Millivolt per Pascal – microphone sensitivity
Ohm
Ohm – for impedance measurements
Pa / s
Pascal per Second – for PureSound measurements
%FS
percent full scale – for digital Audio
%FSp
percent full scale peak – for digital Audio
rad
Rad – for Phase measurements
s
Second – time
V
Volt – for Voltage measurements
Vp
Volt peak – for Voltage measurements
V/s
Volt per Second – for PureSound measurements
W
Watt – electric power (only available for calculation items)
b) Relative units
dB
decibel
dBr
decibel relative
%
percent
%Tol
percent tolerance
ppm
parts per million
ppmr
parts per million relative
© 2015 NTi Audio AG, MBe
Hint
The results of some measurement functions can be
displayed either in an absolute or relative unit, e.g.
Level
V or dBu, dBV
THD
V or dB, %
The corresponding sweep curves can therefore vary
significantly in their shapes
182
8.5
FX-Control User Manual
Measurement execution
The active measurements or a sequence can be initiated in three different ways.
i. The user manually gives the start command via the PC keyboard (see below).
ii. An external device (e.g. PLC or foot switch) triggers the test via the auxiliary I/O interface.
iii. The user arms the FX100 analyzer in GlideSweep mode, then the instrument automatically starts the
measurement as soon as it detects a header.
Triggering methods
i. Manually start the active measurements or sequence
,
or F5
All Single
starts a single execution of the active Meter, StepSweep and GlideSweep
measurements of all connected FX100 Devices
or F6
All Repeat
starts repeated execution of the active Meter, StepSweep and GlideSweep
measurements of all connected FX100 instruments
Meter, StepSweep, GlideSweep
or mode
FX100 starts continuously measuring in the corresponding
Single
the instrument executes a single measurement of all active panels in the Worksheets
Repeat
the instrument starts repeated measurements of all active panels in the Worksheets
or F8 Abort the running measurement
ii. Initiate the active measurements via the auxiliary I/O
Click on the dialog box launcher in the Start ribbon.
© 2015 NTi Audio AG, MBe
Measurements, results, calculations
183
In the 'Sequence Dialog' box,
o tick the checkbox 'Aux Trigger Bit',
o select the auxiliary input pin that shall be used to trigger the measurement,
o select the trigger signal Type (positive or negative edge)
Hint
This setting allows to initiate a measurement or a sequence by an externally generated trigger signal.
You may however also add more input trigger steps to a sequence.
iii. Arm the analyzer so that it triggers to an externally generated GlideSweep signal
Refer to chapter 'External signal analysis'
Measurement execution
As soon as the trigger impulse has been given, the FX100
1. generates the test signal (exceptions: the instrument has been armed, or the generator is muted),
2. samples the incoming signal, calculates the active measurement results and compares them against predefined
tolerance limits in real-time,
3. uploads the result data to the controller PC.
NOTE A measurement is only executed if a result display is placed on a Worksheet.
© 2015 NTi Audio AG, MBe
184
8.5.1
FX-Control User Manual
Continuous
Click on the
,
or
button in the 'Start' ribbon to initiate the continuous acquisition of the respective
measurement (either Meter or StepSweep or GlideSweep mode).
Terminate the continuous measurement by clicking on the
8.5.2
button.
Single
Click on the
button in the 'Start' ribbon to initiate a single shot acquisition of all active measurements
(Meter, StepSweep or GlideSweep mode).
The green
button in the quick access toolbar or the <F5> key offer the same functionality for all FX100 Devices
that are connected to the controller PC.
© 2015 NTi Audio AG, MBe
Measurements, results, calculations
8.5.3
185
Repeat
Click on the
button in the 'Start' ribbon to initiate the repeated acquisition of all active measurements
(Meter, StepSweep or GlideSweep mode).
Terminate the repeat measurement by clicking on the
button.
The green
button in the quick access toolbar or the <F6> key offer the same functionality for all FX100
Devices that are connected to the controller PC.
© 2015 NTi Audio AG, MBe
186
FX-Control User Manual
8.6
Result display & data handling
The acquired measurement results can be visualized or processed in different ways.
Display the Meter measurement results as numerical values or in a bargraph..
Show the StepSweep, GlideSweep result curves in a graph.
Compare the measurement results against customized tolerance limits and show the outcome in a PASS / FAIL
display.
Process the acquired measurement data with a user-defined calculation.
Copy raw data to the clipboard (and paste, for example, to a spreadsheet)
Log the acquired result data to a file.
NOTE A measurement is only executed if a result display is placed on a Worksheet.
8.6.1
Numerical display
The numerical display can be used for all Meter mode measurements. To activate a measurement and to show the
related numerical result display,
drag & drop the
icon of the corresponding measurement function from the tree to the Worksheet, or
click on the 'Numeric Display' button in the worksheets ribbon and select the required measurement.
Examples
Hint
Right-click on the meter display to
(de-)activate the measurement,
amend the measurement unit for the next cycle,
set the reference level for level relative measurements
Header
editable name of the
numerical display
Active
select "Off" to temporarily
disable the measurement
Unit
selectable measurement unit
Limit High / Low
editable upper /
lower tolerance limit
Format
the format of the
numerical readout, e.g.
o "0.00" limits the number of
digits behind the decimal
separator of the measured
result.
o "e" shows the numerical result
in exponential (i.e. scientific)
notation. Example: -61.96 dBV
"-6.196e+001 dBV"
© 2015 NTi Audio AG, MBe
Measurements, results, calculations
8.6.2
187
Bargraph
The bargraph display shows the numerical measurement next to a graphical indicator. To activate a measurement
and to show the related bargraph result display,
right-click on the
icon of the corresponding measurement function in the tree, or
click on the 'BarGraph Display' button in the worksheets ribbon and select the required measurement.
Example
Right-click on the bargraph to
i. (de-)activate the measurement
ii. amend the measurement unit,
iii. show the tolerance limit (green bar),
iv. show the min/max results numerically and graphically
(grey bar),
v. reset the min/max results display,
vi. activate the auto scaling or edit the scaling manually.
Hint
8.6.3
The numerical result will be shown in green or red ciphers, depending whether the measurement is
within or beyond the tolerance limits.
Graph
The acquired FFT or sweep measurement results are displayed as curves in a standard 'Line Graph' or a 'Line Graph
Collector'.
NOTE A graph can host the result curves of simultaneously acquired measurements (e.g. level chn1 and
chn 2, or THD and Harmonics), but not of measurements with different Y-axis unit.
A PASS/FAIL tolerance that is defined for a specific measurement applies on every line graph and
line graph collector of the measurement.
Line Graph
The line graph displays the last recorded measurement curve, kept curves (optional)
and with the active tolerance limits.
Read out the data of any measurement point
move the cursor over the curve.
Keep the last recorded curve
right-click on the curve and select "Keep Curve".
Thus, the curve and the related data is saved
o in the graph,
o in the project file,
o and as a calculation item.
Frequency response line
graph with title, tolerance
limits, k ept curve, cursor
readout and legend
Amend the graph scaling
Delete a curve
right-click on the curve and select "Delete".
Copy the numeric data of the last recorded or a kept curve to the clipboard (from
where it can be pasted, for instance, to a spreadsheet program)
right-click on the
curve and select "Copy Data".
right-click on the graph and select "Edit Scale...", "Y Axis" or "X Axis".
NOTE Be careful when changing the scaling from linear to logarithmic or vice versa, as this may
compromise e.g. the result of a linear interpolation (refer to chapter X-/Y-axis scaling).
Show Title
adds the title of the measurement in the top line; the title is thus included if the graph is copied or
exported to a report
Show Legend
curve(s).
© 2015 NTi Audio AG, MBe
adds a section below the graph that shows the name(s), unit and color(s) of the displayed
188
FX-Control User Manual
Zoom in by moving the mouse over the area of interest while holding the left mouse button.
Return to the full view by double-clicking on the graph with the left mouse button.
Header
editable name of the line graph display
Name (applies only for k ept curves)
curve
Sources
measurement function.
o Click on the
button to activate another function.
o Click on the
button to delete the corresponding source.
o Click on the
Active
Unit
Format
Color
Pen
button to amend the curve color.
select "Off" to temporarily disable the measurement
selectable measurement unit (Y-axis)
Limits: Edit Data...
Type
editable name of the corresponding kept
edit the tolerance limits for the related measurement
(not yet implemented)
(applies only for single-value results)
selectable color of the corresponding curve
selectable line style (stroke) of the corresponding curve
Interpolation
o Linear
o Steps
Add Source
the displayed result curve is drawn by connecting neighbored points directly via straight lines.
the displayed result curve is drawn by drawing horizontal lines between neighbored points.
click on this button to select and place another measurement on the worksheet.
Example of harmonics line graph with linear (left) and stepwise (right) interpolation
© 2015 NTi Audio AG, MBe
Measurements, results, calculations
189
Line Graph Collector
The line graph collector automatically keeps and
shows all acquired measurement curves.
Highlight a specific curve
hover with the cursor
over the curve of interest or select it via the
properties (see below)
Read out the data of any measurement point
hover with the cursor over the curve of interest
(displayed in blue color).
Keep a recorded curve to use it as calculation item
right-click on the curve and select "Keep Curve".
To delete a specific or all curves,
o right click on a curve and select "Delete", or
o right click on the graph and select "Delete All
curves".
Temporarily disable the curve collection, while the measurement function stays active (i.e. every new curve is
shown, but not kept)
right-click on the graph and de-select "Keep All Curves" (vice versa, tick the menu to reactivate the collection of curves).
There are two ways to copy data from the graph to the clipboard (refer also to the explanations below).
a) Right-click on a curve and select "Copy Data"
copies the numerical data of that curve to the clipboard.
b) Left-click on the button in the top bar of the graph
the numerical data of all curves and the graph itself
(in bitmap format) are copied to the clipboard.
Amend the graph scaling
right-click on the graph and select "Edit Scale...", "Y Axis" or "X Axis".
Zoom in by moving the mouse over the area of interest while holding the left mouse button.
Return to the full view by double-clicking on the graph with the left mouse button.
Header
editable name of the line graph collector.
Source Active
o On
the collection of curves is active
o Off
completely disables the curve collection
(line graph collector becomes shaded =
measurement inactive).
Unit
selectable measurement unit (Y-axis).
Limits: Edit Data...
edit the tolerance limits o for
the related measurement.
Type
(not yet implemented)
Interpolation
o Linear
the displayed result curve is drawn
by connecting neighbored points directly via
straight lines.
o Steps
the displayed result curve is drawn
by drawing horizontal lines between
neighbored points.
Keep All Curves
o checkbox ticked
curve collection is active
o checkbox cleared
the collection of curves is
temporarily disabled, while the measurement
function stays active (i.e. every new curve is
shown, but not kept).
© 2015 NTi Audio AG, MBe
190
FX-Control User Manual
To use a specific or all collected curves as reference data for a calculation,
o click on the "Create Calculation Item..." button
a panel opens to define the function and parameters of
the required data processing (e.g. maximum data + 3 dB offset)
To copy the numeric data of a specific curve to the clipboard, right-click on the curve in the list of kept curves
and select "Copy Data" (refer also to the explanations below).
To delete a specific or all curves,
o right-click on the specific curve in the list of kept curves and select "Delete",
o click on the "Delete all" button to delete all collected curves at once.
© 2015 NTi Audio AG, MBe
Measurements, results, calculations
191
Post-processing of recorded curves
Copy data to the clipboard
a) Left-click on the button in the top bar of the graph display
displayed curves to the clipboard
b) Right-click on a curve and select "Copy Data"
clipboard
copies all numerical data and the graph with all
copies only the numerical data of the corresponding curve to the
Paste data from the clipboard
The contents that are pasted from the clipboard depend on the type of target program and the paste command.
Paste command
Target program
Text editor
a) press <Ctrl> + <V> button
b) use "paste special" feature
only numerical data
only numerical data
Spreadsheet or desk top
publishing2 program
only numerical data
numerical data and graph
Image editor
only graph
only graph
1
1
: e.g. MS Excel
2
: e.g. MS Word
Hint
Please refer also to the 'Full Resolution' results export feature
© 2015 NTi Audio AG, MBe
192
8.6.4
FX-Control User Manual
Passed/Failed display
In order to add a PASSED / FAILED display, proceed as follows:
1. Activate or select the related measurement
2. Define appropriate tolerance limits for the measurement
3. Place the Passed/Failed display on the worksheet as follows: either
left-click on the button 'Passed/Failed display' in the Worksheets ribbon, or
right-click on the measurement function in the worksheets toolbox.
Properties
Header
editable name of the Passed/Failed display
Source
connected measurement function
Active
switch to 'Off' to de-activate the measurement
Unit
Limit
NOTE With the calculations feature it is possible to combine the outcome of several measurements in an
overall Passed/Failed display
© 2015 NTi Audio AG, MBe
Measurements, results, calculations
8.6.5
193
Data logging
FX-Control supports a comprehensive data logging feature that automatically saves the recorded measurement
results to a file.
1. Click on the 'Enable' button in the Logging ribbon to enable the automated data logging
2. Adjust the logging settings via the corresponding button
Select the Default Folder
File Type
o CSV
character-separated values
o Text
o XLSx
tabbed text file
compatible to MS XLSx format (Note: this logging format may slow down the process)
Renewal Conditions
o Never
all measurement results are saved to a single file
o Weekly
o Daily
a new target file is opened at the beginning of a new calendar week
a new target file is opened at the beginning of every new day
o At Each Measurement
the result data of every measurement cycle is written to an individual file
Example
Logged frequency response data imported to MS Excel
NOTE Please refer also to chapters Full resolution data, States and Template for build report for an
alternative data logging method.
© 2015 NTi Audio AG, MBe
194
FX-Control User Manual
8.6.6
Full resolution results
FX100 allows to store full resolution data on the controller PC (i.e. all samples that were acquired during the
measurement process). The Full Resolution upload capabilities are supported in the Meter or GlideSweep mode,
single or repeat measurements, and following functions.
Meter mode
o Frequency domain (i.e. FFT spectrum)
GlideSweep mode
o Impulse response
o Time domain (i.e. FFT scope recording)
o Energy-Time Curve
Depending on the measurement function, the full resolution data can thereby be saved in four different file formats.
i. CSV: comma-separated values
ii. Text: tabbed text
iii. Matlab: *.MAT file (including variables)
iv. WAV: integer @ 24 bit resolution, or floating point @ 32 bit resolution
Procedure
a) Adjust the 'Full Resolution Result Logging Options'
Select the Default Folder
File Type
o CSV
character-separated values
o Text
o Matlab
tabbed text file
*.MAT file for direct import into the MATLAB software
o Int24bit WAV
o Float WAV
integer WAV file @ 24 bit resolution
float WAV file @ 32 bit resolution
Adjust the Analog Peak Level Reference (only required for WAV files)
The maximum allowed input level,
i.e. if the incoming signal shows a higher level, clipping occurs in the WAV file.
b) Activate the measurement(s) of interest, i.e. drag & drop them to the 'Worksheet'.
FFT in Domain "Time" or "Frequency"
GlideSweep Impulse response or ETC
c) Activate the 'Write Full Res. Results to File' in the properties of the corresponding measurement.
d) Initiate the measurement(s); the system will consequently
1. sample the data
2. calculate & display the acquired results
3. transfer the full resolution data to the target file
NOTE Full Resolution results are not available for continuous measurements
Hint
The data transfer of a full resolution data file to the controller PC may take a couple of seconds.
© 2015 NTi Audio AG, MBe
Measurements, results, calculations
8.7
Calculations
The calculations feature is a powerful tool for processing acquired data in various ways and creating new,
customized analyses.
A calculation typically comprises different elements, such as single or combined measurement results,
mathematical formulas, unit conversions etc.
Examples
Overall Passed/Failed
Calculated power
Aging process recording
How to create a calculation
1. Establish the test setup and reproduce it in the Hardware & Wiring view.
2. Activate & record the required measurements and tolerance limits.
3. Add the required standard or generic calculation items.
4. Define the calculation with these calculation items and the required mathematical operators.
5. If required, define & apply individual tolerance limits for the calculation item.
NOTE Before a calculation can be established, the required calculation items have to be defined.
© 2015 NTi Audio AG, MBe
195
196
FX-Control User Manual
8.7.1
Calculation items
There are three classes of calculation items.
Kept curves
Generic calculation item
Manually kept curves from an
executed StepSweep or
GlideSweep measurement.
A calculation item that contains
and executes a user-defined
formula.
Default calculation items
Calculated Passed/Failed
Overall Passed/Failed
Unit Converter
Linear Interpolation
Smoothing
Relative Response
Previous Result
Linear Fit
Sample Rate Deviation
Hint
All defined (i.e. available) calculation items are listed in alphabetical order the worksheets toolbox.
Thus, you may group the items according to your demands by editing their names.
Please refer to chapter 'Calculation example' for further details.
Generic calculation item
Step 1 - Open the 'Calculation Item' panel
Click on the 'New Calculation' button in the worksheets ribbon to open the 'Calculation Item' dialog box.
If desired, edit the name of the generic calculation item (optional)
Step 2 - Select a source
Click on the 'Add Parameter' and select the data source for the generic calculation item, e.g.
an already active or a new measurement
a calculation item that has already been defined
Hint
The 'Tree' comprises all measurement functions and existing calculation items, whereas the
alternate tab lists only measurement functions.
© 2015 NTi Audio AG, MBe
Measurements, results, calculations
Consequently, the selected data source is added to the 'Calculation Item' dialog
If desired, amend the name of the new data source (e.g. 'X1' -> 'Level1')
Add further data sources according to your requirements.
Step 3 - Define the calculation instruction
Define the formula that processes the data
sources with
mathematical operators,
boolean operators or
specific operators of FX-Control.
Assign an appropriate result unit of measurement
to the new calculation item.
If the formula is incorrect, an error message will
appear.
© 2015 NTi Audio AG, MBe
197
198
FX-Control User Manual
Special hint – Calculation of curves
If two or more curves shall go into the same calculation, they first have to be aligned regarding their X-values (i.e.
number of points, spacing). This alignment is done as follows.
Master curve: X1
Slave curve: X2
Command: X2.LinearInterpolation(X1)
Effect: the X-axis points of curve X2 are aligned to the X-axis points of curve X1 (via linear interpolation)
Hint The interpolation is by default carried out logarithmically on the x-axis, and linearly on the y-axis.
The interpolation of the X/Y-axis can also be carried out in a different way via the following parameters.
a) Xlog/Ylin: X2.LinearInterpolation(X1, eTolInterpolationType.Logarithmic, eTolInterpolationType.Linear)
b) Xlog/Ylog: X2.LinearInterpolation(X1, eTolInterpolationType.Logarithmic, eTolInterpolationType.Logarithmic)
c) Xlin/Ylog: X2.LinearInterpolation(X1, eTolInterpolationType.Linear, eTolInterpolationType.Logarithmic)
d) Xlin/Ylin: X2.LinearInterpolation(X1, eTolInterpolationType.Linear, eTolInterpolationType.Linear)
© 2015 NTi Audio AG, MBe
Measurements, results, calculations
Default calculation items
Hint
The term 'Input' hereunder refers to
acquired measurement results (single values or curves)
the output (result) of another calculation item
Item
Checks the input of the calculation item
against generic tolerance limits.
NOTE The generic tolerance limits
must be defined before the
Calculated Passed / Failed
item is added.
Checks, whether all input parameters (i.e.
results of the selected items) are Passed;
if one or more results are Failed, the
overall result is Failed, too.
© 2015 NTi Audio AG, MBe
Example
199
200
FX-Control User Manual
Opens a panel that allows to convert the
unit of an acquired measurement; the
panel includes the available constants that
may be used for the calculation (e.g. for
converting the acoustic signal run-time
into distance by considering the ambient
temperature).
Interpolates the Y-value of the measured
curve at an user-defined point of the Xaxis.
NOTE The linear interpolation is
executed graphically – the
scaling of the X-, Y-axis (linear
or logarithmic) therefore has a
direct impact on the result.
The interpolated level @ 1 k Hz of the recorded curve = -57.33 dBV
© 2015 NTi Audio AG, MBe
Measurements, results, calculations
201
Flattens the measurement curve by
averaging the acquired results within a
window that has a user-defined width.
Green curve: original measurements / Pink curve: smoothed result
curve (1/6th Octave smoothing window)
Plots the acquired result curve relative in
dB to the Y-value of a reference point at
an user-defined X-value
Green: absolute results / Red: results relative to 0 dB @ 1 k Hz
Creates a user-defined curve, that can be
used e.g. as generic tolerance limit for
Calculated Passed / Failed items, or as a
'golden' reference curve for deviation
measurements.
Green, red curves: user-defined custom curves
Shows the last-but-one result curve; the
previous result curve can be shown in the
same graph as the last (i.a. actual) result
curve, or in a separate graph.
Green curve: last (i.e. current) measurement / Pink curve: last-but-one
measurement
© 2015 NTi Audio AG, MBe
202
FX-Control User Manual
Calculates a straight line that represents
the optimum linear fit to the measured
curve.
Green curve: amplitude sweep result / Pink curve: linear fit
Shows the deviation of the sample rate,
measured versus the standardized digital
sampling rates, whereby the input must
be one of the following measurements
Frequency
AES input sample rate
Sync input sample rate
Deviation vs. 48 k Hz sample rate
(standard digital sampling frequencies are 32 k Hz, 44.1 k Hz, 48 k Hz,
88.2 k Hz, 96 k Hz, 176.4 k Hz, 192 k Hz)
NOTE The frequency measurement
must be expressed in [Hz]
Extracts the data of a restricted, userdefined frequency band from within the full
range of measured results.
Green dotted curve: measured results / Red curve: selected subrange
200 Hz – 5 k Hz
© 2015 NTi Audio AG, MBe
Measurements, results, calculations
8.7.2
Operators, units
Mathematical
+
plus
-
minus
*
multiply by
/
divide by
Boolean
<
<=
>
>=
&
smaller than
smaller than or equal to
larger than
larger than or equal to
and
AND(a,b) and
|
or
OR(a,b)
or
!
not
NOT(a)
not
Functions
Acronym
Description
adB
Inverse decibel function
Abs
Absolute value
dB
Decibel function
Exp
Exponential function
Log
Natural logarithm
Log10
Logarithm to the base 10
Max *
Maximum value
Mean *
Arithmetic mean value
Min *
Minimum value
Pow
to the Power of
Rms *
Root mean square
Rss *
Root sum square
(quadratic sum)
Sqrt
Square root
Sigma *
Standard deviation (n)
Stdev *
Standard deviation (n – 1)
Sum *
Arithmetic sum
© 2015 NTi Audio AG, MBe
Mathematical formula
203
204
FX-Control User Manual
*: Calculations that can have either a scalar or vector input parameter (scalar "x", e.g. level result – vector "X", e.g.
frequency response)
a. if the input parameters are two scalars, the result is a scalar: y = func(x 1,x 2)
b. if the input parameter is a vector, the result is a scalar: y = func(X)
c. if the input parameters are vectors, the result is a vector: Y = func (X1,X2,...Xn)
Calculation Result Units
Unit
Measurement
Comment
A
Current
I [A] = Volt / Impedance
dB
Decibel
20*log(V1 / V2)
dBPa
Sound pressure
Sound pressure relative to 1 Pascal
dBu
Level
Voltage relative to 0.775 V
dBup
Peak level
Peak voltage relative to 0.775 V
dBV
Level
Voltage relative to 1 V
dBV / Pa
Microphone sensitivity
dBVp
Peak level
Peak voltage relative to 1 V
deg
Phase
0°...360°
Deg C
Temperature
Centigrade
Hz
Frequency
mV / Pa
Microphone sensitivity
Ohm
Impedance
Pa / s
PureSound steepness
%
Distortion, XTalk
%Tol
Pascal per second
this unit is used for calculated tolerance limits
rad
Phase
s
Time
V
Level
V/s
PureSound steepness
Vp
Peak level
W
Power
- ...+
Volt per second
Power [W] = Volt2 / Impedance
© 2015 NTi Audio AG, MBe
Measurements, results, calculations
8.7.3
205
Calculation examples
The following application examples demonstrate the process of establishing a calculation.
Hint
Please refer also to chapter 'Sequences'
Example 1 – Difference between two measurement curves
Calculate the difference between two frequency response curves that have been acquired at different microphone
positions.
∆ = Curve1 - Curve2
Step 1 - Test setup
Establish the internal and external connections between the FX100 instrument, the DUT (Device Under Test) and
the two microphones.
Step 2 - Adjust the test parameters
Enter the appropriate generator, analyzer settings (e.g. GlideSweep output level & input range)
Activate the required measurements (i.e. chn1 level; chn2 level)
© 2015 NTi Audio AG, MBe
206
FX-Control User Manual
Step 3 - Establish the
calculation
Click on the 'New
calculation' button in
the worksheets ribbon.
Add the level,
impedance
measurements as data
sources.
Enter the formula that
calculates the
difference: "Level1Level2".
Assign the
measurement unit 'dBV'
to the calculated result.
Consequently, a result display is opened on the worksheet that shows the calculated difference.
© 2015 NTi Audio AG, MBe
Measurements, results, calculations
Example 2 – Power consumption of a DUT
Measuring the power consumption of a DUT by using the formula P [W] = U2 / R
U = voltage at the DUT input connectors
R = impedance of the DUT
Step 1 - Test setup
Establish the internal and external connections between the FX100 instrument and the DUT.
Step 2 - Adjust the test parameters
Enter the appropriate generator, analyzer settings (e.g. GlideSweep output level & input range)
Activate the required measurements (i.e. chn1 level; chn2 speaker impedance)
© 2015 NTi Audio AG, MBe
207
208
FX-Control User Manual
Step 3 - Establish the
calculation
Click on the 'New calculation'
button in the worksheets
ribbon.
Add the level, impedance
measurements as data
sources.
Enter the formula that
calculates the power:
"(Level1*Level1)/Imped2"
Assign the measurement unit
'W' to the calculated result.
Consequently, a result display is opened on the worksheet that shows the calculated power curve.
© 2015 NTi Audio AG, MBe
Measurements, results, calculations
Example 3 – Stereo headphone qualification
The application verifies, whether the left and the right speakers of a headphone match to each other. The test
measures the frequency response of the two channels and compares the acquired results to each other by
calculating
the SPL of both speakers @ 1 kHz,
the deviation in the frequency response.
Step 1 - Test setup
a.
Establish the internal and external connections between the FX100 instrument and the DUT.
© 2015 NTi Audio AG, MBe
209
210
FX-Control User Manual
Step 2 - Adjust the test
parameters
b.
Enter the appropriate
generator, analyzer settings
(e.g. StepSweep bandwidth,
output level)
c.
Activate the required
measurements (i.e. chn1/2
speaker impedance, chn3/4
level)
Step 3 - Establish the calculations
d.
Click on the 'Linear interpolation' button in the worksheets ribbon and select the input: Measurement
StepSweep
Level Channel 3.
e.
Repeat step d. for Channel 4
f.
Click on 'New Calculation', select the input parameters Measurement
the calculation formula "X1 - X2" and select the result unit [dB].
StepSweep
Level Channel 3, edit
© 2015 NTi Audio AG, MBe
Measurements, results, calculations
g.
Run the measurement.
© 2015 NTi Audio AG, MBe
211
212
FX-Control User Manual
Example 4 – Custom tolerance limits for calculated Passed / Failed
The example checks the Calculated Passed / Failed frequency response of an active loudspeaker against two
custom curves that act as upper / lower tolerance limits.
Step 1 - Establish test setup and record the frequency response
a.
Connect the active speaker and the measuring microphone to the FX100 instrument.
b.
Measure the frequency response of a golden sample (i.e. a good working loudspeaker).
Step 2 - Customize & use the tolerance curves for calculated Passed / Failed
c.
In the 'Worksheets' ribbon, click on the button 'New Calculation' and 'Custom Curve'.
d.
Change the name of the custom curve to "Limit HI" and enter the X/Y values so that they represent the upper
tolerance limit.
© 2015 NTi Audio AG, MBe
Measurements, results, calculations
213
e.
Edit the data, i.e. the X/Y values of the upper tolerance curve according to your demands.
f.
Repeat the same procedure for the lower tolerance curve.
g.
Optional: you may drag & drop the two curves (Limit HI, Limit LO) from the toolbox to the panel with the Golden
Sample measurement result, in order to verify the definition of the two limit curves.
© 2015 NTi Audio AG, MBe
214
FX-Control User Manual
f.
Add a 'Calculated Passed / Failed' item and select the measurement function as input, and the two custom
curves as Limit High, Limit Low
g.
Every further measurement will be consequently checked against the two limit curves, and the outcome
displayed via the Calculated Passed / Failed panel.
© 2015 NTi Audio AG, MBe
Part
IX
216
9
FX-Control User Manual
Tolerance limits
A measured or calculated result can be checked against user-defined tolerance limits, thus providing a PASS/FAIL
classification. Tolerance limits...
...can be edited & applied for Meter or StepSweep / GlideSweep measurements, or calculated results,
...can be defined as absolute or relative values,
...are adaptive to the type of measurement (e.g. distortion
only upper limits),
...in a sequence can only be edited if the corresponding state is active (i.e. selected),
...are defined independently for the analog, digital domain,
...are saved in the project file.
There are basically two ways to save & apply tolerance limits,
I. by the FX100 device,
II. by FX-Control software.
NOTE Software limit amendments will be shown immediately, whereas changes to a device limit
become only visible after execution of the next measurement.
FX100 device tolerances
FX-Control software tolerances
FX100 check s the measurement data vs. the on-board
tolerance limits
The controller PC check s the received measurement
data vs. the tolerance limits
FX100 device tolerances are defined via the properties
of the measurement graph; the limits are then saved &
applied by the FX100 device.
FX-Control tolerance limits are defined by using
calculation items; the limits are then saved & applied
by the software.
The result stream from the FX100 device to the
controller PC contains the acquired measurement
data and the overall PASS/FAIL information.
The data stream from the FX100 device to the
controller PC contains only the acquired results (i.e.
no PASS/FAIL classification)
Those measurement results that are beyond the
tolerance limits can not be highlighted in the result
graph.
All measurement points beyond the tolerance limits
are highlighted individually in the FX-Control result
graph
© 2015 NTi Audio AG, MBe
Tolerance limits
9.1
217
Device limits
Device tolerance limits are defined via the properties of the corresponding measurement function, and then stored &
applied by the FX100 device.
NOTE After amending the device limits, you have to run a measurement to apply them.
A) Absolute limits
A1) Single-value measurements
1.
Place the numerical measurement
display in the WorkArea and click
on it.
2.
In the display properties, enter the
required values for the "Limit High"
and "Limit Low".
3.
Add a Passed/Failed display and
link it to the measurement.
A2) Sweep, FFT measurements
1.
Place the graphical measurement
display in the WorkArea, execute a
measurement and click on the result
display.
2.
In the properties of the measurement
display, click on the "Edit Data..."
button. Consequently, a new window
opens with a graph that shows the
last recorded measurement curve.
3.
Define the individual upper & lower
tolerance limits, either graphically or
numerically (see below)
3a. Graphical limit definition.
i. Right-click on the graph,
ii. select "Add High Point..." or
"Add Low point...",
iii. click to the corresponding spot
on the graph to add an upper or
lower tolerance limit,
iv. slide any point to a different
position with the left mouse
button if necessary, and
v. repeat steps i.-iv. as many times
as required to establish the
tolerance band.
NOTE At least the first Low Point must be placed below the lowest High Point (and vice versa).
© 2015 NTi Audio AG, MBe
218
FX-Control User Manual
Hint
The scaling can be amended
by right-clicking on the graph
and selecting 'Edit Scale...'
With the 'Copy', 'Paste' menu
entries it is possible to
exchange the tolerance
amongst identical
measurements (e.g. level
chn1
chn2)
3b. Numerical limit definition.
i. Right-click on the graph and
select "Edit Data...".
ii. Enter the frequency / tolerance
values and click on 'Add'.
iii. Tick the checkbox 'ShapeEnd' if
no tolerance limits shall be
applied beyond the
corresponding point (i.e.
measurement results beyond
that point are always rated 'don't
care'). If another tolerance limit is
added at a higher frequency, the
tolerance band continues from
that point onwards. The tolerance
limit with the highest frequency
has always a 'ShapeEnd'.
iv. Add the 'Low' tolerance limits (if
applicable).
v. Click on 'OK' to terminate the
definition process.
4.
Execute a measurement to display
the edited tolerance limit, and to
verify if the recorded curve is within
the limits.
5.
Add a Passed / Failed display and
link it to the measurement to show
the outcome of the test.
© 2015 NTi Audio AG, MBe
Tolerance limits
B) Relative tolerance limits
B1) Limits based on a single
'Golden Sample'
1.
Place the measurement graph in the
WorkArea and acquire the reference
measurement(s) by using a single
'Golden sample'.
2.
Keep the recorded curve and
optionally rename it (e.g. "Golden
Sample")
3.
Create a generic calculation item via
the 'Worksheets' ribbon, optionally
rename it (e.g. "High" or "Low"),
click on "Add Parameter" and select
the kept "Golden Sample" curve.
4.
Enter the Formula for the upper or
the lower limit, select the correct
Result Unit and click on
"OK" (optionally you can show the
two limit curves in the same graph
via drag & drop of the "Low" item
over the "High" graph in the
WorkArea).
5.
Right-click on the "High" or the
"Low" limit curve and select 'Copy
Data' from the pop-up menu.
6.
In the 'Source' properties of the
measurement graph, click on the
'Edit Data...' button
a graph
opens that shows the last recorded
curve.
7.
Right-click on the graph and select
"High
Paste" to use the
copied curve as upper limit,
"Low
Paste" to use the copied
curve as lower limit.
8.
Click on 'OK' to confirm (or abort via
'Cancel').
© 2015 NTi Audio AG, MBe
219
220
9.
FX-Control User Manual
Add a Passed / Failed Display and
link it to the measurement.
10. Run a measurement to show the
device limits, the last measurement
curve and the Passed / Failed result.
Hint
Those measurement results
that are beyond the device
limits (i.e. failed) can not be
highlighted
B2) Limits based on multiple
references
1.
Place a Line Graph Collector in the
WorkArea and acquire the reference
measurement(s) by using a decent
number of good working samples.
2.
In the properties of the measurement
graph, click on the button "Create
Calculation Item...", then select
Max, Min, Mean or RMS and enter
the + or – tolerance headroom for
the High or Low limit, respectively.
3.
If required, repeat step 2. for the
alternate limit.
4.
Drag & drop the two calculation
items "High" and "Low" to the
WorkArea.
5.
Right-click on the upper curve and
select "Copy Data" from the pop-up
menu.
© 2015 NTi Audio AG, MBe
Tolerance limits
6.
In the 'Source' properties of the Line
Graph Collector, click on the 'Edit
Data...' button
a graph opens that
shows the last recorded curve.
7.
Right-click on the graph and select
"High
Paste" to use the
copied curve as upper limit,
"Low
Paste" to use the copied
curve as lower limit.
8.
Click on 'OK' to confirm (or abort via
'Cancel').
9.
Place a measurement graph in the
WorkArea, together with a Passed /
Failed display and run the
measurement(s).
Hint
Those measurement results
that are beyond the device
limits (i.e. failed) can not be
highlighted
© 2015 NTi Audio AG, MBe
221
222
9.2
FX-Control User Manual
Software limits
Software tolerance limits are defined by using the 'Calculated Passed / Failed' calculation item, and then stored &
applied by FX-Control.
There are three ways to define software limits.
A) Based on a single
measurement curve
B) Based on several measured C) Based on a manually edited
curves
curve
Example: Single reference curve ±3 Example: Min/Max of collected curves Example: Microphone limits acc. IEC
dB
±6 dB
61672
A) Software limits based on a single 'Golden Sample'
1.
Adjust the generator settings and place the required
measurement graph(s) in the WorkArea.
2.
Connect the reference DUT to the FX100 and run the
measurement(s).
3.
Keep the recorded curve(s); optionally rename it/them,
e.g. 'Golden Sample'.
4.
Create a generic calculation item; optionally rename it
(e.g. "High" or "Low").
5.
Click on the 'Add Parameter' button, select the
previously saved 'Golden sample' curve and define the
Formula for the + or – tolerance headroom of the upper
or lower tolerance limit.
6.
Select the 'Result Unit' of the current measurement and
click on "OK".
7.
Optionally repeat steps 4. to 6. to create the opposite
limit.
8.
Open a 'Calculated Passed / Failed'
Passed / Failed' pop-up opens.
9.
Click on the
button on the right hand side of the line
labeled 'Input' and select the active measurement.
the 'Calculated
10. Click on the
buttons on the right hand side of the
lines "Limit Low / High", select the corresponding
calculation items (as defined in steps 4. to 7.) and click
on "OK".
© 2015 NTi Audio AG, MBe
Tolerance limits
223
The software limits are now ready for application
as soon as you run a measurement, the acquired data will be
checked against the Low, High limits and the Passed / Failed result is displayed
Click on the button
panel to show the
in the top bar of the Passed / Failed
tolerance limits (green band),
last acquired result curve (green line),
failed measurement points (green rectangles).
Normalized result (alternate display mode)
It is also possible to display the result curve in a normalized
way, where only the deviations of the acquired measurement
data from the Golden Sample are shown (i.e. flat line =
perfect compliance of the measured device with the Golden
Sample).
i.
Execute steps 1. to 7. as above.
ii.
Create a generic calculation item (e.g. labeled
"Deviation").
iii. Select the Golden Sample and the current measurement
as inputs and enter the Formula that subtracts these two
inputs from each other.
iv. Select the Result Unit "dB" and click on "OK".
v.
Repeat steps 8. to 10., but select the "Deviation" item
as Input
© 2015 NTi Audio AG, MBe
224
FX-Control User Manual
vi. Click on the button in the top bar of the Passed /
Failed panel to show the normalized result graph with
the tolerance band and the failed measurement points.
B) Software limits based on multiple reference samples
1.
Adjust the generator settings and
place a Line Graph Collector of the
required measurement function in
the WorkArea.
2.
In the properties of the Line Graph
Collector, click on the button
"Create Calculation Item...", then
select Max, Min, Mean or RMS and
enter the + or – tolerance headroom
for the High or Low limit,
respectively.
3.
If required, repeat step 2. for an
alternate limit.
4.
Click on the button 'Calculated
Passed / Failed' in the 'Worksheets'
ribbon, select the measurement
function and assign the Low, High
limits (i.e. the corresponding items
from steps 2., 3.).
© 2015 NTi Audio AG, MBe
Tolerance limits
Optionally click on the button in the
top bar of the Passed / Failed panel to
show
tolerance limits (green band),
last acquired result curve (green line),
failed measurement points (green
rectangles).
Semi-automated tolerance
update procedure (option)
a.
Execute steps 1. to 4. as described
above.
b.
Record more curves in the Line
Graph Collector
c.
In the properties of the Line Graph
Collector, click again on the button
"Create Calculation Item...", select
the required Function (e.g. Max) and
optionally amend the Displacement.
d.
As soon as you confirm via the
"Create" button, a pop-up will appear
that asks you, whether the existing
Calculation Item shall be
overwritten?
Click on OK to
confirm.
Consequently, the old tolerance limits
will be replaced by new ones that are
based on the larger number of recorded
curves and the amended offset.
C) Manually edited (generic) software limits
1.
In the 'Worksheets' ribbon, click on
the
"New Calculation")
button (under
2.
Amend the name of the custom
curve
3.
Click on "Edit Data..."
© 2015 NTi Audio AG, MBe
225
226
FX-Control User Manual
4.
Select the appropriate unit(s).
5.
Define the requested curve by
editing the corresponding points
Add points by entering the X-, Yaxis value in the bottom line and
clicking on the "Add" button
(gaps between neighbored points
will be interpolated linearly).
Amend the values of existing
points directly.
Delete obsolete lines from the
table by clicking on the
button.
6.
Confirm by clicking on "OK".
7.
Optionally repeat steps 1. - 6. to
define the opposite limit (lower
upper).
8.
Click on the button 'Calculated
Passed / Failed' in the 'Worksheets'
ribbon, select the measurement
function and assign the Low, High
limits (i.e. the corresponding items
from steps 1. - 7.).
9.
Optionally click on the button in
the top bar of the Passed / Failed
panel to show
tolerance limits (green band),
last acquired result curve (green
line),
failed measurement points (green
rectangles).
© 2015 NTi Audio AG, MBe
Part
X
228
10
FX-Control User Manual
Sequences
The sequence feature is accessible via the 'Start' ribbon.
A sequence can be described as the automated execution of consecutive states and steps, which have been edited
by the operator, e.g.
customized measurements (Meter, StepSweep or GlideSweep)
interactions with the user (e.g. prompt, input request)
program calls (e.g. run executable)
delays
activate a specific sheet (i.e. bring it to the front view)
data outputs (processing of manually entered or measured values)
build reports (exports selected data to a document)
The states, steps can be arranged arbitrarily within a sequence and are executed in the defined order, whereby
the wiring applies globally on all states of the sequence
the routing (e.g. active I/O channels) can be defined individually for every state
the generator, analyzer settings (e.g. output level, active filters) and measurement functions are activated
individually for every state, whereby the panels stay permanently visible in the WorkArea
the calculation items are global, though the corresponding inputs may be taken from an individual state
the regulators are global; their outcome may be applied to all states, or on a single state only.
A) Set up procedure
A1) Establish the sequence
Hint
Before you define a new sequence, it is strongly recommended to clear all panels from the
WorkArea or to open a new project.
1. Enter the sequence mode by clicking on the button 'Sequence Mode' in the Start ribbon
2. Define the wiring
3. Create the required states (see below)
4. Click on 'Run' to execute the complete sequence
5. Save the sequence and all related states in a project
© 2015 NTi Audio AG, MBe
Sequences
229
A2) Edit & arrange the states, steps
1. Create a new state by clicking on 'New'.
2. Adjust the contents of the new state (or edit an existing state) as follows
o Select the state by clicking on 'State x'
o Define the routing (e.g. active channels of the generator, analyzer or SIL, SIH boards or input/output
switchers)
o Adjust the generator, analyzer settings
o Activate the measurements and define the tolerance limits
o Define the calculation items (optional)
o Introduce the regulators (optional)
3. If required, delete a selected state by clicking on 'Del'.
4. Save the project to secure the definitions or changes.
Hints
Only the settings of the active (i.e. selected) state can be edited.
The states must be established in the same order as they shall be executed in the sequence.
If a new state is added, all settings & items of the previous state are duplicated
to paste the corresponding items on a new worksheet.
Use the clipboard
Only one sequence can be defined & saved per project.
B) Behavior of wiring, panels, regulators, calculation items
B1) Wiring, routing
General rules
Within a sequence, the wiring is global, i.e. it applies for all states of the sequence.
On the other side, the routing of the involved channels is individual for every state, i.e. can be changed within the
sequence.
Example
State 1: Wiring = global / Routing = state-dependent
© 2015 NTi Audio AG, MBe
State 2: Wiring = global / Routing = state-dependent
230
FX-Control User Manual
B2) Panels
General rules
All panels (e.g. generator settings, result displays) that are placed in the WorkArea remain visible throughout all
states.
If a panel is added to the WorkArea just after the sequence mode has been entered, i.e. before any state has
been added, it remains active for all states.
If a panel is added in a specific state, it applies only for that state, whereby the panel's name is preceded by
"Sx" (x = state-#).
Example
Global generator settings and individual measurement results of state 1, state 2
© 2015 NTi Audio AG, MBe
Sequences
231
B3) Regulators
General rules
Regulators can not be initiated by a sequence, i.e.they have to be controlled manually.
The outcome of a Regulator procedure however can be applied to all states or to the current state only (via the
properties of the regulator).
Example
Regulator is applied on the current state only
B4) Calculation items
General rules
Calculation items are global, i.e. they are always active.
The input parameter(s) for a calculation item however may be taken from a specific state.
Example
Calculation item uses the Generator Level Channel1 as defined in state #2
© 2015 NTi Audio AG, MBe
232
FX-Control User Manual
C) Sequence execution
C1) Manual controls
or F5 or
or F6
Starts the sequence (single shot)
Starts the sequence in repeat mode
Executes the selected state only
Executes the selected state in repeat mode
or F8 Stops the sequence execution
C2) Auxiliary trigger
A sequence can be initiated by an externally
generated trigger signal (e.g. from a PLC or
foot switch etc.) that is connected to the
auxiliary I/O interface.
1.
Tick the checkbox 'Aux Trigger Bit' to
enable the external trigger.
2.
Select the trigger condition, i.e. the
auxiliary input bit (1...8) and the slope
type (positive / negative edge).
3.
Click on 'OK' to confirm the setting.
Hint
Hint
If only the Auxiliary Trigger is
enabled, i.e. without adding
further states or steps to define a
sequence, the software will only
execute the active measurement(s)
as soon as the trigger signal
arrives.
Auxiliary trigger setup
As soon as the sequence execution is started, the previously acquired active measurement or
calculation results are cleared.
© 2015 NTi Audio AG, MBe
Sequences
10.1
233
Establish a sequence
Step 1
Establish the basic wiring (i.e. all firm devices & connections)
Step 2
i.
Enter the sequence mode by clicking on the button 'Sequence Mode' in the Start ribbon and click on
Hint
ii.
Before you define a new sequence, it is strongly recommended to clear all panels from the
worksheet or to open a new project.
Amend the internal FX100 routing (e.g. output/input switcher routing) or connector states (e.g. mute On/Off,
bias) if required.
iii. Click on the dialog box launcher, select the measuring modes that shall be active (Meter, StepSweep or
GlideSweep) and click on 'OK'
iv. Customize the state, i.e.
a) adjust the generator, analyzer settings and the active measurements according to your demands,
b) add and edit special actions via the 'Sequencer Dialog' window if required,
c) rename a state by clicking on
© 2015 NTi Audio AG, MBe
or on 'Edit' in the 'Sequencer Dialog' window.
.
234
FX-Control User Manual
Step 3
i.
Add more states by clicking on
ii.
If you want to copy the settings of a specific state to some or to all other states, click on
the source / destination state(s) and the applicable settings.
iii. Remove an obsolete state by clicking on
and select
or clear the whole sequence via
iv. Customize each state individually (as described under Step 2, ii.-v.)
Step 4
i.
Start the sequence by clicking on
or pressing the <F5> key.
ii.
Keep an eye on the trace in order to get notice of error messages.
iii. Save the setup with the sequence in a project.
© 2015 NTi Audio AG, MBe
Sequences
10.2
235
States, steps
Definition
A state is a customized collection of FX100 instrument settings, test parameters and measurements.
A step is a predefined action.
States (instrument settings)
When you add a new state to a sequence, you must adjust the following settings.
A) Measurement operating mode(s)
Minimum one measurement operating mode must be active
Meter
StepSweep
GlideSweep
Hint
If a state comprises 2 or 3 measuring modes, they are executed in the order Meter
GlideSweep
StepSweep
B) Test parameters
generator settings
analyzer settings
C) Measurements
Minimum one measurement function must be active.
Hint
The name of every state begins with an identifier (e.g. S1, S2, ...), followed by as description (e.g. ) .
The identifiers are invariant, whereas the descriptions can be edited by clicking on
'Sequence Dialog' window.
Example of edited state descriptions
© 2015 NTi Audio AG, MBe
or via the
236
FX-Control User Manual
Steps (predefined actions)
To add a step, click on the 'Add' button
in the 'Sequencer Dialog' window.
Consequently a menu appears with the
available actions,
Prompt
Input
Program
Delay
Activate Sheet
Data Output
Build Report
Aux Input
Aux Output
After having added a step to the
sequence, it can be
edited
disabled / enabled
deleted
moved within the sequence with
the 'Up', 'Down' buttons.
Hint
Keep in mind that a sequence may be triggered (started) manually or via the auxiliary I/O interface.
Prompt
Halts the sequence, and opens a dialog
box with customized text, that has to be
confirmed by the operator. For instance,
this feature allows to advise the
customer to perform a manual action
before the sequence can be continued.
1.
Select the menu 'Prompt', optionally
edit the Step Name and enter the
instruction text that shall be
displayed to the operator.
2.
Click on 'OK' to confirm your
definitions.
Prompt execution during a sequence
Operator takes no action
remains halted.
sequence
Operator clicks on the 'OK' button
sequence execution continues.
Operator clicks on 'Cancel'
sequence is stopped (aborted).
© 2015 NTi Audio AG, MBe
Sequences
237
Input
Halts the sequence and asks the
operator to enter a string. This string
then becomes available in the 'Data
Output' window or can be used for the
'Program' or 'Build Report'.
1.
Select the menu 'Input', optionally
edit the Step Name and enter the
instruction text that shall be
displayed to the operator.
2.
Click on 'OK' to confirm your
definitions.
Input execution during a sequence
Operator takes no action
remains halted.
sequence
Operator enters string and clicks on
'OK'
the software internally stores
the entered string and continues
executing the sequence.
Operator clicks on 'Cancel'
sequence is stopped (aborted).
Program
Runs an external program, which is
identified by a Command. The Command
may include argument(s). The sequence
may be halted during the program
execution. Furthermore, the sequence
can be aborted (canceled) if the
command exit code is not zero (0).
1.
Select the menu 'Program' and
optionally re-name the Step Name.
2.
Enter the command line, i.e.
o manually enter or paste the required command line string, or
o click on the
3.
button and select the executable vi the explorer.
Optionally enter the argument(s), i.e.
o manually enter or paste the required string, or
o click on the
button and select one of the listed arguments.
4.
Optionally tick the checkbox 'Wait for Program to Exit' if the sequence shall be halted until the execution of the
external program is finished.
5.
Click on 'OK' to confirm your definitions.
Program execution during a sequence
The external program is called as soon as the sequence has reached the corresponding point.
If the checkbox has been ticked, the sequence halts until the external program is finished
© 2015 NTi Audio AG, MBe
238
FX-Control User Manual
Delay
Halts the sequence during a user-defined
time.
1.
Select the menu 'Delay' and
optionally edit the Step Name.
2.
Enter the duration of the delay.
3.
Click on 'OK' to confirm your
definition.
Delay execution during a sequence
As soon as the sequence comes to
the corresponding point, it halts for the
defined duration.
If the operator clicks on 'Cancel'
sequence is stopped (aborted)
Activate Sheet
Brings the selected worksheet to the
front.
1.
Select the menu 'Activate Sheet',
optionally edit the Step Name.
2.
Click on the
button and select
the required worksheet.
3.
Click on 'OK' to confirm your
selection.
Activate Sheet execution during a sequence
As soon as the sequence is at the corresponding point, the selected worksheet is automatically shown in the front
view.
Data Output
Exports selected data to a user-defined target file in *.csv format.
1.
Select the menu 'Data Output' and optionally edit the Step Name.
2.
Optionally edit the path and the name of the target file.
3.
Click on 'Add' to select the data that shall be written to the target file. Consequently, the 'Edit Parameter'
window opens, wherein you have to
o enter a string for the Header (i.e. label of the saved contents),
o click on the
button and select the Content(s) that shall be saved in the target file.
© 2015 NTi Audio AG, MBe
Sequences
4.
239
Click on 'OK' to confirm your definitions.
Data Output during a sequence
As soon as the sequence is at the
corresponding point, the software
writes the selected data (i.e. header
and measured results) to the target
file.
Build Report
Exports selected data to a document
(e.g. MS Word template) that has been
defined by the user before.
1.
Select the menu 'Build Report' and
optionally edit the Step Name.
2.
Click on the
button and select
the Template File, to which the data
shall be exported.
3.
Assign a name to the Output File (Side note – the Output File is a copy of the Template File, to which e.g. the
test results are written). There are three alternatives to assign the name of the Output File,
i. No name (i.e. input box is left blank)
every time the sequence is executed, a new Output File is created
with the default name "<Step name><Date><Time>"
ii. Fixed name (e.g. "Result Sheet")
every time the sequence is executed, the one & only Output File gets
overwritten (Side note – requires the Post Build Action "Print")
iii. Indexed name (e.g. "$[Input x]")
every time the sequence is executed, an Output File is created with the
indexed name (Side note – if the indexed name does not change, the Output File gets overwritten)
4.
Select the action to be executed as soon as the contents have been exported.
5.
Open the Template File and enter the contents that shall be exported, e.g.
o the string that has been entered by the operator via the Input dialog
"$[Input x]",
o the numerical results of a Meter measurement
copy the string under "Header" from the properties of
the measurement function and paste it to "Output File".
6.
Click on 'OK' to confirm your selection
Hint
Using the Build Report requires advanced understanding of the program, in which the template has
been established; please refer to chapter Template for build report.
© 2015 NTi Audio AG, MBe
240
FX-Control User Manual
Aux Input
The sequence execution automatically
halts at every 'Aux Input' step and waits
until the corresponding 'OK Bit' is set via
the auxiliary I/O interface.
1.
Optionally edit the 'Step Name' or
'Text', i.e. the title or message of the
'Aux Input' dialog box.
2.
Select the 'OK Bit' (input pin 1...8),
and the 'Type' (positive or negative
edge) of the input signal.
3.
Optionally tick the checkbox 'Cancel
Bit' and select an input pin and 'Type'
to allow aborting the sequence via
the auxiliary I/O interface.
Hint
4.
If the 'Cancel Bit' is assigned
to the same pin as the 'OK Bit',
it is overruled by the latter.
Click on 'OK' to confirm.
Hint
As soon as the sequence
execution halts, the 'Aux Input'
dialog box pops up, as long as
the FX100 is waiting for the
Aux Input.
The operator may then
optionally force the sequence
to continue (i.e. FX100 does
no longer wait for the Aux
Input) by pressing the 'OK'
button, or cancel (i.e. abort)
the sequence execution by
pressing the 'Cancel' button.
© 2015 NTi Audio AG, MBe
Sequences
Aux Output
The software sets the status of the
FX100 auxiliary I/O interface pins as
defined by the user.
1.
Optionally edit the 'Step Name'.
2.
Click a button below the numbers
1...8 and define the status of the
corresponding bit.
o 'X'
don't care (no change)
o '0'
Output pin = LO
o '1'
Output pin = HI
o '...' + select an active
measurement or a Pass/Fail
calculation item from the list
Output pin = Boolean result
(Passed
1 / Failed
0)
Hint
3.
Only active measurements
with a defined tolerance limit
create a valid Boolean result;
otherwise, they are ignored.
Click on 'OK' to confirm.
Hint
To reset the auxiliary I/O
output, you must add a
separate 'Aux Output' step that
sets the output pins to the
required values ('0' or '1').
© 2015 NTi Audio AG, MBe
241
242
10.3
FX-Control User Manual
Examples
The chapter provides practical examples and hints to setting up a test sequence
a) Basic amplifier test
b) Sequential analysis of 4 pcs. identical DUTs.
c) Stepwise verification of a 3-way loudspeaker cabinet.
d) Consecutive measurement of the DC resistance and AC-impedance of a DUT.
e) Octave and 1/3rd Octave band measurement (RTA)
10.3.1 a) Amplifier test
The example illustrates a basic amplifier test sequence that is controlled by a PLC.
1.
PLC
triggers the test sequence
2.
Sequence resets the FX100 auxiliary I/O output pins
3.
Operator
4.
Sequence prompts the operator to adjust the amplifier volume control
5.
FX100
6.
Sequence feeds the Pass/Fail feedback of state #1 to the PLC
7.
FX100
8.
Sequence feeds the Pass/Fail feedback of state #2 to the PLC
9.
Sequence calls an executable that prints out a barcode label (incl. S/N from step 3.)
enters the serial number of the DUT
executes the Meter measurements of state #1
executes the GlideSweep measurements of state #2
10. Sequence builds a report document with the DUT's serial number, measurement data, Pass/Fail result etc.
The sketch shows the involved devices and connections, and refers to the listed sequence states & steps.
Schematic test setup and sequence flow
© 2015 NTi Audio AG, MBe
Sequences
The Sequence Dialog panel shows the user-defined order of the states & steps.
Sequence dialog box
© 2015 NTi Audio AG, MBe
243
244
FX-Control User Manual
10.3.2 b) 4 identical DUTs
Test four DUTs (Devices Under Test) with the same test parameters in a row, and verify their individual frequency
response.
The sequence comprises four states, whereby
the test parameters (e.g. bandwidth, test signal level) are not amended, but
each state activates another channel of the output & input switcher.
Schematic view of switched 4-DUT test
Wiring
Wiring and internal link s of State2
© 2015 NTi Audio AG, MBe
Sequences
States
State1 test parameters & results
State2 test parameters & results
State3 test parameters & results
State4 test parameters & results
© 2015 NTi Audio AG, MBe
245
246
FX-Control User Manual
10.3.3 c) 3-way loudspeaker
Verify the frequency response & PureSound steepness of a three-way active loudspeaker, i.e. woofer, midrange
driver and tweeter.
The sequence comprises three states, whereby
each state has its individual test parameters (e.g. bandwidth, test signal level, tolerance limits etc.),
all measurements are acquired by a single microphone.
Schematic view of switched 3-way loudspeak er test
Wiring
Wiring for active 3way loudspeak er test
© 2015 NTi Audio AG, MBe
Sequences
States
State 1 - Woofer
© 2015 NTi Audio AG, MBe
247
248
FX-Control User Manual
State 2 - Midrange driver
© 2015 NTi Audio AG, MBe
Sequences
State 3 - Tweeter
© 2015 NTi Audio AG, MBe
249
250
FX-Control User Manual
10.3.4 d) DCR, impedance response
Measure the DC resistance and the AC impedance response of a DUT (Device Under Test)
comprises two steps, whereby the FX100 analyzer coupling is switched to
1. DC for the DCR measurement
2. AC for the impedance response
The sequence
Wiring
State 1: DCR measurement: DUT link ed directly to DCcoupled analyzer
State 2: AC impedance: shunt resistor link ed to ACcoupled analyzer
States
State 1
State 2
© 2015 NTi Audio AG, MBe
Sequences
251
10.3.5 e) Octave band measurement
Calculate the octave or 1/3rd octave spectrum, based on an FFT measurement (similar to a RTA = real-time
analyzer).
Preparations
1.
Copy the folder "FFT2RTA" to your PC; the package is available
on the FLEXUS product-CD
under http://my.nti-audio.com
2.
Double-click on "setup.exe" and install the software.
3.
Open the FX-Control project "RTA measurement".
4.
In the 'Logging' ribbon, click on the button
(Full resolution data) and copy the path to the default folder
to the clipboard (Hint: the path below is just an example).
5.
In the worksheets toolbox, click on the calculation item "Full Octave" and paste the path in the properties to the
related formula:
The complete formula string shall read e.g.: "(FrequencyResponse)(new
FrequencyResponse.Converter()).ConvertFrom(null, null,
System.IO.File.ReadAllText(@"C:\Users\xxx\documents\FX-Control\Full Resolution
Results\RTAFullOct.txt"))"
© 2015 NTi Audio AG, MBe
252
6.
FX-Control User Manual
Paste the path to the formula of calculation item "Third Octave":
Updated 'Formula' string: "(FrequencyResponse)(new
FrequencyResponse.Converter()).ConvertFrom(null, null,
System.IO.File.ReadAllText(@"C:\Users\xxx\Documents\FX-Control\Full Resolution
Results\RTAThirdOct.txt"))"
7.
Open the Sequence Dialog panel via the 'Start' ribbon, double-click on the "Calculate RTA" step and update the
paths under 'Command' and 'Arguments'.
Updated 'Arguments' string: ""C:\Users\xxx\Documents\FX-Control\Full Resolution Results"
CSV 1 DeleteInputFile"
i. ""C:\Users\xxx\Documents\FX-Control\Full Resolution Results"" must be written in
quotation marks and identifies the directory, where the full-resolution FFT file will be logged.
ii. "CSV" defines the log file format (CSV or TXT).
iii. "1" defines the analyzer channel, to which the measuring microphone is connected.
iv. "DeleteInputFile" is an optional parameter; if it is entered, the FFT log file will be deleted as soon as it
has been processed by the software.
© 2015 NTi Audio AG, MBe
Sequences
8.
Select State #1 and edit the properties of the FFT measurement graph:
Select a logarithmic 'Unit', as e.g. 'dBSPL', 'dBV'
or 'dBu'.
The 'Size' must be minimum 256k
If you want to prolong the acquisition length, you
may either increase the 'Size' or the number of
'Average Cycles'.
Make sure that the 'Active' selector is switched to
'On'.
© 2015 NTi Audio AG, MBe
253
254
9.
FX-Control User Manual
Execute the sequence to acquire & display the results (Hint: the whole procedure tak es several seconds).
© 2015 NTi Audio AG, MBe
Part
XI
256
FX-Control User Manual
11
Advanced
The advanced section provides access to the
Internal routing of the FX100
Properties of the installed options
Language of FX-Control menu entries
Distortion calculation method
Ambient temperature
Headphone connector status
11.1
Routing
The routing defines the internal links of FX100.
Hint
Please refer also to chapters System operation, Wiring ribbon and Hardware & Wiring.
Generator output channels to
o XLR + BNC connector
o Outbus
o DC Measurement (refer to DCV, DCR)
Analyzer input channels to
o XLR connector
o BNC connector
o Inbus
o Outbus
Out Bus to
o none
o an installed plug-in board (e.g. FX-OS output switcher)
In Bus to
o none
o an installed plug-in board (e.g. FX-SIL, FX-SIH or FX-IS)
© 2015 NTi Audio AG, MBe
Advanced
11.2
257
Option
The section provides access to the properties of the installed options
OutSwitcher
InSwitcher
SpeakerImpedanceLow
SpeakerImpedanceHigh
Example: FX-SIL
AmplifierIn
Protected
overflow
Speakon™ IN connected to amplifier output
Speakon™ IN disconnected from internal circuit, e.g. due to an
DCR32ERange
internal current source of the SIL is active (it is possible to
measure the DC impedance of the connected DUT (Device Under Test) in the
range from 1.5 to 1500 )
11.3
General
Language
select the language of the FX-Control menu entries.
o English
Distortion
select the calculation method for the Total Harmonic Distortion (THD)
measurement (see below)
o IEC
o IEEE
Ambient Temp
enter the ambient temperature, expressed in degree Celsius [C] or
Fahrenheit [F] (required for the time window calculation)
HeadPhone
provides access to the operation of the headphone jack
Function
o Monitor
the signal behind the input filter stage (e.g. A-weighted or Lowpass
filtered etc.)
o PureSound
the input signal behind the PureSound bandpass-filters
IEC
IEEE
© 2015 NTi Audio AG, MBe
Source
input channel number (1, 2, 3, or 4)
Volume
output signal volume, -80...39.5 dB
Part
XII
Application hints
12
Application hints
Demo projects
Tutorial
X/Y-axis scaling
Analysis of external signals
Measurement speed
Template for build report
Shortcuts, mouse operation
IEEE 488
12.1
Demo projects
The FX-Control installation CD includes a number of demo projects for typical applications.
Basic projects
Meter projects
Demo project Description, hints
(file name)
1-Chn FFT
A simple 20 Hz to 20
kHz audio bandwidth
FFT measurement via
analyzer channel 1.
Use the properties
section of the result
graph to parametrize
the FFT analysis, e.g.
The test signal is
transmitted acoustically
or via an electrical
connection.
Alternatively, it is also
possible to analyze an
externally generated
signal.
2-Chn FFT
A simple 20 Hz to 20
kHz audio bandwidth
FFT measurement via
analyzer channel 1 & 2.
Use the properties
section of the result
graph to parametrize
the FFT analysis, e.g.
The test signal is
transmitted acoustically
or via an electrical
connection.
Alternatively, it is also
possible to analyze an
externally generated
© 2015 NTi Audio AG, MBe
Application examples
259
260
FX-Control User Manual
signal.
2-chn standard A simple 20 Hz to 20
Audio bargraph kHz Audio bandwidth
monitor
FFT via analyzer
channels 1 & 2.
Use the properties
section of the result
graph to parametrize
the FFT analysis.
PureSound
monitor
Measures & displays all
six PureSound bands in
parallel as bargraphs.
NOTE - This project
requires a valid
PureSound license on
your FX100.
GlideSweep projetcs
Demo project Description, hints
(file name)
2-chn
frequency
response
2-chn Level /
THD / Phase
Application example
Executes a 1 sec.
GlideSweep and
acquires the active
measurements on
channels 1 & 2
Calculations projects
Demo project Description, hints
(file name)
Application examples
© 2015 NTi Audio AG, MBe
Application hints
Boolean
calculation
1. Measures the Meter
level of Ch1, Ch2 and
checks the results
against individual
limits
2. Verifies, whether both
measurements are
within the limits and
shows the overall
result in a separate
PASSED/FAILED
display
Curve
subtraction
1. Measures the
GlideSweep
frequency reponse of
Ch1, Ch2
2. Calculates &
displays the
difference of the two
recorded curves
Relative to
frequency
1. The instrument
executes a 1-channel
GlideSweep level
measurement.
2. In a second graph,
the recorded curve is
displayed relatively to
its level at 1 kHz (i.e.
level @ 1 kHz = 0
dB)
The "Linear
Interpolation"
calculation item
determines the level
value at 1 kHz -> this
value is then subtracted
from the original curve.
Regulators
StepSweep projetcs
Demo project Description, hints
(file name)
Level
(frequency
response)
Executes a StepSweep
from 20 Hz to 2 kHz
with 60 pts, while
measuring the Level on
channels 1&2.
© 2015 NTi Audio AG, MBe
Application examples
261
262
FX-Control User Manual
Level_Phase_T Executes a StepSweep
HD
from 20 Hz to 20 kHz
with 60 pts, while
measuring Level, THD
and Phase on channels
1&2.
Table_Sweep_ The FX100 executes a
NTI
table sweep on channel
1, i.e. generates a
series of frequency/
amplitude pairs.
NOTE - The generator
and analyzer of chn1
are linked internally, i.e.
the test signal is NOT
transmitted through an
external DUT.
Time_Sweep
Performs a 10 seconds
Time Sweep, while
measuring the input
Level on channel 1&2.
NOTE - Make sure that
the input range is
adjusted properly prior
to starting the
measurement.
© 2015 NTi Audio AG, MBe
Application hints
12.2
Tutorial
The following paragraphs describe ways of setting up basic measurements. i.e.
1. Establish the correct wiring
2. Adjust the generator settings (i.e. test signal parameters)
3. Adjust the analyzer parameters (e.g. bias, input ranging, settling etc.)
4. Activate the required measurements and result panels
5. Define the tolerance limits (optional)
6. Activate & customize the result data logging
1. Wiring
Single transducer test setup
Recommended wiring for single transducer test with SIL option
© 2015 NTi Audio AG, MBe
263
264
FX-Control User Manual
Dual transducer test setup (parallel analysis)
Recommended wiring for parallel testing of two transducers with SIL option
Dual transducer test setup (sequential analysis)
Recommended wiring for sequential (alternating) testing of two transducers with SIL option
© 2015 NTi Audio AG, MBe
Application hints
265
2. Test signal parameters, measurements
FX-Control supports two different approaches to select & adjust the generator settings, test parameters and
measurement functions,
1. via the Toolbox: drag&drop the required panels from the tree to the worksheet
2. via the Ribbon: click on a button of the Worksheets ribbon to open the corresponding measurement panel or item
Via the toolbox
Example 1 — Adjust the generator chn.1 level
In the Worksheets toolbox, expand the tree to
"FX 1
Generator
Level".
Drag&drop the 'Channel 1' panel to the
worksheet.
Click on the
button to select the level
measurement unit
Enter the required output level manually or by
using the scroll wheel.
Toggle the generator output button from
'OFF' (i.e. muted) to 'ON' to activate the output
signal.
Example 2 — Adjust the GlideSweep test
parameters
Open the tree to "FX1
GlideSweep"
Generator
To edit the GlideSweep parameters, you can
either
o drag & drop the 'GlideSweep' panel to the
worksheet
o or access the parameters in the 'Properties'
section
© 2015 NTi Audio AG, MBe
266
FX-Control User Manual
Via the ribbon
Click on the 'Front Panel' button in the Worksheets ribbon
Under the 'Tree' tab, click on FX 1
Generator
Level
Channel2
Confirm by pressing the 'OK' button
3. Analyzer parameters
The analyzer parameters are adjusted the same way as the generator status (see above), e.g.
AC or DC coupling
Microphone settings (e.g. power supply, sensitivity)
Filter
Input range
© 2015 NTi Audio AG, MBe
Application hints
4. Measurements
Activate the required measurements by placing the related result display on the worksheet
Example: GlideSweep level
Example 1 — Drag & drop from the tree
Look for the entry "FX1
Generator
Measurement
GlideSweep
Level
Channel1"
Drag & drop the panel to worksheet to activate
the related measurement
Example 2 — Via the Work sheet ribbon
Click on the 'Line Graph' button in the
Worksheets ribbon
Activate the measurement function either
a) under the 'Tree' tab; click on Measurement
GlideSweep
Level
Channel1 and
press the 'OK' button, or
© 2015 NTi Audio AG, MBe
267
268
FX-Control User Manual
a) under the 'Measurement Functions' tab;
select the line "Device: FX1
Instrument: StepSweep
Type: Level
Channel: 2" and confirm by clicking on
the 'OK' button.
5. Tolerance limits
Every measurement result can be checked individually against customized acceptance limits, which are defined
either
manually, or
in a semi-automated procedure.
(please refer to the corresponding chapters)
6. Data logging
Activate the automated logging of the acquired result data e.g. by pressing on the button
toolbar.
in the quick access
Customize the logging settings via the button 'Settings' in the Logging ribbon.
© 2015 NTi Audio AG, MBe
Application hints
12.3
269
X/Y-axis scaling
The scaling of a result graph, i.e. linear or logarithmic X-/Y-axis may have a major impact on
a) linear interpolation
b) tolerance limits
It is therefore essential to make sure that the X-/Y-axis scaling are adjusted properly prior to the application of these
features.
Example
The following picture shows four result graphs of a 4-point sweep measurement, whereby each graph has a different
scaling.
The numerical values below the graphs represent the linear interpolation of the level @ 10 kHz of the corresponding
graph. The differences between the numerical results come from the fact that
the displayed result curves (green lines) are drawn by directly connecting neighbored points (blue circles)
the interpolated result (red arrows) is acquired 'graphically'
Hint
Each of the shown curves or numerical results is 'correct' – but only in conjunction with the
corresponding scaling.
© 2015 NTi Audio AG, MBe
270
12.4
FX-Control User Manual
External signal analysis
FX100 can be used to analyze test signals that have been generated by an external device (e.g. MP3 player, PC,
eBook reader etc.)
A) External Meter measurement
i. Select external Meter synchronization
wideband mode.
the FX100 analyzer automatically acquires the incoming signal in
ii. Activate the required measurement(s).
iii. Acquire the measurement(s) in a single shot or continuously.
B) External StepSweep analysis
i. Switch the analyzer StepSweep synchronization to external.
ii. Align the start, stop frequencies of the FX100 analyzer to the bandwidth of the externally generated StepSweep.
iii. Define the StepSweep timeout
if no stable input signal comes in after initiating the measurement, FX100 will
abort the acquisition after expiration of the timeout period.
iv. Run the measurement continuously or start it at a specific time.
© 2015 NTi Audio AG, MBe
Application hints
271
C) External GlideSweep analysis
The FX100 Device is able to sample & analyze an externally generated GlideSweep. This feature is especially
helpful for applications where the test signal can not be routed from the FX100 generator through the DUT (e.g. MP3
players, notebooks etc.). The transmitted GlideSweep must comprise a specific header that allows the FX100
analyzer to trigger correctly to the incoming signal, and can be easily created under FX-Control and saved on the
DUT.
i. Adjust the generator signal parameters of the GlideSweep (i.e. bandwidth, spacing, start/stop frequency, fade-in
and length).
ii. Create a sound file of the GlideSweep in wav or mp3 format and save it on the external device.
iii. Adjust the analyzer GlideSweep settings, i.e.
select the sense channel that shall trigger to the incoming GlideSweep signal
adjust the number of points.
define the GlideSweep timeout
if no FX100 proprietary GlideSweep preamble signal is received after
initiating the measurement, FX100 automatically aborts the acquisition after expiration of the timeout period
NOTE It is essential that the GlideSweep generator parameters of the analyzing FX100 are identical to
those of the externally replayed GlideSweep signal.
iv. Activate the required measurement(s), e.g.
Level
Distortion
PureSound steepness
Signal latency
v. Initiate the measurement(s) and replay the GlideSweep signal from the external device (NOTE – In case of a
signal latency measurement, the measurement start and the signal replay must start at the same time).
Hint
It is recommended to mute the FX100 generator during the measurement.
vi. The FX100 analyzer consequently monitors the active input channel until it triggers to the fixed header of the
GlideSweep signal
the analyzer synchronizes to the incoming signal and starts the measurement.
© 2015 NTi Audio AG, MBe
272
FX-Control User Manual
Sample rate adjustment
If a GlideSweep signal shall be analyzed that has been generated by an external device, the FX100 analyzer sample
rate must be synchronized to the incoming test signal. For this purpose, every exported GlideSweep starts with a
header that allows the FX100 analyzer to trigger correctly to the incoming signal and to measure the sample rate of
the replay device.
However, there are two issues that have to be considered carefully in this mode.
a) The sample rate of an external device that is generating a GlideSweep may differ from the internal FX100 sample
rate (192 kHz). The FX100 therefore automatically recognizes and compensates such sample rate deviations. If
the difference however exceeds the maximum allowance of ±5 %, significant errors in the GlideSweep frequency
or distortion response measurement may occur.
b) If an acoustically coupled external GlideSweep analysis is executed in the presence of loud ambient noise, the
measurement of the header's sample rate may be compromised. This can negatively affect the result of the signal
latency measurement. Consequently, the analyzer sample rate adjustment shall be turned Off in a very noisy
environment.
© 2015 NTi Audio AG, MBe
Application hints
12.5
273
Measurement speed
The following list provides general hints on speeding up your measurement(s). However, keep in mind that every
setup must be considered individually to achieve optimum results.
General hints
Use GlideSweep rather than StepSweep measurements
Avoid to repeatedly altering the input bias
Avoid the logging format XLSx
StepSweep
Switch Analyzer synchronization to Generator
Minimize the number of points
Adjust the start frequency > stop frequency
Switch the settling OFF
GlideSweep
Minimize the GlideSweep length (i.e. duration)
12.6
Template for build report
The chapter describes the procedure to establish a template for build reports under MS Word. If you prefer another
desktop publisher program, please proceed accordingly.
Hint
Please contact NTi Audio if your need further assistance to establish a Build report.
Step 1
i.
Under MS Word, open a new document and name it; this will become your template file.
ii.
Format the document according to your demands, e.g. by adding the
o logo of your company in the header,
o permanent text or graphs that will not change (see picture under Step 6).
Step 2
i.
Run FX-Control, set up your test and activate the required measurements.
ii.
Establish a sequence with minimum one state.
iii. Add a build report,
iv. Select the Template File (e.g. the word document from Step 1)
v.
Enter a name for the Output File.
o No name (i.e. input box is left blank)
every time the sequence is executed, a new Output File is created
with the default name "<Step name><Date><Time>"
o Fixed name (e.g. "Result Sheet")
every time the sequence is executed, the one & only Output File gets
overwritten (Side note – requires the Post Build Action "Print")
o Indexed name (e.g. "$[Input x]" or "%[FX1].SerialNumber")
every time the sequence is executed, an
Output File is created with the indexed name (Side note – if the indexed name does not change, the Output
File gets overwritten)
vi. Select the Post Build Action, i.e. either
o (None)
Output File is created without any further action
© 2015 NTi Audio AG, MBe
274
FX-Control User Manual
o Open
o Print
Output File is created & opened
Output File is created & printed
Step 3
i.
Swap to MS Word and open the Template document.
ii.
Click on the "Developer" tab.
iii. Add the required container elements that shall display the exported build report contents.
o Click on the "Aa" button to add a text container
o Click on the
button to add a picture container
iv. Click on a container element that has been placed to the document, and then on "Properties" in the Developer
ribbon.
v.
Edit the title & tag in the 'Content Control Properties'.
MS Word template with Picture container and properties
© 2015 NTi Audio AG, MBe
Application hints
Step 4
i.
Swap to FX-Control.
ii.
Click on the measurement panel that shall be exported to the document.
iii. In the properties of this measurement panel, copy the Header string.
Header string of measurement panel
© 2015 NTi Audio AG, MBe
275
276
FX-Control User Manual
Step 5
i.
Swap back to MS Word
ii.
Write "!Sheet." to the Title, Tag lines, whereby "Sheet" is the name of the FX-Control worksheet on which
the result panel is located (e.g. "!Results").
iii. Paste the copied Header string from the measurement panel properties (Step 3) directly behind Sheet name.
iv. Click on 'OK' to confirm.
Step 6
i.
Repeat Steps 3...5 for every text or graph container that shall be placed in your template file.
ii.
Edit the containers according to your requirements, e.g.
o text container: exact location in the document, character font & size, paragraph attributes,
o graph container: exact location in the document, size.
Green: permanent graphs or text / Red: containers for exported data
© 2015 NTi Audio AG, MBe
Application hints
12.7
277
Shortcuts, mouse
Always
Alt
Ctrl
Ctrl
Ctrl
Ctrl
+
+
+
+
1
2
C
N
Ctrl + O
Ctrl + P
Ctrl + S
Ctrl +Shift + S
Ctrl + V
F5
F6
F8
Right-click in WorkArea
show shortcuts
the actual input level at channel 1 becomes the new reference level
the actual input level at channel 2 becomes the new reference level
copies the active item in the Hardware & Wiring or Worksheets view, respectively
clear all items in the Worksheet and the Hardware & Wiring view, and open a new
project
open a specific project
print the contents of the current worksheet (see chapter 'View' ribbon)
save the current project settings
save the current settings under a new project name
pastes the copied item to the Hardware & Wiring or Worksheets view, respectively
run single execution of active measurements of all connected FX100 instruments
run repeated execution of active measurements of all connected FX100 instruments
abort measurement
opens a pop-up menu with the buttons of the 'Worksheets' ribbon
Specific panels
Panel
Shortcut
Effect
Harmonics properties
Shift
Select all harmonics between two selected ones (e.g. click
on 5, then <Shift> + 10
automatically activates
harmonics 6, 7, 8, 9, too)
Exclusively activates the selected harmonic, i.e. all other
harmonics are deactivated
Ctrl
Tolerance graph editor
Shift
Ctrl
Alt
StepSweep, GlideSweep
amplitude profile editor
Shift
Ctrl
Alt
When moving a point within the graph, only its X-value can
be amended, while the Y-value is kept
When moving a point within the graph, only its Y-value can
be amended, while the X-value is kept
Snap to whole numbers both in X, Y-direction
When moving a point within the graph, only its X-value can
be amended, while the Y-value is kept
When moving a point within the graph, only its Y-value can
be amended, while the X-value is kept
Snap to whole numbers both in X, Y-direction
Level value editor
F4
left mouse button
Opens drop-down menu with available measurement units
Hold left mouse button while using the scroll wheel
the
level values are amended in value steps of 10
Frequency value editor
left mouse button
Hold left mouse button while using the scroll wheel
the
frequency values are amended stepwise (5, 10, 20, 100, 1k,
10k, 20k, 40k, 80k)
Graphical result display
left mouse button
Hold the left mouse button and move it over the graph to
zoom in to the corresponding area.
Double-click on the graph with the left mouse button to
show the full display.
© 2015 NTi Audio AG, MBe
278
12.8
FX-Control User Manual
IEEE 488
The FX100 Device follows the RL state diagram for USB defined in the USB Subclass specification rev1.0 (p.14,
fig.2) and in the IEEE 488.1-1987 standard (p.37, fig.10).
LOCS (Local State)
The LOC State ...
is the initial state after startup, wherein the user can change between any pages and execute any
operations.
will not change, until the PC Software sends a Remote-Enable request.
is also entered when the PC Software de-asserts the Remote-Enable request.
If the Remote-Enable was asserted, the LOC state changes to the Remote State on ...
any SCPI message
trigger message
Initiate Clear request.
If a Local-Lockout request is received from the PC Software, the LOC state is changed to the Local-with-LockoutState, but only if the Remote-Enable was asserted.
REMS (Remote State)
The FX100 will stay in REM state ...
as long as it is not disconnected from the PC
until the PC Software sends a Go-To-Local request
until the PC Software sends a user input.
The FX100 interprets any user input in this state as a Return-To-Local local message. There is no special Return-ToLocal button.
If a Local-Lockout request is received from the PC Software, the state is changed to the Remote-with-Lockout-State.
Note that the Remote-Enable is asserted when the FX100 is in the Remote State.
© 2015 NTi Audio AG, MBe
Application hints
279
LWLS (Local With Lockout State)
In the Local-with-Lockout-State the user can change between any pages and can do any operations.
The state changes to the Remote-with-Lockout-State on ...
any SCPI message
a trigger message
an Initiate Clear request.
RWLS (Remote With Lockout State)
If this state is entered, the FX100 Device returns immediately to the test page from any other position in any other
page.
In the RWL state any user input is locked except headphone settings (source, channel, volume), and the user
cannot change to any local state. This gives the PC software the full control over the FX100 Device.
For any user inputs, the PC Software must send a Go-To-Local request. Then the FX100 Device changes to the
LWL state.
© 2015 NTi Audio AG, MBe
Part
XIII
Support
13
281
Support
If you have specific questions or need professional support, please contact your local NTi Audio agent or any of the
following service centers.
Americas
China
NTI Americas Inc.
PO Box 231027
97281 Tigard, Oregon
USA
NTi China Co., Ltd.
Room 701, Ganglong Lisheng Mansion
No 60, Suli Road
Wuzhong District, 215168 Suzhou
PR China
Phon +1 (503) 684-7050
Fax +1 (503) 684-7051
[email protected]
Phon +86 (512) 6802-0075
Fax +86 (512) 6802-0097
www.ntiam.com
[email protected]
www.nti-audio.com/cn
Germany
Japan
Schalltechnik Süd&Nord GmbH
Am Schwarzen 13
45239 Essen
Deutschland
NTI Japan Ltd.
Ryogokusakamoto Bldg.
1-8-4 Ryogoku
Sumida-ku, Tokyo 130-0026
Japan
Phon +49 (201) 5456-980
Fax +49 (201) 5456-981
[email protected]
Phon +81 (3) 3634-6110
Fax +81 (3) 3634-6160
www.akustiktest.de
[email protected]
www.nti-japan.com
Korea
Liechtenstein (Headquarter)
NTi Audio Korea
Room 307, Taekwang Bldg. 57-3
Mullaedong 3-ga, Yeongdeungpo-gu
Seoul 150-835
South Korea
NTi Audio AG
Im alten Riet 102
9494 Schaan
Liechtenstein, Europe
Phon +82 (2) 6404-4978
Fax +82 (2) 6407-4978
[email protected]
www.nti-audio.com
UK
NTi Audio UK
PO Box 510
SG1 9LG Stevenage, Hertfordshire
United Kingdom
Phon +44 (1438) 870632
Fax +44 (1438) 749160
[email protected]
www.nti-audio.com
© 2015 NTi Audio AG, MBe
Phon +423 239-6060
Fax +423 239-6089
[email protected]
www.nti-audio.com
282
FX-Control User Manual
Index
-¼¼" jack
20
-11/3rd octave band
251
-AAbort measurement
182, 277
Abort sequence
228
Abs
203
AC coupling
103
Activate sheet
235
adB
203
Advanced
256
AES
119
analyzer domain
102
board
29
carrier status
120
channel status
121
clock
122
generator domain
81
hardware & wiring view
70
input sample rate
179
input settings
119
output settings
119
sync input sample rate
180
sync status
122
AES17 filter
106
Align
items on worksheet
58
Amplifier
38, 59
D-class filter
41
Amplitude
equalization
99
profile
83, 93, 99
sweep
83, 112
Analysis range (PureSound)
165
Analyzer
analog
27
bias
104
coupling
103
digital
29
domain
102
GlideSweep
114
GlideSweep range
103
input range
102
properties
101
settings
101
Application
button
49, 54
hints
259
Arrange items
58
Audio file
64, 150, 177, 194
Aux
input
235
output
235
Auxiliary
I/O interface
21, 182, 228, 235
pin assignments
21
trigger
182, 228, 235
wiring
21
A-weighting
106
-BBalanced
analyzer
27
generator
25, 82
Bargraph
61, 187
Bias
104
analyzer
27
input switcher
44
Black-burst
122
BNC
82
analyzer
27
digital analyzer
29
digital generator
29
generator
25
Boolean
operators
203
output
235
Brickwall filter
106
Bridge mode
38
Build report
235
example
273
template
273
-CCalculated Passed/Failed
example
205
Calculation
button
61
examples
205
61
© 2015 NTi Audio AG, MBe
Index
Calculation
IEC
257
IEEE
257
item
61, 196
items
69
of curves
196
operators
203
overview
195
units
203
Calibration
center
281
date
16
of FX100
6, 12
Carrier
level
119
status
120
Channel status
121
Chirp
93
measurements
144
Clipboard (copy & paste)
items
57
result data
187
Clock
119, 122
C-message
106
Coding bit
120
Communication
77
Continuous
136, 184
Copy
items
57
result data
187
tolerance limits
216
Coupling
103
Crest factor
82
Crosstalk
163
Current
maximum FX-SIH
35
maximum FX-SIL
31
sensor
38
Curve subrange
61
Custom curve
61
-DData
export to document
235, 273
logging
64, 193, 194, 235
output
235
Date & time
16, 65
dB
203
dBr
105, 147, 156
DC
© 2015 NTi Audio AG, MBe
coupling
103
DCR measurement
170
DCV measurement
169
measurement
104
D-class amplifier
41
Default
54
directory
54
file path
54
log data folder
64, 193, 194
Default calculation item
196
Delay
235
Demo projects
259
Device
hardware
12
tolerance limits
217
Digital audio
board
29
option
29
Directory
54
Display
16
Distance
176
Distortion
156
Docking panel
49
Domain
analyzer
102
generator
81
hardware & wiring view
70
Dual mode
38
-EEditable curve
example
205
Equalization
124
GlideSweep generator
130
Error
flags
120
messages
77
ETC
114, 178
Example
calculation
205
input switcher wiring
44
logged data
193
output switcher wiring
42
speaker test wiring
31
Examples
259
Execute
measurement
182
sequence
182, 228
Exp
203
Export GlideSweep
93
283
284
FX-Control User Manual
External
fundamental rejection
156
GlideSweep
93, 114, 176, 270
signal analysis
111, 138, 270
signal generator
59
StepSweep
112, 270
timeout
112, 114
-FFFT
File
150
log data
64, 193
MAT 64, 150, 177, 178, 194
path
54
type
64, 194
WAV
64, 150, 177, 194
Filter
106
DF
41
Firmware
47
update
65
version
16
Foot switch
182, 228, 235
Frequency
generator
82
measurement
146
sweep (analyzer)
112
sweep (generator)
83
Front panel
12
headphone jack
20
Full resolution
logging
64, 177, 178, 194
FX100
59
device
12
device information
65
hardware
12
FX-AES
29
-GGain
154
General
257
Generator
analog
25
balanced
82
digital
29
domain
81
equalization
61, 130
frequency
82
level regulator
61, 125
mono
82
mute
81
outstate
82
properties
79
settings
79
unbalanced
82
waveform
82
Generic calculation item
196
GlideSweep
amplitude profile
93
analyzer
114
analyzer range
103
ETC
114, 178
export
93
external
93, 176, 270
generator
93
impulse response
114, 177
measurements
144
range regulator
129
signal latency
176, 270
timeout
114, 270
weighting
93
Golden sample
217, 222
Graphical display
186
normalized
222
result data
187
Worksheets ribbon
61
-HHardware
installation
8
overview
12
requirements
8
scan
59
setup
70
status
16
Hardware & Wiring
arrange items
58
toolbox
69
view
70
Harmonics
156
Headphone
¼" jack
20
volume control
12, 20
Help
ribbon
65
version
6
High pass filter
106
© 2015 NTi Audio AG, MBe
Index
-IICP
104
analyzer
27
input switcher
44
IEC calculation method
257
IEEE 488
278
IEEE calculation method
257
Impedance
digital audio
119
digital audio inputs
29
measurement
173
SIH
35
SIL
31
SIP
38
Impulse response
114, 177
Inbus
analyzer
27
Initiate
measurement
182
sequence
182, 228
Input
level measurement
147
state
235
switcher
44
Installation
8
Interchannel
crosstalk
163
phase
160
XTalk
163
Introduction
6
IP address
16
-KKeep curve
187
-LLanguage
54, 257
LCD
16
Level
generator
81
measurement
147
ranges
81
relative
147, 277
units
81
License
download
65
© 2015 NTi Audio AG, MBe
menu 'System'
16
Limits
device
216, 217
overview
216
software
216, 222
Line Graph Collector
tolerance limits
217, 222
linear
269
fit
61
interpolation
61
Log (logarithm)
203
logarithmic
269
Logging
full resolution
64, 177, 178, 194
ribbon
64
settings
64
standard
193
Low pass filter
106
-MMainframe
12
MAT file
64, 150, 177, 178, 194
Matlab
64, 150, 177, 178, 194
Max
203
Max runs
165
Mean
203
Measurement
activation
49
continuous
57, 184
crosstalk
163
DCR
170
DCV
169
ETC
178
execution
136, 182, 277
FFT 150
frequency
146
functions overview
145
gain
154
GlideSweep
49, 144
harmonics
156
impedance
173
impulse response
177
level
147
Meter
49, 138
overview
49
phase
160
PureSound
165
repeat
57
repeated
185
setup
49
285
286
FX-Control User Manual
Measurement
single
57, 184
speaker impedance
173
speed
273
start
57, 82
steepness
165
StepSweep
49, 141
stop
57
THD, THD+N
156
XTalk
163
Messages
61
Meter
analyzer
111
analyzer range
102
generator
82
measurements
138
Microphone
59
sensitivity
104
Min
203
Mono
82
Mouse
277
Mute
81
-NNew project
54
New worksheet
61
Noise
cancellation
165
measurement
112
Normalized curve display
NTi Audio
homepage
65
support
281
NTSC
122
Numerical result display
-OOctave band
251
Optical connector
29
Options
12, 257
Outbus
analyzer
27
generator
25
Output
state
82
switcher
42
Overall passed/failed
61
222
61, 186
-PPAL
122
Parity bit
120
Passed/Failed
61
calculation item
61
example
205
result display
192
Paste
items
57
result data
187
tolerance limits
216
PC hardware requirements
8
PC-software
communication
77
installation
8
layout
49
operation
49
overview
47
startup
54
trace
77
updtae
65
Phantom power
104
analyzer
27
input switcher
44
Phase
160
Pink noise
82
PLC
21, 182, 228, 235
Plug-in boards
12, 257
Points (PureSound)
165
Post-processing
187
Previous result
61
Print
58
Printout
54
Program
235
Project handling
54
Prompt
235
Properties
49, 75, 112
analyzer
101
crosstalk measurement
163
DCR measurement
170
DCV measurement
169
FFT measurement
150
frequency measurement
146
FX-AES
29
FX-ANA
27
FX-GEN
25
FX-IS
44
FX-OS
42
FX-SIH
35
© 2015 NTi Audio AG, MBe
Index
Properties
49, 75, 112
FX-SIL
31
FX-SIP
38
gain measurement
154
generator
79
GlideSweep analyzer
114
harmonics measurement
156
impedance measurement
173
level
81
level measurement
147
mainframe
12
Meter settling
138
phsse measurement
160
PureSound measurement
165
speaker impedance measurement
StepSweep analyzer
112
StepSweep settling
141
THD measurement
156
XTalk measurement
163
PureSound
max runs
114
measurement
165
points
114
resolution
114
test signal
93
-QQuick access toolbar
49, 56
-RRange
analyzer
102
GlideSweep
103
Rear panel
12
auxiliary I/O interface
21
Reference
level
277
Reference dBr
105
Reflections
114
Regulator
124
generator equalization
130
GlideSweep range
129
level
125
THD
125
Relative
distortion
156
level
147
reference
105
Relatvie response
61
© 2015 NTi Audio AG, MBe
173
Remote control
47
Renewal conditions
64
Repeat
136, 185
Reporting
273
Request support
65
Result data
copy & paste
187
display
186
logging
64, 193, 194
normalized display
222
Result display
186
bargraph
187
buttons
61
graph
187
impedance
173
normalized
222
numerical
186
Passed/Failed
192
speaker impedance
173
Ribbon
49
Help
65
Logging
64
Start
57
View
58
Wiring
59
Worksheets
61
Rms
203
Rotary encoder
16
Routing
70
analyzer
27
DF
41
digital analyzer
29
digital generator
29
generator
25
input switcher
44
output switcher
42
properties
256
SIH
35
SIL
31
SIP
38
Rss
203
RTA
251
RT-IB
59
-SSafety
7
Sample rate
119, 120, 122
Sample rate adjustment
114, 270
Sample rate deviation
61
Save project
54
287
288
FX-Control User Manual
scaling
269
Scan hardware
59
Schematic diagram
12
Scope
150
Selective level
147
Sensitivity of microphone
104
Sequence
57
example
242, 244, 246, 250, 251
execution
182, 228, 235
overview
228
setup
228
state
235
step
235
Sequencer
16
Serial number
12, 16
Service centers
281
Settling
138, 141, 180
Setup
measurements
73
wiring
70
Shortcuts
277
Shunt resistor
SIH
35
SIL
31
SIP
38
Sigma
203
Signal latency
270
measurement
176
Signal-to-noise
141
Simulator
59
Sine
82
Single shot
136, 184
Smoothing
61
Software
installation
8
layout
49
operation
49
overview
47
startup
54
tolerance limits
222
update
65
Sound file
64, 150, 177, 194
Source
analyzer
111
Speaker impedance
measurement
173
Speakon
DF
41
SIH
35
SIL
31
SIP
38
Spectrum
FFT 150
Sqrt
203
Stand-alone operation
47
Start
measurement
57, 136, 182
ribbon
57
sequence
182, 228
tone
83
Start measurement
277
Startup
54
State
228, 235
Stdev 203
Steepness
measurement
165
resolution
114
Step
235
StepSweep
amplitude
83
amplitude profile
83
analyzer
112
analyzer range
102
example
205
external
270
frequency
83
generator
83
measurements
141
settings
83
table
83
time
83
timeout
112, 270
weighting
83
Stop measurement
57, 136
Sum
203
Support
NTi support centers
281
request
65
Switcher
FX-IS
44
FX-OS
42
Sync
input
119
ref. input
29, 122
status
122
Sync input sample rate
180
Synchronisation
digital audio
29
to external clock
29
Synchronization
analog analyzer
111
© 2015 NTi Audio AG, MBe
Index
-T-
-V-
Table sweep
analyzer
112
generator
83
Template
273
Test
analyzer settings
101
generator parameters
79
Test execution
182, 228, 235
Text panel
61
THD
regulator
125
THD, THD+N
calculation method
257
measurement
156
Time sweep
analyzer
112
generator
83
Time window
114
Timeout
112, 114
Tips & tricks
259
Title
187
Tolerance limit
based on Line Graph Collector
copy & paste
216
device
216, 217
overview
216
software
216, 222
Toolbox
49, 69
TOSLINK
29
Trace
77
Tree
select source
73
toolbox
69
Trigger
182, 228, 235
Tutorial
263
Validity bit
120
Video clock
122
View
Hardware & Wiring
70
ribbon
58
Worksheets
73
Volume control
12
rotary encoder
16
-UUnbalanced
analyzer
27
generator
25, 82
Unit converter
61
Units
calculation items
203
level
81
USB-A
20
USB-B
20
© 2015 NTi Audio AG, MBe
-W-
217, 222
Warnings
77
WAV file
64, 150, 177, 194
Waveform
StepSweep
82, 83
type
82
Weighting
81, 130
equalization
99
filter
106
GlideSweep level
93
profile
99
StepSweep level
83
White noise
82
Wiring
auxiliary I/O interface
21
ribbon
59
setup
70
WorkArea
49
Worksheets
49, 61
arrange items
58
new sheet
61
ribbon
61
toolbox
69
view
73
-XX-axis scaling
269
XLR
82
analyzer
27
digital analyzer
29
digital generator
29
generator
25
input switcher
44
output switcher
42
XTalk
163
289
290
FX-Control User Manual
-YY-axis scaling
269
-ZZoom
in/out
slider
58
49, 70, 73
© 2015 NTi Audio AG, MBe
291
Notes
© 2015 NTi Audio AG, MBe