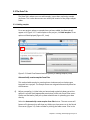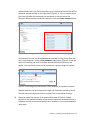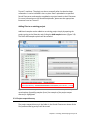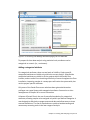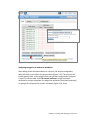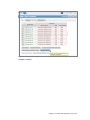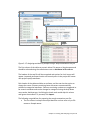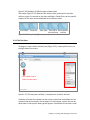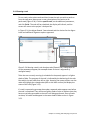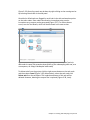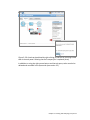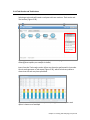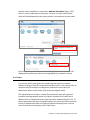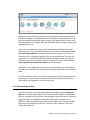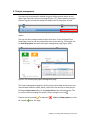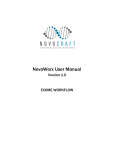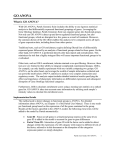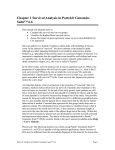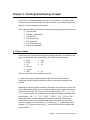
1
Chapter 3 : Creating and Analyzing a Project Partek® Flow® software manages experiments as projects. A complete project consists of input data, tasks used to analyze the data, the resulting output files, and a list of users involved in the analysis. This chapter provides instructions in creating and analyzing a project and covers: Types of data; Creating a new project; The data tab; The analyses tab; The queue tab; The collaborator tab; Project management. 3.1 Types of Data Partek Flow can import both unaligned and aligned NGS data. The following file types are valid and will be recognized by the Partek Flow file browser: fasta bam fastq sam sff sra csfasta csfastq qual gz There is no need to unzip compressed .gz files. In cases where there is paired end data, files will also be automatically recognized and their paired relationship will be maintained throughout the analysis. Matching on paired end files is based on file names: every character in both file names must match, except for the section that determines whether a file is the first or the second file. For instance, if the first file contains "_R1", "_1", "_F3", "_F5" in the file name, the second file must contain something in the lines with the following: "_R2", "_2", "_F5", "_F5-P2", "_F5-BC", "_R3", "_R5" etc. The identifying section must be separated from the rest of the file name with underscores or dots. If two conflicting identifiers are present then the file is treated as single end. For example, s_1_1 matches s_1_2, as described above. However, s_2_1 does not mate with s_1_2 and the files will be treated as two single-end files. Chapter 3 : Creating and Analyzing a Project 1 3.2 Creating a New Project Using a web browser, log in to Partek Flow. From the Home page click the New Project button; enter a project name (Figure 3-1) and then click Create project. Figure 3-1: Partek Flow Home page and the dialog box for naming a project (inset) The Project name is the basis of the default name of the output directory for this project. Project names are unique, thus a new project cannot have the same name as an existing project within the same Partek Flow server. Once a new project has been created, the user is automatically directed to the Data tab of the Project View. Chapter 3 : Creating and Analyzing a Project 2 3.3 The Data Tab The Data Tab is where users can add samples, import data, and assign sample attributes. This is also where users can modify the location of the project output folder. 3.3.1 Adding samples For a new project, where no samples have yet been added, the Data tab will appear as in Figure 3-2. To add samples to the project, click Add samples. Three options will be displayed (Figure 3-2, inset). Figure 3-2: Partek Flow Data tab and the options for adding samples (inset) Automatically create samples from files This method adds samples by creating them simultaneously as the data gets imported into a project. The Sample names are assigned automatically based on the filenames. Before proceeding, it is ideal that you have already copied the data you wish to analyze in a folder (with appropriate permissions) within the Partek Flow server. Please seek assistance from your system administrator in uploading your data directly. Select the Automatically create samples from files button. The next screen will feature a file browser that will show any folders you have access to in the Partek Flow server (Figure 3-3). Select a folder by clicking the folder name. Files in the Chapter 3 : Creating and Analyzing a Project 3 selected folder that have file formats that can be imported by Partek Flow will be displayed and tick-marked on the right panel (Figure 3-3). You can exclude some files from the folder by unselecting the checkmark on the left side of the filename. When you have made your selections, click the Create samples button. Figure 3-3: Selecting files in the Partek Flow server to be imported in a project Alternatively, files can also be uploaded and imported into the project from the user’s local computer. Select the My computer radio button (Figure 3-4) and the options of selecting the local file and the upload (destination) directory will appear. Only one file at a time can be imported to a project using this method. Figure 3-4: Selecting files from the user’s local computer for upload and import Multiple data files can be compressed a single .zip file before uploading. Partek Flow will automatically unzip the files and put them in the upload directory. Please be aware that the use of the method illustrated in Figure 3-4 highly depends on the speed and latency of the Internet connection between the user’s computer and the server where Partek Flow is installed. It is not recommended in most cases. Chapter 3 : Creating and Analyzing a Project 4 After successful creation of samples from files, the Data tab now contains a sample management table (Figure 3-5). The Sample name column in the table is automatically generated based on the filenames and the table is sorted in alphabetical order. Clicking the expand triangle ( ) on the right side of the sample management table will expand the table and reveal the filename of the files associated with each sample (Figure 3-5, inset). Similarly, the collapse triangle ( ) will hide the file information. The fastq column in the expanded view shows the filename associated with the sample. Any filename extensions that indicate compression (such as .gz) are not shown. Figure 3-5: Data tab containing the sample management table after samples were added successfully. Inset shows the expanded view Once a sample is created in a project, the files associated with it can be modified. In the expanded view, mouse over the +/- column of a sample. The highlighted icons will correspond to the options for the sample on that row. Click the green icon ( ) to associate additional files or the red icon ( ) to dissociate a file from a sample. You can manually associate multiple files with Chapter 3 : Creating and Analyzing a Project 5 one sample. Dissociating a file from a sample does not delete the file from the Partek Flow server. Import samples from another project This method adds samples from previously created projects (within the same Partek Flow server) to a new project. This option is useful for re-analyzing a dataset in a new project, analyzing a subset of a data from a previous project, or combining data from different projects Select the Import samples from another project button. A dialog box will allow selection of the samples (Figure 3-6). The dropdown menu of Project lists the existing projects that the current user has access to. They may be previous projects from the same user, previous projects from collaborators, or (if the user has an administrative account) all the projects in the Partek Flow server. Click the Project dropdown menu to select an existing project. In the Samples box, you will find a list of samples from the selected project. Choose the samples you wish to add to your new project by highlighting them using your mouse. If needed, use the keyboard Ctrl- or Shift- key to select more than one sample. Once you make your selection, click the Add button. These samples will now appear in the sample management table in the Data tab. Figure 3-6: Selecting samples from other projects (showing two files selected) Create a new blank sample Samples can be added one at a time by selecting the Create a new blank sample option (Figure 3-7). In the following dialog box, type a sample name and click Chapter 3 : Creating and Analyzing a Project 6 Create. This process creates a sample entry in the sample management table but there is no associated file with it, hence it is a “blank sample.” Expanding the sample management table by clicking the expand triangle ( ) icon on the right side of the table will reveal the option to associate files to the blank sample. Mouse over the +/- column and click the green icon ( ) to associate a file(s) to the sample. Perform the process for every sample in your project. Figure 3-7: Adding a blank sample Adding samples using a Plugin Samples can also be created by Partek plugins that uploads data from other analysis software into the Partek Flow server. One example is the PartekFlowUploader, which runs within the Torrent Suite™ Software of Ion Chapter 3 : Creating and Analyzing a Project 7 Torrent™ machines. The plugin can be run manually after the data has been collected or it can be included in the run plan. Data is uploaded to a specified Partek Flow server and samples are added to a project based on their filenames. For more information on the PartekFlowUploader, please see the appropriate literature from Ion Torrent™. Adding Files to an existing project Additional samples can be added to an existing project simply by opening the project, going to the Data tab, and clicking the Add samples button (Figure 3-8). The three Add samples options will be revealed. Figure 3-8: The Add samples button in the Partek Flow Data tab (red arrow) will reveal options for adding samples (inset). An example of the project output directory is highlighted 3.3.2 Project output directory The project output directory is the folder in the Partek Flow server where all the files produced during analysis will be stored. Chapter 3 : Creating and Analyzing a Project 8 The default directory is configured by the Partek Flow Administrator under the Settings menu (under System Preferences > Default project output directory). For additional details, see the System settings section of Chapter 14. If the user does not override the default, the task output will go to a subdirectory with the name of the Project. An example is shown in Figure 3-8 (inset). The user has the option of specifying an existing folder or creating a new one as the project output directory. To do so, click the Change link and specify or create a new folder in the dialog box. 3.3.3 Sample Annotation After samples have been added in the project, additional information about the samples can be added. Information such as disease type, age, treatment, or sex can be annotated to the data by assigning the Attributes for each sample. Certain tasks in Partek Flow, such as Gene-Specific Analysis, require that samples be assigned attributes in order to do statistical comparison between groups or samples. As attributes are added to the project, additional columns in the sample management table will be created. Sample attributes Attributes can be managed or created within a project. Under the Data tab, click the button to open the Manage attributes page (Figure 3-9). Chapter 3 : Creating and Analyzing a Project 9 Figure 3-9: Accessing the Manage attributes page from the Data tab To prepare for later data analysis using statistical tools, attributes can be categorical or numeric (i.e., continuous). Adding a categorical attribute For categorical attributes, there are two levels of visibility. Project-specific categorical attributes are visible only within the current project. System-wide categorical attributes are visible in all the projects within the Partek Flow instance, and are useful for maintaining uniformity of terms throughout the Flow installation. Importing samples in a new project will retain the system-wide, but not the project-specific attributes. Only users of the Partek Flow server who have been given administrative privileges can create System-wide categorical attributes. See section on User management of Chapter 14 for more information. A feature of Partek Flow is the use of controlled vocabulary for categorical attributes, allowing samples to be assigned only within pre-defined categories. It was designed to effectively manage content and data and allow teams to share common definitions. The use of standard terms avoids misunderstanding and unnecessary renaming tasks in the later stages of analysis. Chapter 3 : Creating and Analyzing a Project 10 To add a categorical attribute in the Manage attributes page, click the Add new attribute (Figure 3-10). In the dialog box, type a Name for the attribute, select the Categorical radio button next to Attribute type, and then click the Add button. Figure 3-10: Adding a categorical attribute and defining the categories Individual categories for the attribute must then be entered. Enter a name of the New category and click Add. The Name of the new category will show up in the table (Figure 3-10, lower right inset). The category can also be edited by clicking or deleted by clicking . Additionally, sub-categories can be added by clicking in the Options column. After all the categories have been added to this attribute, click Close to proceed. Repeat the process for additional attributes of the samples in your study. When done, click Back to sample management table. Categorical attributes will default to Project-specific visibility. Admin accounts have additional option of making the new attribute visible System-wide. They can also restrict the modification of a Project-specific attribute exclusively to other admin accounts Chapter 3 : Creating and Analyzing a Project 11 An additional feature to facilitate the controlled vocabulary in Partek Flow is the integration of terms used by SNOMED CT, a healthcare terminology used for electronic health records. They can be added easily by managing the categories of an attribute and selecting Import terms from SNOMED CT shown in Figure 3-11. Available terms include those for body structure, specimen, clinical findings, or organism. Select multiple terms from SNOMED CT by holding Ctrl key on the keyboard while clicking the mouse to select. These terms will become new top level categories in your attribute. When terms are imported from SNOMED CT, the Term depth indicates the number of sublevels that will also be imported as subcategories in your attribute. Figure 3-11: Importing SNOMED CT terms as categories Adding a numeric attribute To add a categorical attribute in the Manage attributes page, click the Add new attribute (Figure 3-12). In the dialog box, type a Name for the attribute, select the Numeric radio button next to Attribute type, and then click the Add button. Some optional parameters for numeric attributes include the Minimum value, Maximum value, and Units. When done, click Add to return to the Manage attributes page. Repeat the process add more numeric attributes. When done, click Back to sample management table. Chapter 3 : Creating and Analyzing a Project 12 Figure 3-12: Adding a numeric attribute and specifying the units All numeric attributes automatically have system-wide visibility. Adding a system-wide attribute System-wide attributes include numeric attributes created by other users, as well as categorical attributes defined by admins. Since they do not have to be created by the current user, they only need to be added to the sample management table in a project. In the Data tab, click Add a system-wide attribute button (Figure 3-13). In the dialog box that follows, a drop down menu is located next to Add attribute where you can select the System-wide attribute you would like to add to the project. Once selected, it will be recognized automatically as either Categorical, system-wide or the Numeric attribute. For an System-wide categorical attribute, the different categories are listed and you have the option of pre-filling the columns with N/A (or any other category within the attribute). Click Add column and you will return to the Data Tab. Chapter 3 : Creating and Analyzing a Project 13 Figure 3-13: Adding a system-wide categorical attribute column Assigning categories or values to attributes After adding all the desired attributes to a project, the sample management table will show a new column for each attribute (Figure 3-14). The columns will initially appear blank, as the samples have not yet been categorized or assigned a value. To edit the table, click Edit sample attributes. Assign the sample attributes by using a drop down for categorical attributes (controlled vocabulary) or typing with a keyboard for numeric attributes (Figure 3-14, inset). Chapter 3 : Creating and Analyzing a Project 14 Figure 3-14: A “blank” sample management table showing attribute columns. The samples have to be categorized or assigned a value (inset) (an example is shown) When all the attributes have been given a value, click Apply changes and the sample management table will be updated. An example of a completed sample management table is shown in Figure 3-15. After editing the sample table, make sure there are no fields with blank or N/A values before proceeding. To rename or delete attributes, click Manage attributes from the Data tab to access the Manage attributes page (Figure 3-9). You cannot delete an attribute if a sample is assigned to it. Chapter 3 : Creating and Analyzing a Project 15 Figure 3-15: Sample management table with sample attributes assigned (an example is shown) Chapter 3 : Creating and Analyzing a Project 16 Assigning attributes using a Sample Annotation Text File Another way to assign attributes to samples in the Data tab is to use a text file that contains the table of attributes and categories/values. This table is prepared outside of Partek Flow using a text editing software capable of saving tabseparated text files. Using a text editor, prepare a table containing the attributes. An example is shown in Figure 3-16. There should only be one tab between columns with no extra tabs after the last column. In this particular example, the first column contains the filename and the text file is saved as Sampleinfo.txt. Figure 3-16: A sample annotation text file. This view has the non-printing characters visible to show the tab stops. Appearance will vary depending on the text editor used. The first row of the table in the text file contains the attributes (as headers). The first column of the table in the text file, regardless of the header of the first column, should contain either the sample names or the file names of the samples already added in Partek Flow. The first column is the unique identifier that will match the samples to the correct values or categories. In an example in Figure 3-17, there are 10 samples that have been added to the project, but attributes have not yet been assigned. To use the sample annotation file prepared in Figure 3-16, click Assign sample attributes from a file in the Data tab. In the following file browser, indicate if the text file is stored in My computer. If so, locate the file, and then click Next. Chapter 3 : Creating and Analyzing a Project 17 Figure 3-17: Assigning attributes of samples using a sample annotation text file The first column of the table can contain either File names or Sample names and should be selected using the radio buttons next to Attributes in file refer to. The headers of the text file will be recognized and options for their import will appear. Imported attributes that do not currently exist in the project will create new project-specific attributes. Each header of the table would be an attribute, and the user has the option to change the name. Columns containing letter characters are automatically selected as categorical attributes. Columns containing numbers are suggested to be numeric attributes and can be changed to categorical using the drop down menu under Attribute type. Unclicking the check mark would skip this column and ignore the attribute. To proceed, click Import. The following are guidelines for preparing the sample annotation text file: The first column is always the unique identifier and can refer only to File names or Sample names. Chapter 3 : Creating and Analyzing a Project 18 If using Sample names in the first column, they must match the entries of the Sample name column in the sample management table If using File names in the first column, use the filenames shown in the fastq column of the expanded sample management table (Figure 3-5) then add the extension .gz. All filenames must include the complete file extension (e.g., Samplename.fastq.gz). The header name of the first column of the table (top left cell of our text table) is irrelevant but should not be left blank. Whether the first column contains File names or Sample names will be chosen during the process. The last column cannot have empty values (the table cannot be ragged). Missing data (blank cells) can only be handled if the attribute is numeric. If it is categorical, please put a character in it. Using Sample name as the unique identifier in the first column makes more sense when: Samples are associated with more than one file (for instance, paired-end reads and/or technical replicates). If file names are used to assign attributes and a sample is associated with more than one file, assigned attributes will be based on the first file on the list that matches a filename associated with that sample. The files were imported in the SRA format (from the Sequence Read Archive database). In Partek Flow, they are automatically converted to the FASTQ format. Consequently, their filenames would change once they are imported. The new file names can be seen by expanding the sample management table (Figure 3-5), the new extension would be .fastq.gz. If attributes are assigned from a file to the same project twice, two things may happen: If the previous attributes have the same header and type (both are either categorical or numeric), the values are overwritten. If there are different/additional headers on the "second round" of assignment, these new attributes will show up. For numeric attributes, a "blank" value can't override a previous value. Deleting or Renaming samples within a Project In the Data tab, each sample can be renamed or deleted from the project by clicking the gear icon next to the sample name. The gear icon is readily visible upon mouse over. Deleting a sample from a project does not delete the associated files, which will remain on the disk. Chapter 3 : Creating and Analyzing a Project 19 Figure 3-18: Renaming or deleting a sample (an example is shown) Chapter 3 : Creating and Analyzing a Project 20 3.4 The Analyses Tab After samples have been added and associated with valid data files, a data node will appear in the Analysis tab (Figure 3-19). The Analyses tab is where different analysis tools and the corresponding reports are accessed. Figure 3-19: The Analyses tab showing a data node of unaligned reads (an example is shown) 3.4.1 Data and Task nodes The Analyses tab contains two elements: data nodes (circles) and task nodes (rounded rectangles) connected by lines and arrows. Collectively, they represent a data analysis pipeline. Customized pipelines can be pre-built or created and is the subject of Chapter 13. Data nodes (Figure 3-20) may represent a file imported into the project, or a file generated by Partek Flow as an output of a task (e.g., alignment of FASTQ files generates BAM files). Chapter 3 : Creating and Analyzing a Project 21 Figure 3-20: Examples of different types of data nodes Task nodes (Figure 3-21) represent the analysis steps performed on the data within a project. For details on the tasks available in Partek Flow, see the specific chapters of this user manual dedicated to the different tasks. Figure 3-21: Examples of different types of task nodes 3.4.2 The Task Pane Clicking on a node reveals the task pane (Figure 3-22), a data-specific menu, on the right side of the screen. Click a data node to reveal the task pane Figure 3-22: The task pane (red box) is revealed when a node is selected A feature of Partek Flow software is that only the tasks that are available for the selected node will be listed in the task pane. For data nodes, actions that can be performed on that specific data type will appear. A bold black line around a node Chapter 3 : Creating and Analyzing a Project 22 indicates that it is selected. During analysis, only one node can be selected at a time. In Figure 3-22, a node that contains Unaligned reads is selected. The tasks listed are the ones that can be performed on unaligned data (QA/QC, Pre-analysis tools, and Aligners). To hide the task pane, simply click the symbol on the upper left corner of the task pane. Clicking the triangles will collapse ( ) or expand ( ) the different groups of tasks that are shown. After a task is performed on a data node, a new task node is created and connected to the original data node. Depending on the task, a new data node may automatically be generated that contains the resulting data. In Figure 3-23, alignment was performed on the unaligned reads. Two additional nodes were added: a task node for Align reads and an output data node containing the Aligned reads. Figure 3-23: Certain tasks performed on a data node generate additional data nodes. The example shows the Aligned read nodes, which was generated upon alignment of the Unaligned reads node Chapter 3 : Creating and Analyzing a Project 23 3.4.3 Running a task To run a task, select a data node and then locate the task you wish to perform from the task pane. Mouse over to see a description of the action to be performed (Figure 3-24). Click the specific task, set the additional parameters, and click Finish. The task will be scheduled, the display will refresh, and the screen will return to the project’s Analyses tab. In Figure 3-24, the aligner Bowtie 2 was selected and the choices for the aligner index and additional alignment options appeared. Figure 3-24: Running a task in the Analyses tab of Partek Flow. Dialog boxes to set the parameters appear (the example shown on insets is alignment of unaligned reads) Tasks that are currently running (or scheduled in the queue) appear in a lighter shade of blue. The progress of the task is indicated by the darkening of the color blue within the task node from left to right. Hovering the mouse pointer over the node will highlight the related nodes (with a thin black outline) and display the status of the task (Figure 3-25). If a task is expected to generate data nodes, expected nodes appear even before the task is completed. They will have a lighter shade of color to indicate that they have not yet been generated as the task is still being performed. Once all tasks are done, all nodes would appear in the same shade of blue such as in Figure 3-23. Chapter 3 : Creating and Analyzing a Project 24 Figure 3-25: A running task showing the progress indicator (the color darkens from left to right). The expected output data node (also in the lighter shade of color) appears, even before the task completes, thus enabling the user to launch additional tasks while the computation is still in progress 3.4.3 Canceling and deleting tasks Tasks can only be cancelled or deleted by the user that started the task. Running or pending tasks can be canceled by clicking the right mouse button on the task node and then selecting Cancel (Figure 3-26). Alternatively, the task node may be selected and the Cancel task selected from the task pane. Chapter 3 : Creating and Analyzing a Project 25 Figure 3-26: Canceling a task may be done by right clicking on the running task or by selecting Cancel task in the task panel Cancelled or failed tasks are flagged by small red circles with exclamation points on the tasks nodes. Data nodes connected to incomplete tasks are also incomplete as no output can be generated (Figure 3-27). For failure due to errors, see the Task details, which will be discussed in the next section. Figure 3-27: Warnings indicate that the task failed (or was cancelled) and the data node is empty (the example shows failure of the subsampling task and, as a consequence, an empty Subsampled reads node) To delete tasks from the project click the right mouse button on the task node and then select Cancel (Figure 3-28). Alternatively, select the task node click Delete task from the task pane. The nodes downstream of this task will be deleted. However, deleting the output files is optional (Figure 3-28, inset). Chapter 3 : Creating and Analyzing a Project 26 Figure 3-28: A task can be deleted by right clicking on the task or selecting Delete task in the task panel. Deleting the task’s output files is optional (inset) In addition to using the right mouse button and the task pane, tasks can also be deleted and cancelled in the Queue tab (see section 3.5). Chapter 3 : Creating and Analyzing a Project 27 3.4.4 Task Results and Task Actions Selecting a task node will reveal a task pane with two sections: Task results and Task actions (Figure 3-29). Figure 3-29: A task pane showing a menu for a task node (different tasks will show different options; an example is shown) Items from the Task results section inform on the action performed in that node. Certain tasks generate a Task report (Figure 3-30), which include any tables or charts that the task may have produced. Figure 3-30: An example of a Task report. A Quantify to a transcriptome task report is shown as an example Chapter 3 : Creating and Analyzing a Project 28 The Task details shows detailed diagnostic information about the task (Figure 3-31). It includes the duration and parameters of the task, lists of input and output files, and the actual commands (in the command line) that were run. Figure 3-31: An example of Task details page. A Quantify to a transcriptome task report is shown as an example Additionally, the Task details page would be where the error logs of unsuccessful runs, similar to the one shown in Figure 3-27, may be obtained. The user can download the logs or send them to Partek. This page plays an important role in diagnosing and troubleshooting issues related to task. Double clicking on a task node will show the Task report page. However, if no report was generated, the user will be directed to the Task details page. In the Task actions sections, the selected task can be Re-run w/new parameters, and in case it is part of a pipeline that includes additional tasks after it, running the Downstream tasks is an option. Re-running tasks will result in Layers and will be described in the following section. Chapter 3 : Creating and Analyzing a Project 29 Another action available for a task node is Add task description (Figure 3-32), which is a way to add notes to the project. The user can enter a description, which will be displayed when the mouse pointer is hovered over the task node. Figure 3-32: Adding a task description. The dialog box is shown, as well as the displayed description upon mouse over (highlighted) (an example is shown) 3.4.5 Layers It is common within next-generation sequencing data analysis to explore different settings of tasks for comparison and optimization. Users may modify an upstream step (for example, the alignment parameters) and inspect the downstream effect on the results (such as percent aligned reads). The implementation of Layers in Partek Flow makes this easy and organized. Instead of creating separate nodes in a pipeline, another set of nodes with a different color is stacked behind ones that have been repeated (Figure 3-33). To see the parameters that were changed between runs, hover the mouse icon over the set of stacked task nodes and a pop-up balloon will display them, with the color of the letters matching the color of each layer. Chapter 3 : Creating and Analyzing a Project 30 Figure 3-33: Analysis showing layers. The same task was repeated with different parameters. Hovering the mouse pointer over the layers shows the parameters that were changed. In the example shown in the figure, the quantification in the blue layer was performed with require_proper_pair argument set to false, while the quantification in the green layer was performed with the require_proper_pair argument set to true Layers are formed when the same task is performed on the same data node more than once. They are also formed when a task node is selected and the Rerun it w/new parameters is selected in the task pane (Figure 3-29). This will allow the users to change the options only for the selected task. The user may choose to re-run the task to which the changes have been made, as well as all the downstream tasks until the analysis is completed. To do so, select Re-run w/new parameters, downstream tasks from the task pane. With layers, only a single task is changed at a time (although several settings of the task can be altered). The options of all the downstream tasks will remain the same. To select a different layer, use the left mouse button to click on any node of the desired layer. All the nodes associated with the selected layer have the same color and will be displayed on the top of the stack. 3.4.6 Downloading your Data Data associated with any data node can be downloaded using the Download data link in the task pane (Figure 3-34). Compressed files will be downloaded to the local computer where the user is accessing the Partek Flow server. Note that bigger files (such as unaligned reads) would take longer to download. For guidance, a file size estimate is provided for each data node. These zipped files can easily be imported by the Partek® Genomics Suite® software, and is the subject of Chapter 15. Chapter 3 : Creating and Analyzing a Project 31 Figure 3-34: Downloading the data from a data node using the task pane (an example is shown) 3.5 The Queue Tab The Queue tab contains a table of the tasks that are running, scheduled, or completed in the Partek Flow project (Figure 3-35). It provides an overview of the task progress, enables task management, and links to detailed reports for each task. Figure 3-35: The Queue tab showing running, waiting, and done tasks (an example is shown) Chapter 3 : Creating and Analyzing a Project 32 Each row of the table corresponds to a task node in the Analyses tab. The list can be sorted according to a specific column using the sort icon . The Task column lists the name of the tasks. On the left of the task name is a colored circle indicating the layer of this task. The column is searchable by task name. Clicking the task name will open the Task report page. If the task did not generate a report, the link will go to the Task details page. The User column identifies the task owner. Aside from the user who created the project, only collaborators and users with admin privileges can start tasks in a project. See section 3.6 of this chapter for further information. Clicking a name in the User column will display the corresponding User profile. The End column shows the task completion time. It will show the actual time for completed tasks, and the estimated time for running tasks. These estimates improve in accuracy as more tasks are completed in the current Partek Flow instance. The Status column displays the current status of the task, such as Waiting, Running, Done, Canceled. If the task is currently running, a status progress bar will appear in the column. Once completed, the status of a task will be Done and the End column will be updated with the completion time. A waiting task is may be waiting for upstream tasks to complete ( waiting for more computing resources to be available ( ). ) or The Action column contains the cancel button ( ) that, if clicked, will allow canceling of the task. Both pending tasks and running tasks can be cancelled. A trash icon ( ) will appear in the Action column for completed, canceled or failed tasks, and will allow the task to be deleted from the project. Deleting a task in the Queue tab will remove the corresponding nodes in the Analyses tab. Unless the user has admin privileges, a user may only cancel and delete a task that he/she started. The User, End, and Status columns may be used to filter ( ) the table. Chapter 3 : Creating and Analyzing a Project 33 3.6 The Collaborators Tab The Collaborators tab provides an overview of users associated with a particular project and enables project creators and administrators to add collaborators (Figure 3-36). A user (without administrator status) has to be specified as a collaborator in a project to be able to access the project in his/her home folder and to perform tasks. To add a collaborator, type a username in the Add a collaborator box and click the button. Previous collaborators may be selected using the dropdown box. To delete a collaborator, select the username and click the Delete selected collaborator button. Figure 3-36: Collaborators tab controls the user accounts that are permitted to work in the current project Chapter 3 : Creating and Analyzing a Project 34 3.7 Project management A project may be renamed or deleted using the Project actions button on the upper right side of the Project View page (Figure 3-37). When deleting a project, the user is given the choice to delete the output files of the project, as well. Figure 3-37: Project actions buttons (highlighted) allow renaming or deleting a project The user can also manage several projects all at once. From the Partek Flow Home Page, the user can see projects that have recent activity. Clicking the link for View all projects will open the Project management page (Figure 3-38). Figure 3-38: Accessing the project management page The Project management page lists all the projects accessible to the current use and the table shows the name, owner, and time of last activity for each project. Clicking a Project name will go to the Project View of the selected project. The list can be sorted according to a specific column using the sort icon . Projects can be renamed ( be created ( ) or deleted, ( ). Additional New projects can also ) from this page. Chapter 3 : Creating and Analyzing a Project 35