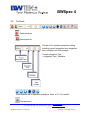
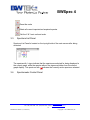
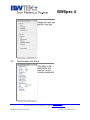
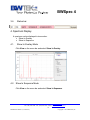
1
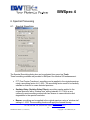
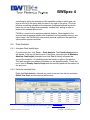
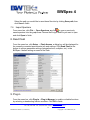
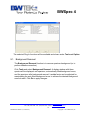
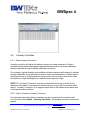
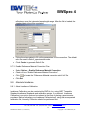
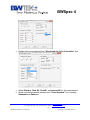
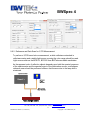
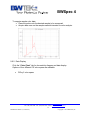
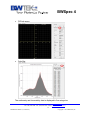
BWSpec 4 BWSpec 4 Array Spectrometer Acquisition Software User Manual 19 Shea Way, Newark, DE 19713, USA ·Web: www.bwtek.com Tel: (302) 368-7824 · Fax: (302) 368-7830 · Email: www.bwtek.com/contact 1 290020018-G BETA 7 (12/12/2011) Copyright © 2011 B&W Tek, Inc. BWSpec 4 TABLE OF CONTENTS 1. Introduction ............................................................................................... 4 2. Installation ................................................................................................. 4 2.1. Operating Systems Supported ...................................................................................... 4 2.2. Installation ........................................................................................................................ 4 3. Software Main Screen .............................................................................. 4 3.1. Menu bar ........................................................................................................................... 5 3.2. Tool bars ......................................................................................................................... 15 3.3. Spectrum List Panel ...................................................................................................... 16 3.4. Spectrometer Control Panel ........................................................................................ 16 3.5. Spectrometer Info Panel ............................................................................................... 17 3.6. Status bar ....................................................................................................................... 18 4. Spectrum Display ................................................................................... 18 4.1. Show In Overlay Mode .................................................................................................. 18 4.2. Show In Sequence Mode .............................................................................................. 18 4.3. Spectrum Display Setting ............................................................................................ 19 4.4. Spectrum Color Setting ................................................................................................ 20 4.5. Spectral Graph Setting ................................................................................................. 21 5. Spectrum View ........................................................................................ 22 5.1. Zoom In ........................................................................................................................... 22 5.2. Pan ................................................................................................................................... 22 5.3. Restore of View .............................................................................................................. 22 5.4. Restore the Initial View ................................................................................................. 23 5.5. Copy and Save the Spectrum as an image ............................................................... 24 5.6. Show Values ................................................................................................................... 24 6. Spectral Processing............................................................................... 25 6.1. Spectral Smoothing ...................................................................................................... 25 19 Shea Way, Newark, DE 19713, USA ·Web: www.bwtek.com Tel: (302) 368-7824 · Fax: (302) 368-7830 · Email: www.bwtek.com/contact 2 290020018-G BETA 7 (12/12/2011) Copyright © 2011 B&W Tek, Inc. BWSpec 4 6.2. Peak Analysis ................................................................................................................. 26 7. Save and Import Spectrum ................................................................... 28 7.1. Save A Single Spectrum ............................................................................................... 28 7.2. Save All Spectra Into ZIP file ....................................................................................... 28 7.3. Save All spectra To One File Folder ........................................................................... 28 7.4. Import Spectrum ............................................................................................................ 29 8. Read Flash ............................................................................................... 29 9. Plug-in ...................................................................................................... 29 9.1. Background Removal ................................................................................................... 30 9.2. Export Data ..................................................................................................................... 31 9.3. Derivative ........................................................................................................................ 32 9.4. Timeline........................................................................................................................... 33 9.5. Linearity Correction ...................................................................................................... 36 9.6. Relative Intensity Correction ....................................................................................... 38 9.7. Reference Materials Correction .................................................................................. 42 9.8. Absolute Irradiance ....................................................................................................... 44 9.9. Color Measurement ....................................................................................................... 49 Appendix A: Irradiance Ratio File Data Definition .................................. 59 Appendix B: Definition of Irradiance Data File Format .......................... 61 19 Shea Way, Newark, DE 19713, USA ·Web: www.bwtek.com Tel: (302) 368-7824 · Fax: (302) 368-7830 · Email: www.bwtek.com/contact 3 290020018-G BETA 7 (12/12/2011) Copyright © 2011 B&W Tek, Inc. BWSpec 4 1. Introduction BWSpec is a spectrometer data acquisition operating software program used for B&W Tek spectrometers. 2. Installation 2.1. Operating Systems Supported 32 bit Windows Operating Systems, including: Windows 98/98 Second Edition Windows ME Windows NT 4 Windows 2000/XP Windows Vista Windows 7 64 bit Windows Operating Systems, including: Windows XP Windows 7 Select an applicable installation package before proceeding with the installations. 2.2. Installation Insert the BWSpec4 CD into the disc tray. An installation screen will appear for installation procedures. Follow the installation instructions through the install wizard. After BWSpec4.00 is installed successfully, a shortcut icon will be created automatically on the desktop. 3. Software Main Screen Spectrometer Models with USB Interfaces Connect the spectrometer to USB Port of computer via USB Cable. Launch BWSpec.exe by clicking the shortcut icon on the Desktop. From the BWSpec4.00 Menu bar: Tools → Flash Access, Click Read Flash, and the unit specific parameters for the unit will be read from the spectrometer to the BWSpec settings through the USB connection. 19 Shea Way, Newark, DE 19713, USA ·Web: www.bwtek.com Tel: (302) 368-7824 · Fax: (302) 368-7830 · Email: www.bwtek.com/contact 4 290020018-G BETA 7 (12/12/2011) Copyright © 2011 B&W Tek, Inc. BWSpec 4 After the “Read Flash Completed” message appears, click “Close” button on the bottom right. The spectrometer is now successfully set up to the connected computer for operation. BWSpec 4 Main User Interface Screen 3.1. Menu bar 3.1.1. File 19 Shea Way, Newark, DE 19713, USA ·Web: www.bwtek.com Tel: (302) 368-7824 · Fax: (302) 368-7830 · Email: www.bwtek.com/contact 5 290020018-G BETA 7 (12/12/2011) Copyright © 2011 B&W Tek, Inc. BWSpec 4 Create New Window Click New Window to create a new window of graph display with applicable panel for use with all available functions. This is a useful tool when loading a saved spectrum for reference or comparison purpose against acquired spectra in separate graphs. Open Spectrum Click Open Spectrum to load one or more spectral files into the graph display. Data Format: BWSpec Data File (*.BwRam) TXT File (*.txt) SPC File (*.spc) BWSpec Data ZIP File (*.BwRamS) Save Selected Spectrum This is for saving the selected spectrum to a folder as specified. Data Format: TXT file (*.txt) 19 Shea Way, Newark, DE 19713, USA ·Web: www.bwtek.com Tel: (302) 368-7824 · Fax: (302) 368-7830 · Email: www.bwtek.com/contact 6 290020018-G BETA 7 (12/12/2011) Copyright © 2011 B&W Tek, Inc. BWSpec 4 CSV file (*.csv) TXT file (even) SPC file (*.spc) BWTek Raman data file format (*.BwRam) Save All Spectra Into A Zip File Use this option to save all spectra to a zip file. Data Format: BWSpec Data ZIP File (*.BwRamS) Save all Spectra Automatically Menu option for saving all spectra into a specified file folder at one time, with each spectrum being saved as a single file inside this folder. Save all Spectra Manually Menu option for saving all spectra into a specified file folder, each spectrum is created as a single file inside this folder. The files are named in sequence as SP_0.txt, SP_1.txt, …, SP_4.txt, etc. But you can also change the file names manually. Print Preview To view the current spectrum on screen as it would appear on the print out. Exit To exit BWSpec 4. A message will be shown if there is a spectrum that has not been saved before exiting the software. 3.1.2. View 19 Shea Way, Newark, DE 19713, USA ·Web: www.bwtek.com Tel: (302) 368-7824 · Fax: (302) 368-7830 · Email: www.bwtek.com/contact 7 290020018-G BETA 7 (12/12/2011) Copyright © 2011 B&W Tek, Inc. BWSpec 4 Show In Overlay To display spectra in one graph as overlays. Show In Sequence To display one spectrum in a graph with a sequence of graphs. Spectrum List Panel This option is for activating a list panel. This panel after being enabled lists sequentially all captured spectra. A spectrum becomes active after it is selected from the list. Otherwise an active spectrum is the last one acquired. Spectrum Info Panel This option is for activating a spectrometer info panel. This panel displays associated operation setting parameters such as integration time used and average time used to the active spectrum. Spectrometer Control Panel This menu option is for a control panel to be displayed for configuring the graph display options. Refer to 3.4 for details. 3.1.3. Acquire 19 Shea Way, Newark, DE 19713, USA ·Web: www.bwtek.com Tel: (302) 368-7824 · Fax: (302) 368-7830 · Email: www.bwtek.com/contact 8 290020018-G BETA 7 (12/12/2011) Copyright © 2011 B&W Tek, Inc. BWSpec 4 Click Acquire One Spectrum to acquire a new spectrum and update to the graph as current display. Click Acquire Continuously to acquire new spectra in a live mode continuously. When stopped the last spectrum is updated to the current graph. Click Acquire Dark to acquire a new spectrum for use as a dark scan. Click Acquire Reference to acquire a new spectrum for use as a reference scan. 19 Shea Way, Newark, DE 19713, USA ·Web: www.bwtek.com Tel: (302) 368-7824 · Fax: (302) 368-7830 · Email: www.bwtek.com/contact 9 290020018-G BETA 7 (12/12/2011) Copyright © 2011 B&W Tek, Inc. BWSpec 4 Click Acquire Overlay to capture a new spectrum and add to the current graph in overlays. Click Stop to terminate the current acquisition in progress. Click Clear Display to clear all spectra displayed from the current graph display. Click Dark Compensate Enable/Disable to turn on or off the electronic dark reference that are available with some detector arrays for automatic dark subtractions based on those available references. 3.1.4. Tools 19 Shea Way, Newark, DE 19713, USA ·Web: www.bwtek.com Tel: (302) 368-7824 · Fax: (302) 368-7830 · Email: www.bwtek.com/contact 10 290020018-G BETA 7 (12/12/2011) Copyright © 2011 B&W Tek, Inc. BWSpec 4 Click Smoothing to open the Smoothing option dialog box. Refer to section 6.1 for more details Click Background Remove to remove the fluorescence background using an automated algorithm for Raman spectral analysis Click Derivative to apply derivative operation to an active spectrum Click Peak Analysis to open the Peak Analysis dialog box. Refer to 6.2 for more details. Click BAC151A Camera to enable the video camera support for BAC151A accessory (for Raman analysis option only) Click Export Data to export collected spectrum into txt file. Click Timeline for programmed spectral data recording. Click Wavelength Calibration to enter wavelength calibration functions. 3.1.5. Option 19 Shea Way, Newark, DE 19713, USA ·Web: www.bwtek.com Tel: (302) 368-7824 · Fax: (302) 368-7830 · Email: www.bwtek.com/contact 11 290020018-G BETA 7 (12/12/2011) Copyright © 2011 B&W Tek, Inc. BWSpec 4 Click Enable / Disable Linearity Correction to enable or disable linearity correction function. A unit specific correction file will need to be supplied in order for the correction to work correctly. Click Enable / Disable Relative Intensity Correction to enable or disable relative intensity correction function. This is a function related to correcting the unit spectral response against a known reference. A unit specific correction file will need to be supplied in order for the correction to function. Click Enable / Disable Reference Material Correction to enable or disable reference material correction function. This function is useful for accurate measurements in applications such as percent reflectance. A reference material with certified reference value file will be needed in order for the correction to work accurately. Click Enable / Disable Irradiance Correction to enable or disable irradiance correction function. A unit specific correction file will need to be supplied in order for the correction to work correctly. 3.1.6. Plug-in Click Plug-in to open the Plug-in Manager dialog box, where all available plug-ins are listed. Check corresponding box to choose the plug-in functions you need. Click Apply and then OK. The settings with checked plug-ins will be saved automatically. 3.1.7. Setup 19 Shea Way, Newark, DE 19713, USA ·Web: www.bwtek.com Tel: (302) 368-7824 · Fax: (302) 368-7830 · Email: www.bwtek.com/contact 12 290020018-G BETA 7 (12/12/2011) Copyright © 2011 B&W Tek, Inc. BWSpec 4 Click Flash Access to access the spectrometer specific info associated with the currently connected spectrometer. Click Display Scales to configure the X/Y settings and scales. Click Custom Setting for custom spectral settings including Spectra Color Setting, Spectral Graph Setting, as well as access to the spectrometer info for the currently connected spectrometer. Click Hardware Setup for spectrometer common settings as well as AuxPort settings. 19 Shea Way, Newark, DE 19713, USA ·Web: www.bwtek.com Tel: (302) 368-7824 · Fax: (302) 368-7830 · Email: www.bwtek.com/contact 13 290020018-G BETA 7 (12/12/2011) Copyright © 2011 B&W Tek, Inc. BWSpec 4 Click Color Setup for color measurement function settings. 3.1.8. Help Click Help → About to find out the current version of the software Click Help → Help.PDF to display the User Manual of the BWSpec 4 software 3.1.9. Language Click Language to select a display language desired for the software: English or Chinese. 19 Shea Way, Newark, DE 19713, USA ·Web: www.bwtek.com Tel: (302) 368-7824 · Fax: (302) 368-7830 · Email: www.bwtek.com/contact 14 290020018-G BETA 7 (12/12/2011) Copyright © 2011 B&W Tek, Inc. BWSpec 4 3.2. Tool bars Open spectrum Save spectrum This bar is for operation parameter setting, including current integration time, integration time, multiplier, and time average. Current Integration Time = Integration Time * Multiplier These buttons are for spectrum acquisition. Refer to 3.1.3 for details. Print spectrum 19 Shea Way, Newark, DE 19713, USA ·Web: www.bwtek.com Tel: (302) 368-7824 · Fax: (302) 368-7830 · Email: www.bwtek.com/contact 15 290020018-G BETA 7 (12/12/2011) Copyright © 2011 B&W Tek, Inc. BWSpec 4 Reset the scale Delete all current imported and acquired spectra. Set the X & Y-axis unit and scale. 3.3. Spectrum List Panel Spectrum List Panel is located on the top-right side of the main screen after being activated. The spectra with √ signs indicate that the spectra are selected for being displayed in the current graph, while the spectra without the signs are hidden from the current graph display. The spectrum with indicates the currently active spectrum selected. 3.4. Spectrometer Control Panel 19 Shea Way, Newark, DE 19713, USA ·Web: www.bwtek.com Tel: (302) 368-7824 · Fax: (302) 368-7830 · Email: www.bwtek.com/contact 16 290020018-G BETA 7 (12/12/2011) Copyright © 2011 B&W Tek, Inc. BWSpec 4 3.5. Spectrometer Info Panel 19 Shea Way, Newark, DE 19713, USA ·Web: www.bwtek.com Tel: (302) 368-7824 · Fax: (302) 368-7830 · Email: www.bwtek.com/contact 17 290020018-G BETA 7 (12/12/2011) Copyright © 2011 B&W Tek, Inc. BWSpec 4 3.6. Status bar 4. Spectrum Display A spectrum can be displayed in two modes: Show In Overlay Show In Sequence 4.1. Show In Overlay Mode Click View on the menu bar and select Show In Overlay. 4.2. Show In Sequence Mode Click View on the menu bar and select Show In Sequence. 19 Shea Way, Newark, DE 19713, USA ·Web: www.bwtek.com Tel: (302) 368-7824 · Fax: (302) 368-7830 · Email: www.bwtek.com/contact 18 290020018-G BETA 7 (12/12/2011) Copyright © 2011 B&W Tek, Inc. BWSpec 4 4.3. Spectrum Display Setting On the menu bar click Setup → Display Scales, or simply click on the tool bar. A dialog box will display, where the scale settings on both X and Y axis can be adjusted. 19 Shea Way, Newark, DE 19713, USA ·Web: www.bwtek.com Tel: (302) 368-7824 · Fax: (302) 368-7830 · Email: www.bwtek.com/contact 19 290020018-G BETA 7 (12/12/2011) Copyright © 2011 B&W Tek, Inc. BWSpec 4 4.3.1. Unit for X-axis Click on X-axis tab, you can set X-axis to one of these three units: Wavelength (nm) Pixel Raman Shift (cm-1) 4.3.2. Unit for Y-axis Click on Y-axis tab, you can set the Y-Axis to: Automatic scale Manual scale Logarithmic Irradiance unit (available when the function is enabled) 4.4. Spectrum Color Setting 19 Shea Way, Newark, DE 19713, USA ·Web: www.bwtek.com Tel: (302) 368-7824 · Fax: (302) 368-7830 · Email: www.bwtek.com/contact 20 290020018-G BETA 7 (12/12/2011) Copyright © 2011 B&W Tek, Inc. BWSpec 4 When more than one spectrum is displayed, each one will have a different color. Initially default colors will be assigned automatically to each spectrum on the spectrum display panel. The colors can be manually changed to designed ones by following the below procedure. On the menu bar, click Setup → Custom Setting → Spectra Color Setting Click on the # of the spectrum you’d like to change, choose color, click OK, and Apply. Click Set to save the setting, or Close to close the window without saving the setting. 4.5. Spectral Graph Setting Spectral Graph Setting is for configuring the graph background color, spectrum display line width, and font size in the graph area. On the menu bar, click Setup → Custom Setting → Spectra Graph Setting 19 Shea Way, Newark, DE 19713, USA ·Web: www.bwtek.com Tel: (302) 368-7824 · Fax: (302) 368-7830 · Email: www.bwtek.com/contact 21 290020018-G BETA 7 (12/12/2011) Copyright © 2011 B&W Tek, Inc. BWSpec 4 A dialog box will show where spectral graph settings can be adjusted. 5. Spectrum View 5.1. Zoom In To zoom in a spectrum, hold down the left mouse button and drag the cursor to make a box around the area you wish to zoom in on. 5.2. Pan Hold “Ctrl” key and hold down left mouse button, move the cursor in the direction of the area you wish to view. 5.3. Restore of View Place cursor in the graph area, right click your mouse and select “Un-Zoom”, to zoom out. 19 Shea Way, Newark, DE 19713, USA ·Web: www.bwtek.com Tel: (302) 368-7824 · Fax: (302) 368-7830 · Email: www.bwtek.com/contact 22 290020018-G BETA 7 (12/12/2011) Copyright © 2011 B&W Tek, Inc. BWSpec 4 5.4. Restore the Initial View Place cursor in the graph area and right click your mouse and select “Undo All Zoom/Pan”, to go back to original spectrum view. You may also use the double-click of the left mouse for the same purpose. 19 Shea Way, Newark, DE 19713, USA ·Web: www.bwtek.com Tel: (302) 368-7824 · Fax: (302) 368-7830 · Email: www.bwtek.com/contact 23 290020018-G BETA 7 (12/12/2011) Copyright © 2011 B&W Tek, Inc. BWSpec 4 5.5. Copy and Save the Spectrum as an image Place cursor in the graph area, right click to select “Copy” or “Save Image As” from the pop-up menu. 5.6. Show Values Place cursor in the spectrum display area, right click to select “Show Values” from the popup menu. Values associated with the current data point of the spectrum in pixel, wavenumber, and wavelength will be displayed. 19 Shea Way, Newark, DE 19713, USA ·Web: www.bwtek.com Tel: (302) 368-7824 · Fax: (302) 368-7830 · Email: www.bwtek.com/contact 24 290020018-G BETA 7 (12/12/2011) Copyright © 2011 B&W Tek, Inc. BWSpec 4 6. Spectral Processing 6.1. Spectral Smoothing The Spectral Smoothing dialog box can be activated from menu bar Tools. Three smoothing methods are provided in BWSpec4 for effective S/N enhancement: FFT (Fast Fourier Transform): smoothing can be applied to the original spectrum using a smoothing factor of in 1-99%. The smoothing factor needs to be carefully selected so that not to cause distorted spectrum. Savitzky-Golay (Savitzky-Golay Filters): smoothing can be applied to the original spectrum with a “window size” setting between 2-5. This is a very commonly used smoothing method with less chance to cause distortion and degradation to the spectral resolution. Boxcar: smoothing can be applied to the original spectrum using a “window size” setting in 1-1023. The smoothing function will apply the forward moving 19 Shea Way, Newark, DE 19713, USA ·Web: www.bwtek.com Tel: (302) 368-7824 · Fax: (302) 368-7830 · Email: www.bwtek.com/contact 25 290020018-G BETA 7 (12/12/2011) Copyright © 2011 B&W Tek, Inc. BWSpec 4 smoothing by taking the averaging of the specified number of pixels plus one pixel on the left to the group and one pixel to the right of the group. This is an effective smoothing operation at the expense of degraded spectral resolution, hence do not use a larger than necessary “window size” setting in order to preserve the needed spectral info. FWHM is a useful tool for analyzing spectral features. When applied to the acquired narrow emission peaks such as peaks from low pressure mercury and argon lamps, the FWHM value can provide practical measure of the particular spectrometer spectral resolution. 6.2. Peak Analysis 6.2.1. Automatic Peak Identification From the menu bar, click Tools → Peak Analysis. The Peak Analysis window will appear. In the top left hand corner of the menu, input the value at Minimum Absolute Peak Height (threshold) and click Find to identify all peaks that exceed the threshold. All identified peaks are listed in a table in the window. This table provides you detailed information on the identified peaks. Check the box in front of Display Peak In Graph and the identified peaks will be marked on the spectrum. 6.2.2. Delete an Identified Peak Right-click Peak Index for the peak you want to remove from the list and select Delete This Peak, and the removal will be done. 19 Shea Way, Newark, DE 19713, USA ·Web: www.bwtek.com Tel: (302) 368-7824 · Fax: (302) 368-7830 · Email: www.bwtek.com/contact 26 290020018-G BETA 7 (12/12/2011) Copyright © 2011 B&W Tek, Inc. BWSpec 4 6.2.3. Add a Peak Manually Check the box for Add or modify a peak manually. Place cursor on the peak you want to add, hold down the left button of the mouse and drag a dotted line around the peak. The boxed peak will be added to the list after the mouse button is releases. 6.2.4. Modify a Peak Manually Check the box for Add or modify a peak manually, hold down left button of mouse to drag a dotted line box around the spectral feature that needs to be modified until you are satisfied with the change. Release the mouse for the modification result to be displayed. 6.2.5. Report Point cursor to a “Peak Index” and activate this line, right click you mouse and select “Export Result” at popup menu, you can view a print preview of the report. 19 Shea Way, Newark, DE 19713, USA ·Web: www.bwtek.com Tel: (302) 368-7824 · Fax: (302) 368-7830 · Email: www.bwtek.com/contact 27 290020018-G BETA 7 (12/12/2011) Copyright © 2011 B&W Tek, Inc. BWSpec 4 7. Save and Import Spectrum 7.1. Save A Single Spectrum From the menu bar, click File → Save A Single Spectrum, or click on the tool bar to save the spectrum. A Save Spectrum window will show where user can select path, name, file type, as well as the data format related choices. Here is another tip for you to save: place cursor on the spectrum name that you wish to save in Spectra List Panel, right click your mouse and select Save This Spectrum to save. 7.2. Save All Spectra Into ZIP file From the menu bar, click File → Save All Spectra Into ZIP File to save all of the displayed spectra as a zip file. The saved spectra will show up in the graph area once you open this file. 7.3. Save All spectra To One File Folder From menu bar, click File → Save All Spectra To One File Folder to save all spectra into a specified file folder, where each spectrum will be saved as a single file. These files will be named as SP_0.txt; SP_1.txt; …, SP_4.txt; … etc. 19 Shea Way, Newark, DE 19713, USA ·Web: www.bwtek.com Tel: (302) 368-7824 · Fax: (302) 368-7830 · Email: www.bwtek.com/contact 28 290020018-G BETA 7 (12/12/2011) Copyright © 2011 B&W Tek, Inc. BWSpec 4 Select the path you would like to save these files into by clicking Save path, then click Save to finish. 7.4. Import Spectrum From menu bar, click File → Open Spectrum, or click to open a previously saved spectrum into the graph area. Choose the file type and file you want to open and click Open to finish. 8. Read Flash From the menu bar, click Setup → Flash Access, a dialog box will be displayed for the currently connected spectrometer info and settings. Click Read Flash at the bottom to restore parameter settings (integration time, multiplier, etc.) to the BWSpec 4 default setting as saved in the flash. 9. Plug-in From the menu bar, click Plug-In →Plug-in Manager to enable or disable functions by selecting or deselecting function modules. Click OK to finish. 19 Shea Way, Newark, DE 19713, USA ·Web: www.bwtek.com Tel: (302) 368-7824 · Fax: (302) 368-7830 · Email: www.bwtek.com/contact 29 290020018-G BETA 7 (12/12/2011) Copyright © 2011 B&W Tek, Inc. BWSpec 4 The selected Plug-In functions will be available and shown under Tools and Option. 9.1. Background Removal The Background Removal function is to remove spectrum background (or to perform baseline correction). Click Tools and select Background Removal. A display window with three spectra will be displayed: raw spectrum, automatically fitted background curve, and the spectrum after background removal. Lambda factor can be adjusted for manipulating the auto fitted background so as to achieve the desired background removal result. Click Do to apply changes. 19 Shea Way, Newark, DE 19713, USA ·Web: www.bwtek.com Tel: (302) 368-7824 · Fax: (302) 368-7830 · Email: www.bwtek.com/contact 30 290020018-G BETA 7 (12/12/2011) Copyright © 2011 B&W Tek, Inc. BWSpec 4 Raw spectrum Fitted background curve Background removed 9.2. Export Data Click Tools from the menu. Choose Export Data→ Export All Spectra Data, a dialog box will show up. Select the data information you want to export, click Save as button. All spectra data will be exported and saved into a text file. 19 Shea Way, Newark, DE 19713, USA ·Web: www.bwtek.com Tel: (302) 368-7824 · Fax: (302) 368-7830 · Email: www.bwtek.com/contact 31 290020018-G BETA 7 (12/12/2011) Copyright © 2011 B&W Tek, Inc. BWSpec 4 9.3. Derivative Click Tools Derivative, next click, a dialogue box will appear for spectral derivative function options. Three derivative methods are provided for possible data pretreatment use: Point Diff: Savitzky-Golay Differential: Select the desired derivative method, check Apply Derivative box to apply the derivative calculation to the currently active spectrum. 19 Shea Way, Newark, DE 19713, USA ·Web: www.bwtek.com Tel: (302) 368-7824 · Fax: (302) 368-7830 · Email: www.bwtek.com/contact 32 290020018-G BETA 7 (12/12/2011) Copyright © 2011 B&W Tek, Inc. BWSpec 4 9.4. Timeline Timeline function provides automated, timed recording of spectra according to the scheduled time interval settings with acquired spectrum at the time specified and saved into individual files. 9.4.1. Timeline (Equal Integration Time) Click Tools→Timeline→Timeline (Equal Integration Time), a dialogue box will appear. Before starting timeline scan, you need to enter the settings in this box, including interval time, number of scans, file name prefix, file name postfix, and save button to start timeline scan. The spectra collected will be saved in the path. Click designated path. If no specific suffix is assigned, default _1, _2… will be assigned to each spectrum. 19 Shea Way, Newark, DE 19713, USA ·Web: www.bwtek.com Tel: (302) 368-7824 · Fax: (302) 368-7830 · Email: www.bwtek.com/contact 33 290020018-G BETA 7 (12/12/2011) Copyright © 2011 B&W Tek, Inc. BWSpec 4 9.4.2. Timeline (Gradient Integration Time) Click Tools and select Timeline, next click Timeline (Gradient Integration Time), a dialogue box will appear. 19 Shea Way, Newark, DE 19713, USA ·Web: www.bwtek.com Tel: (302) 368-7824 · Fax: (302) 368-7830 · Email: www.bwtek.com/contact 34 290020018-G BETA 7 (12/12/2011) Copyright © 2011 B&W Tek, Inc. BWSpec 4 With gradient integration time, the integration time will change automatically according to the setting. When you finish one time acquisition, the integration time will automatically plus a step time on your last integration time, which will then be you next acquisition integration time. You can input step time in the dialogue box below. After each scan, the integration time will plus this step time as your next acquisition integration time to be used. 9.4.3. Timeline Load To automatically load the files that were saved previously, click Tools and select Timeline → Timeline load, click load path to select the folder location of the timeline data while the corresponding files are displayed on the Spectrum display panel. Click button to automatically load each and every data file one by one. Click button to manually load the spectrum file forward, one at a time. Click button to manually load the spectrum file backwards, one at a time. Click button to resize the Timeline Load window. 19 Shea Way, Newark, DE 19713, USA ·Web: www.bwtek.com Tel: (302) 368-7824 · Fax: (302) 368-7830 · Email: www.bwtek.com/contact 35 290020018-G BETA 7 (12/12/2011) Copyright © 2011 B&W Tek, Inc. BWSpec 4 9.5. Linearity Correction 9.5.1. About Linearity Correction Linearity correction will adjust the detector array’s non-linear response to follow a calculated linear relationship against received detector photons using the calibration function obtained through a linearity calibration correction. For example a typical detector array exhibits nonlinear response with respect to incident photons especially at low light level as well as close to the saturations. In these regions doubling photons or doubling detector exposure time will no longer result in two times the detector’s output deviating from a desired linear response range. NOTE: The “Linearity Correction” must be conducted by the factory in order for the calibration information to be saved into device memory; a copy will be recorded at the factory. “Linearity Correction” is an upgrade option item to be ordered at the same time of the spectrometer purchase 9.5.2. How to Conduct a Linearity Correction For advanced users the linearity correction may be conducted at the customer site. From the menu bar, Option→Linearity Correction. The linearity correction window will appear. 19 Shea Way, Newark, DE 19713, USA ·Web: www.bwtek.com Tel: (302) 368-7824 · Fax: (302) 368-7830 · Email: www.bwtek.com/contact 36 290020018-G BETA 7 (12/12/2011) Copyright © 2011 B&W Tek, Inc. BWSpec 4 Set the parameters for linearity correction on the screen. Press Press Press to start collecting the scans needed for linearity correction. to collect a dark scan with light off. to calculate linearity correction coefficients. The Linearity Coefficients will be displayed on the top of the window along with a message: 19 Shea Way, Newark, DE 19713, USA ·Web: www.bwtek.com Tel: (302) 368-7824 · Fax: (302) 368-7830 · Email: www.bwtek.com/contact 37 290020018-G BETA 7 (12/12/2011) Copyright © 2011 B&W Tek, Inc. BWSpec 4 The linearity correction coefficients have been saved to para.ini file [YAXIS_CORRECTION] section. NOTE: Make a backup copy of the parameter file with the new Linearity Coefficients that have been written to them for future reference. Once the Flash is reread the Linearity Coefficients will be lost. If you save a copy of the parameter file with the Linearity Coefficients already saved on it, you may Import this parameter file into the BWSpec software when needed. NOTE: The key for a successful linearity correction calibration setup is to provide an adjustable intensity light input into the spectrometer to be calibrated so that the spectrometer shows a light response 500-1000 counts above its dark levels at its shortest integration time. This will provide the calibration with maximum useable calibration dynamic ranges. 9.5.3. Activate Linearity Correction To activate linearity correction, from the menu bar Option → Enable /Disable Linearity Correction. 9.6. Relative Intensity Correction 9.6.1. About Relative Intensity Correction Relative intensity correction is specific for Raman spectrometer users. Its purpose is to correct individual spectrometer’s unique relative spectral responses against a traceable standard. The corrected spectral response of a Raman spectrometer makes it possible for meaningful comparisons between data obtained from different instruments. The calibrated spectral response also reveals quantitative vibrational intensity information between different Raman features within a given Raman spectrum. The relative intensity correction involves the use of Standard Reference Material 2241 (SRM 2241) for Raman spectrometers where a 785nm excitation laser source is used, and SRM2242 where a 532nm excitation laser source is used. 9.6.2. How to conduct a relative intensity correction This calibration is an option a customer may order at the time of purchase. For advanced users this may be conducted at a customer site with appropriate equipment. 19 Shea Way, Newark, DE 19713, USA ·Web: www.bwtek.com Tel: (302) 368-7824 · Fax: (302) 368-7830 · Email: www.bwtek.com/contact 38 290020018-G BETA 7 (12/12/2011) Copyright © 2011 B&W Tek, Inc. BWSpec 4 You must have a Probe connected to a Raman system or a Laser and a spectrometer in order to get proper results. Make sure that the wavelength of the excitation laser you are using is entered into the Raman Excitation Laser Wavelength page on the Display Scales, for example, 785nm. Determine the appropriate integration time: use the standard reference material SRM2241 (for 785nm) or SRM2242 (for 532nm) to run a scan. The integration time of the scan should be adjusted to the value so that the highest intensity level is just below saturation level (65000 counts). Run a dark scan with the same integration time. For B&W Tek Raman system the laser turns off automatically when dark scan is collected. For modular Raman spectrometer, make sure the laser is off when a dark scan is collected. Run a reference scan using SRM2241 (or SRM2242) with the same integration time, with laser being turned on. 19 Shea Way, Newark, DE 19713, USA ·Web: www.bwtek.com Tel: (302) 368-7824 · Fax: (302) 368-7830 · Email: www.bwtek.com/contact 39 290020018-G BETA 7 (12/12/2011) Copyright © 2011 B&W Tek, Inc. BWSpec 4 From the menu bar, Option → Relative Intensity Correction. The Relative Intensity Correction window will appear. 19 Shea Way, Newark, DE 19713, USA ·Web: www.bwtek.com Tel: (302) 368-7824 · Fax: (302) 368-7830 · Email: www.bwtek.com/contact 40 290020018-G BETA 7 (12/12/2011) Copyright © 2011 B&W Tek, Inc. BWSpec 4 Select appropriate standard material (for example, SRM2241) Select “Use Current Spectrum” Enter correction range (left position, right position) Set the ratio file name and the path where the ratio file will be stored. Click Create button. The Relative Intensity Correction file is created and the Ratio3 file is saved in the designated path. 9.6.3. Apply Relative Intensity Correction To turn on relative intensity correction feature, from the menu bar Option → Enable /Disable Relative Intensity Correction. Check the box “Enable Relative Intensity Correction”, and click on with. Click Set to apply. to locate the Ratio3 file specific to the system calibrated 19 Shea Way, Newark, DE 19713, USA ·Web: www.bwtek.com Tel: (302) 368-7824 · Fax: (302) 368-7830 · Email: www.bwtek.com/contact 41 290020018-G BETA 7 (12/12/2011) Copyright © 2011 B&W Tek, Inc. BWSpec 4 9.7. 9.7.1. Reference Materials Correction About Reference Material Correction In applications such as in diffused reflectance measurements, a certified reflectance standard is often used to serve as a reference. The %R values throughout the measurement range are then calculated by using ratios with respect to the reference in a relative sense. With the available certified %R values the BWSpec software can calculate the “absolute reflectance” against the reference. The following is a table of a typical certified PTFE type material spectral reflectance white diffuse reflectance standard (SRS-99-010) Wavelength (nm) Certified %R value Wavelength (nm) Certified %R value 360 370 380 390 400 410 98.5 98.7 98.7 98.7 98.8 98.8 600 610 620 630 640 650 98.9 98.9 98.9 98.9 98.9 98.9 19 Shea Way, Newark, DE 19713, USA ·Web: www.bwtek.com Tel: (302) 368-7824 · Fax: (302) 368-7830 · Email: www.bwtek.com/contact 42 290020018-G BETA 7 (12/12/2011) Copyright © 2011 B&W Tek, Inc. BWSpec 4 420 430 440 450 460 470 480 490 500 510 520 530 540 550 560 570 580 590 98.8 98.8 98.8 98.8 98.8 98.8 98.9 98.9 98.9 98.9 98.9 98.9 98.9 98.9 98.9 98.9 98.9 98.9 660 670 680 690 700 710 720 730 740 750 760 770 780 790 800 810 820 830 98.9 98.9 98.9 98.9 99.0 98.9 99.0 98.9 98.9 99.0 98.8 98.9 98.9 98.9 99.0 98.9 99.0 98.9 If we define %Rs (non-correction) as the sample percent reflectance at a given wavelength: %Rs (non-correction) = (Sample intensity/Reference intensity)*100 After reference material correction: %Rs (absolute) = %Rs(non-correction) * Certified %R value/100 where all values are calculated at given wavelengths across the calibrate wavelength range. 9.7.2. Generate Reference Material Correction Ratio File This section is for advanced users only. Collect a spectrum using reference materials. Select Option→ Reference Material Collection. Click to browse to locate the “Reference Material ratio.txt” file. You will be directed to the default path where this file is stored at: C:\Program Files\BWTEK\BWSpec4\ratio\. This file contains the certified values of spectral 19 Shea Way, Newark, DE 19713, USA ·Web: www.bwtek.com Tel: (302) 368-7824 · Fax: (302) 368-7830 · Email: www.bwtek.com/contact 43 290020018-G BETA 7 (12/12/2011) Copyright © 2011 B&W Tek, Inc. BWSpec 4 reflectance over the interested wavelength range. After the file is loaded, the standard data info will be populated. Follow the steps stated to fill out the parameters for the correction. The default ratio file name is Ratio2_spectrometer-code. Clock Create to generate Ratio2 file. 9.7.3. Enable Reference Material Correction Files Select Option→ Enable Reference Material Correction. Check on box “Enable Reference Material Correction”. to locate the “Reference Material correction ratio2.txt” file. Click Click Set. 9.8. Absolute Irradiance 9.8.1. About Irradiance Calibration Irradiance Calibration can be conducted by BWTek, Inc. using NIST Traceable Standard Irradiance Standards and calibration setups, if so desired. Irradiance Calibration is an option that can be ordered at the time of placing a spectrometer purchase. Before activating your Irradiance Calibrated unit, using the accompanied calibration file, Linearity Correction should be performed first. 19 Shea Way, Newark, DE 19713, USA ·Web: www.bwtek.com Tel: (302) 368-7824 · Fax: (302) 368-7830 · Email: www.bwtek.com/contact 44 290020018-G BETA 7 (12/12/2011) Copyright © 2011 B&W Tek, Inc. BWSpec 4 9.8.2. How to Conduct Irradiance Calibration This section is for advanced users only. In order to conduct Irradiance Calibration, you must first have a NIST Traceable Lamp Source with Certified Values which cover the spectral range you will be calibrating your spectrometer to and .DAT file that will have accompanied your lamp. Another factor is having the correct input optics for your spectrometer to collect the light such as a fiber and Collimating Lens, as an example. The spectral irradiance calibration will allow a spectrometer to convert spectral measurements to absolute spectral irradiance measurements in units of light power in W, mW or µW / [cm2*nm]. Alternatively, a spectral irradiance calibration can be used to calibrate the spectrometer for emissive photometric measurements, such as measurements of the color of an emissive source (for example, LED). Your setup conditions, distance from source, and lamp current, must be as close as possible to what your NIST Certificate states in order to conduct a successful calibration process. Ideally, the light source should slightly under fill the spectrometer’s angular aperture. The light source illuminates the spectrometer at a distance specified in the lamp source’s calibration data. Given the correct experimental setup the spectral irradiance calibration proceeds as follows with the assumption that the spectrometer is equipped with a suitable input optic and linearity correction: Adjust the integration time so that the maximum spectral response feature is just below the spectrometer saturation level against the certified lamp at a specified distance. Stop the acquisition and freeze all physical setup with minimal disturbance. 19 Shea Way, Newark, DE 19713, USA ·Web: www.bwtek.com Tel: (302) 368-7824 · Fax: (302) 368-7830 · Email: www.bwtek.com/contact 45 290020018-G BETA 7 (12/12/2011) Copyright © 2011 B&W Tek, Inc. BWSpec 4 Creation of Irradiance Ratio File: From the Menu Bar, select Option → Irradiance Correction. Follow the steps stated in the following window to proceed with irradiance calibration procedure. 19 Shea Way, Newark, DE 19713, USA ·Web: www.bwtek.com Tel: (302) 368-7824 · Fax: (302) 368-7830 · Email: www.bwtek.com/contact 46 290020018-G BETA 7 (12/12/2011) Copyright © 2011 B&W Tek, Inc. BWSpec 4 Step 1: Turn off light, take a dark scan. Then turn on light, take a single raw data scan. Step 2: Click button and locate the lamp data file for the light source you are using for irradiance calibration. Your lamp data file must be configured in a manner in which BWSpec can read it. Please see the Appendix at the end of this manual section called “Definition of Irradiance Data File Format” for information on formatting. You can also view the file “D301.dat” for an example of format, which can be located in the folder where BWSpec is installed. Step 3: Input the distance for your NIST Calibrated Light Source, at which it was calibrated. This information will be contained on your Certificate or the .DAT file. Step 4: Coefficient Order, used for Curve Fit, default value 7. Step 5: Select which spectrum to use for your Reference Data. If you’ve already taken a “Reference Scan”, select “Use Current Reference Data” Step 6: Select the distance that you have setup between your input optic and your certified light source. Also make sure to enter into the dialog box all calibration related information such as the additional optics used, etc.. Be careful to select correct units to match the certified data provided as in the reference certified lamp data file. 19 Shea Way, Newark, DE 19713, USA ·Web: www.bwtek.com Tel: (302) 368-7824 · Fax: (302) 368-7830 · Email: www.bwtek.com/contact 47 290020018-G BETA 7 (12/12/2011) Copyright © 2011 B&W Tek, Inc. BWSpec 4 Step 7: Input transmittance of neutral density filters Step 8: Name the ratio File in which you would like it to be saved as. We suggest your keep the default naming scheme, “Ratio1_C-code” of the spectrometer. Save Path: Location to where the ratio file will be saved to. Step 8: Click Create to generate the “Irradiance Ratio File” 9.8.3. Apply Irradiance Ratio File Select Option→ Enable /Disable Irradiance Correction Check on box “Enable Irradiance Correction”. Click to locate the irradiance correction “Ratio1.txt” file. Click Set. Click “Absolute Irradiance” on the Spectrometer Control Panel. The Absolute Irradiance curve will show on the display. You may need to adjust the X-axis and Y-axis scales in order to get the suitable display scale settings. 19 Shea Way, Newark, DE 19713, USA ·Web: www.bwtek.com Tel: (302) 368-7824 · Fax: (302) 368-7830 · Email: www.bwtek.com/contact 48 290020018-G BETA 7 (12/12/2011) Copyright © 2011 B&W Tek, Inc. BWSpec 4 9.9. Color Measurement 9.9.1. About Color Measurement The color measurement is to characterize an object (for example, illumination source) in terms of its chromaticity and radiometry. Chromaticity refers to the quality of the object regardless of its luminance, while radiometry measures the radiant energy or electromagnetic energy of the object. The color measurement result shown in the “Color Chart” tab will only be made available when the spectrometer in use covers from at least 400 nm through no shorter than 700 nm spectral range. Before performing a color measurement, the system should be normalized or irradiance calibrated. From the menu bar, select Setup → Color Setup. A dialog box will display, where the settings for color measurement can be adjusted. Inside the box for “Color Calculation Source”, a dropdown menu will allow user to choose between %T/R or Irradiance for the measurement. 19 Shea Way, Newark, DE 19713, USA ·Web: www.bwtek.com Tel: (302) 368-7824 · Fax: (302) 368-7830 · Email: www.bwtek.com/contact 49 290020018-G BETA 7 (12/12/2011) Copyright © 2011 B&W Tek, Inc. BWSpec 4 Radiant unit can be selected from “Wavelength for Color Calculation” box: Select Distance, Start WL, End WL, and Interval WL for the measurement. Select color measurement standard from “Color Standard” box, including Illuminant and Observer. 19 Shea Way, Newark, DE 19713, USA ·Web: www.bwtek.com Tel: (302) 368-7824 · Fax: (302) 368-7830 · Email: www.bwtek.com/contact 50 290020018-G BETA 7 (12/12/2011) Copyright © 2011 B&W Tek, Inc. BWSpec 4 9.9.2. Reference and Dark Scan for %T/R Measurement To perform a %T/R based color measurement, a white reflectance standard in reflectance setup and a stable light source covering the color range should be used. Light sources such as the BPS101, BPS120 from BWTek are suitable candidates. As the apparent color of reflective objects depends upon both the spectral response of the spectrometer and the spectral output of the illumination source, a reflectance reference scan should be performed often so that the error due to the lamp drift is minimized. 19 Shea Way, Newark, DE 19713, USA ·Web: www.bwtek.com Tel: (302) 368-7824 · Fax: (302) 368-7830 · Email: www.bwtek.com/contact 51 290020018-G BETA 7 (12/12/2011) Copyright © 2011 B&W Tek, Inc. BWSpec 4 Connect the Light Source and the spectrometer via a fiber reflectance probe. Turn on the light source and allow it to warm up. Perform a Reference Scan Dark Scan using the same integration as the reference scan. Make sure to place the probe onto an absorbing black material or physically block the light from entering into the probe for dark scan. 9.9.3. Irradiance for Color Measurement To perform irradiance calibration based color measurement: From the menu bar, select Setup → Color Setup. A dialog box will display, where the settings for color measurement can be adjusted. Inside the box for “Color Calculation Source”, select Irradiance for the measurement. Enable irradiance calibration from Option → Enable /Disable Irradiance Correction, and select the corresponding irradiance correction ratio file (Ratio 1_***.txt). Calculate color perceived with the “Photopic” or “Scotopic”. 9.9.4. Color Analysis 19 Shea Way, Newark, DE 19713, USA ·Web: www.bwtek.com Tel: (302) 368-7824 · Fax: (302) 368-7830 · Email: www.bwtek.com/contact 52 290020018-G BETA 7 (12/12/2011) Copyright © 2011 B&W Tek, Inc. BWSpec 4 To acquire sample color data: Place the probe onto the desired sample to be measured. Acquire data scan on the sample material intended for color analysis. 9.9.5. Data Display Click the “Color Chart” tab for chromaticity diagram and data display. Options of four different CIE color space are available: CIE xyY color space 19 Shea Way, Newark, DE 19713, USA ·Web: www.bwtek.com Tel: (302) 368-7824 · Fax: (302) 368-7830 · Email: www.bwtek.com/contact 53 290020018-G BETA 7 (12/12/2011) Copyright © 2011 B&W Tek, Inc. BWSpec 4 CIE Luv space 19 Shea Way, Newark, DE 19713, USA ·Web: www.bwtek.com Tel: (302) 368-7824 · Fax: (302) 368-7830 · Email: www.bwtek.com/contact 54 290020018-G BETA 7 (12/12/2011) Copyright © 2011 B&W Tek, Inc. BWSpec 4 CIE Lab space Color Bar The radiometry and chromaticity data is displayed in five categories. 19 Shea Way, Newark, DE 19713, USA ·Web: www.bwtek.com Tel: (302) 368-7824 · Fax: (302) 368-7830 · Email: www.bwtek.com/contact 55 290020018-G BETA 7 (12/12/2011) Copyright © 2011 B&W Tek, Inc. BWSpec 4 Radiometric Data Color Data 19 Shea Way, Newark, DE 19713, USA ·Web: www.bwtek.com Tel: (302) 368-7824 · Fax: (302) 368-7830 · Email: www.bwtek.com/contact 56 290020018-G BETA 7 (12/12/2011) Copyright © 2011 B&W Tek, Inc. BWSpec 4 Luminous Intensity 19 Shea Way, Newark, DE 19713, USA ·Web: www.bwtek.com Tel: (302) 368-7824 · Fax: (302) 368-7830 · Email: www.bwtek.com/contact 57 290020018-G BETA 7 (12/12/2011) Copyright © 2011 B&W Tek, Inc. BWSpec 4 Raw Data Color Save Click Color Data Save to save the color data into BWSpec Color TXT file (.*txt) There are three Color Chart Options available for color diagram setting: o Show Background o Show Grid Lines o Show Wavelength Values 19 Shea Way, Newark, DE 19713, USA ·Web: www.bwtek.com Tel: (302) 368-7824 · Fax: (302) 368-7830 · Email: www.bwtek.com/contact 58 290020018-G BETA 7 (12/12/2011) Copyright © 2011 B&W Tek, Inc. BWSpec 4 Appendix A: Irradiance Ratio File Data Definition Ratio.txt File details and explanation of data: RATIO.TXT INFORMATION BWSpec Version=BWSpec 3.26 Ratio File Version=1.0 CCode=XXX Int.Time=1100 Distance=75 Lamp Name=350-780.DAT Lamp StartWL=350 Lamp EndWL=780 Lamp IncWL=10 Lamp Measure Distance=75 Lamp Unit Index=2 Lamp Coefs Order=7 Coefs_C0=-102.802359649056 Coefs_C1=1.38796702045458 Coefs_C2=-0.00789398471358277 Coefs_C3=2.45424259313939E-5 Coefs_C4=-4.51571710685247E-8 Coefs_C5=4.93405335866037E-11 Coefs_C6=-2.9685358194907E-14 Coefs_C7=7.588143959E-18 irrands_yaxis_min=0 irrands_yaxis_max=4.38087481104945 irrands_DispWLMin=350 irrands_DispWLMax=780 start_wv_irrands=350 EXPLANATION Software Version Ratio File Version C-code of Unit Integration Time Data was acquired at for the Ratio File Fiber to Light Source Distance used to create Ratio File Name of Lamp Data File Used Starting WL of Lamp Data File Used Ending WL of Lamp Data File Used Increments of WL pts from Start WL Distance Lamp Data file was created Index 0 =W/cm^2/nm; Index 1 = mW/cm^2/nm; Index 2 = uW/cm^2/nm; Units will match the Lamp Data file and the units of the Order of curve fit Curve Fit Values Curve Fit Values Curve Fit Values Curve Fit Values Curve Fit Values Curve Fit Values Curve Fit Values Curve Fit Values Y-axis minimum value, based on the start WL for the irradiance range Y-axis maximum value, based on irradiance WL range chosen Display Scales Settings Display Scales Settings Start WL for Irradiance Calibration (should match Lamp StartWL) 19 Shea Way, Newark, DE 19713, USA ·Web: www.bwtek.com Tel: (302) 368-7824 · Fax: (302) 368-7830 · Email: www.bwtek.com/contact 59 290020018-G BETA 7 (12/12/2011) Copyright © 2011 B&W Tek, Inc. BWSpec 4 end_wv_irrands=780 interval_wv_irrands=10 Pixel ; Ratio End WL for Irradiance Calibration (should match Lamp EndWL) Increments of WL pts from Start WL to End WL (should match Lamp Pixel value ; Ratio (w/out Linearity Correction); Ratio (with Linearity Correction) 272;5.88055754188743E5;4.87368884634631E-5 273;6.81553361643328E-5;5.60679388523222E-5 274;7.19969136787624E-5;5.9194063207757E-5 275;7.51481427041512E-5;6.17289907679508E-5 276;6.89485036671211E-5;5.70395476167662E-5 277;7.6339758550259E-5;6.28272853236966E-5 278;7.85587836791279E-5;6.46321960184881E-5 279;7.76122094106046E-5;6.39171821593676E-5 280;7.9296241566551E-5;6.53590352790445E-5 19 Shea Way, Newark, DE 19713, USA ·Web: www.bwtek.com Tel: (302) 368-7824 · Fax: (302) 368-7830 · Email: www.bwtek.com/contact 60 290020018-G BETA 7 (12/12/2011) Copyright © 2011 B&W Tek, Inc. BWSpec 4 Appendix B: Definition of Irradiance Data File Format Example of a Certified Reference Lamp data file (ie. D300.DAT, Tungsten lamp) Light Touch Software Data File 2.3a 0 TUNGSTEN 16V/6A 2020-31B W/Supp.Lens,NM-7DH 290-1110nm,DC-51C 200-1010nm,Silicon 200-1100nm 06-13-2003 14:38:16 RS-10A S/N:HL0191 IRRADIANCE 5 --------------------------- start flag 350 ---------------------------- wavelength start (nm) 1100 ---------------------------- wavelength end (nm) 10 ---------------------------- wavelength step (nm) 4.762099E-02 --------------------Irradiance of wavelength (350+0*10)= 350nm 5.982313E-02 --------------------Irradiance of wavelength (350+1*10)= 360nm 7.276911E-02 --------------------Irradiance of wavelength (350+2*10)= 370nm 8.726646E-02 --------------------Irradiance of wavelength (350+3*10)= 380nm 0.1042587 --------------------Irradiance of wavelength (350+4*10)= 390nm ….. ….. 2.50559 2.489993 2.474348 2.460915 5 --------------------Irradiance of wavelength (350+82*10)= 1070 nm --------------------Irradiance of wavelength (350+83*10)= 1080 nm --------------------Irradiance of wavelength (350+84*10)= 1090 nm --------------------Irradiance of wavelength (350+85*10)= 1100 nm --------------------------- end flag D300.DAT at c:\program files\BWTEK\BWSpec 4\ Files \ Irradiance\Source\ Lamp Data\ 19 Shea Way, Newark, DE 19713, USA ·Web: www.bwtek.com Tel: (302) 368-7824 · Fax: (302) 368-7830 · Email: www.bwtek.com/contact 61 290020018-G BETA 7 (12/12/2011) Copyright © 2011 B&W Tek, Inc.