1
HelpAndManual_unregistered_evaluation_copy
NET Reports 3.0
© psgsdk.com
HelpAndManual_unregistered_evaluation_copy
NET Reports 3.0
© psgsdk.com
All rights reserved. No parts of this work may be reproduced in any form or by any means - graphic, electronic, or
mechanical, including photocopying, recording, taping, or information storage and retrieval systems - without the
written permission of the publisher.
Products that are referred to in this document may be either trademarks and/or registered trademarks of the
respective owners. The publisher and the author make no claim to these trademarks.
While every precaution has been taken in the preparation of this document, the publisher and the author assume no
responsibility for errors or omissions, or for damages resulting from the use of information contained in this document
or from the use of programs and source code that may accompany it. In no event shall the publisher and the author be
liable for any loss of profit or any other commercial damage caused or alleged to have been caused directly or
indirectly by this document.
Printed: September 2012 in (whereever you are located)
Publisher
psgsdk.com
Production
psgsdk.com
Contents
I
Table of Contents
Foreword
0
Part I Introduction
2
1 Overview ...................................................................................................................................
Part II User manual
2
6
1 Install and...................................................................................................................................
setup
6
2 User interface
...................................................................................................................................
8
3 Running report
...................................................................................................................................
10
4 Report types
...................................................................................................................................
12
Files
..........................................................................................................................................................
Print Report
..........................................................................................................................................................
CrossTab
..........................................................................................................................................................
Report
Ms. Excel..........................................................................................................................................................
PivotTable
Ms. Excel..........................................................................................................................................................
WorkSheet
DashBoard
..........................................................................................................................................................
report
Part III Administrator manual
12
14
15
16
17
17
20
1 Server - Install
...................................................................................................................................
and setup
20
2 Config
...................................................................................................................................
22
3 Users management
...................................................................................................................................
26
4 Reports management
...................................................................................................................................
28
Edit report
..........................................................................................................................................................
Variables
.........................................................................................................................................................
interface
SQL.........................................................................................................................................................
procedures
Output
.........................................................................................................................................................
List - Print .........................................................................................................................................
List - Excel .........................................................................................................................................
CrossTab .........................................................................................................................................
Excel PivotTable
.........................................................................................................................................
Dashboard .........................................................................................................................................
5 Users access
...................................................................................................................................
rights
Index
30
32
35
37
38
41
42
43
43
46
0
© psgsdk.com
I
Introduction
Part
I
Introduction
1
2
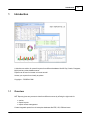
Introduction
A client/server solution for powerful reports from different databases like MS. Sql, Oracle, Postgress,
MySql and any other database server.
Reports can be used in Intranet or Internet as well.
Access your reports from virtually anywhere.
Copyright Ó PSGSDK.COM
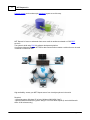
1.1
Overview
NET Reports gives easy access to data from different sources by offering the right tools for:
· queries
· reports layouts
· reports access management
Create integrated reports from all enterprise databases like ERP, HR, CRM and more.
© psgsdk.com
3
NET Reports 3.0
Dynamic reports and a modern style dashboard report are a click away.
NET Reports 3.0 uses an advanced client server multi tier architecture based on PSG REST
services.
The system is build using PSG 2.0 software development platform.
It's robust architecture based on HTTPS for data communication creates a solution that can be used
in Intranet or Internet as well.
High availability, access your NET Reports server from virtually anywhere in the world.
Required:
- Operating system: Windows XP or later (Windows 2000,2003,Vista,7)
- Microsoft Office and Ms.Query (Office setup) to run PivotTables reports (it work with Microsoft
Office 32 bit releases only).
© psgsdk.com
Introduction
© psgsdk.com
4
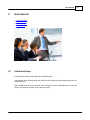
User manual
Part
II
User manual
2
User manual
1.
2.
3.
4.
2.1
Install and setup
User Interface
Running reports
Report types
Install and setup
Download and install the client application (nr30setup.zip):
Administrator rights are required as the setup kit need to properly install components under the
system account.
After installation switch to user account, open the program from the desktop shortcut and press
"Setup" (this settings are kept on local account profile).
© psgsdk.com
6
7
NET Reports 3.0
Set the server address here (ask your system administrator for details)
Server address (one of next):
- computer name (local network only)
- domain name
- Server IP or NAT router Internet IP
© psgsdk.com
User manual
8
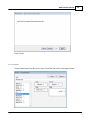
Enter your credits (user and password) and press "Ok" (ask your system administrator for details)
2.2
User interface
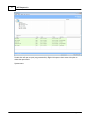
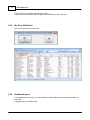
The user interface is a reports explorer with two main areas:
- Reports that can be used, the tree list on top (see "Running reports" for details)
- The used reports results, the bottom grid list
© psgsdk.com
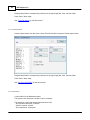
9
NET Reports 3.0
Double click will open a report (any presented list). Right click opens a short menu with option to
delete the report result.
System menu:
© psgsdk.com
User manual
10
Base color - the color used into the interface
Font - system feature, not used here
Select language - the interface labels maybe translated if available
Change password - to change the login password
WebBrowser - HTML Help - The interface uses a small and simple IE based web browser to present
the help file. If, for any reason, you may want to change this, you have to set the path and the
executable file of the new browser.
Help file is available with F1 or from the help menu. HTML pages are used to present the help file
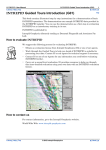
2.3
Running report
There are several report types used by NET Reports.
To run a report, first identify the report into the tree list
© psgsdk.com
11
NET Reports 3.0
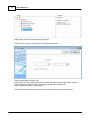
Right text box will offer information about the reports.
Double click on the report, will open the report parameter interface:
Enter the parameters and press "Ok".
Each report may have a different interface, one can have different controls like textbox, datebox,
listbox, combobox, checkbox. There are common controls that are widely used.
Set the reports parameters, all are required.
Press Ok, the request is sent to the server and a new row will appear into the bottom list:
© psgsdk.com
User manual
The STATUS is "NEW", the text below shown the chosen report parameters.
When the report is ready the status changes to "DONE"
Double click on report to open it or right click for a short menu (open/delete report).
Check Reports Types for more details
2.4
Report types
Different report output types are available as fallows:
1.
2.
3.
4.
5.
6.
2.4.1
Files
Print report
CrossTab report
Ms. Excel PivotTable
Ms. Excel WorkSheet
DashBoard report
Files
Used to return flat files, this report can return many files at once.
The file browser interface is presented here.
© psgsdk.com
12
13
NET Reports 3.0
By pressing the "Save" button on left top of the page a new form is opened.
© psgsdk.com
User manual
14
This comes with options to save the file to different formats, print or export to CrossTab/ Pivot Table.
2.4.2
Print Report
This is a paper based report type. By installing a PDF printer driver like http://www.bullzip.com/ you
can create PDF files by printing to the PDF driver.
and
Print Preview
© psgsdk.com
15
2.4.3
NET Reports 3.0
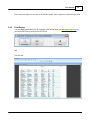
CrossTab Report
CrossTab report is 3 dimension cube report. It is a light option for data analysis.
Reports can be filtered on "Page filter", can be printed, or exported to different file types.
The report data can be reorganized at run time depending on available option (CrossTab button)
© psgsdk.com
User manual
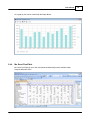
Or a graph by line can be created with the Graph Button.
2.4.4
Ms. Excel PivotTable
Ms. Excel PivotTable is one of the most advanced data analysis tools available today.
Requires Microsoft Office.
© psgsdk.com
16
17
NET Reports 3.0
The PivotTable is created by automating Ms. Office.
Depending on Office release different option's are available, the last is the best.
2.4.5
Ms. Excel WorkSheet
One list is exported to an Excel sheet
2.4.6
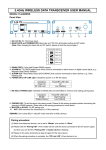
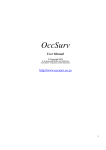
DashBoard report
Top management report type, it can show data from multiple data sources using tables,graphs and
text fields.
(18 graph types are available here)
© psgsdk.com
User manual
Sample from Ms.SQL Northwind database (1996-1997 data)
© psgsdk.com
18
Administrator
manual
Part
III
Administrator manual
3
Administrator manual
The management of the system requires the NET Reports "administrator" password.
Available options are:
- user management
- reports management
- user access rights
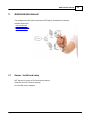
3.1
Server - Install and setup
NET Reports 3.0 relays on PSG client/server platform.
Install first the PSG 2.0 server manager
Run the PSG servers manager.
© psgsdk.com
20
21
NET Reports 3.0
Press Install to install a new PSG server.
Chose the install package (zip file) for NET Reports server and press Install.
© psgsdk.com
Administrator manual
22
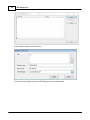
Press "Config" to open the new installed server configuration program.
3.2
Config
Server configuration utility. It runs only on server computer, started from PSG server manager
application.
Several PSG server's can be installed on the same server computer.
Here we have the basic options used to configure the "NET Reports" server as many others are
already pre configured, for more help option please study the PSG server configuration help that
covers all options.
There are two operations to perform here:
- Windows Service setup
- Server certificate setup
Windows Service setup
© psgsdk.com
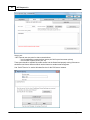
23
NET Reports 3.0
Server port:
- NET Reports uses two ports for data communications
- one for application communications (server port field in previous screen picture)
- one for HELP system (server port -10)
Those ports should be available by enable access into the firewall and properly routing if the server
should be used from a different network as the Internet or another Intranet segment.
Use "Set NT Service" to set the Windows Service for the PSG server instance.
© psgsdk.com
Administrator manual
24
The PSG server opens two ports to offer his services as application server. Traffic on ports will be
HTTPS and HTTP.
Most firewalls need to be configured to allow PSG to run as a server.
Press "Run Server" - on Windows XP, Vista and 7 the Microsoft Firewall will ask if the application
should be blocked or not.
Allow the PSG server to run here.
Do the same with any other firewall or security software that may run on the computer, please refer
to the firewall help for more details.
Set the service name here and press "Install service" button.
Press "Generate INI file and INSTALL the service" button.
Next the server can be started from this interface or from operating system service manager.
Server certificate setup
The PSG server uses HTTPS for data communication. The used encryption is SSL3 and uses public/
private key cryptography.
In order to implement this a certificate should be used. While any certified certificate by a third party
like Verisign and others could be used, also a non certified certificate could be used here. The
security level is the same.
A certified certificate is generally used when the server should be verified by the client that is the real
one like on-line shops. Here the certificate is used first to add good encryption to the system.
A default certificate is set by default. It will be enough for Intranet or local networks. To set a new
certificate use "Set certificate" under "Server" tab.
Chose a certificate and set the password if the certificate is protected by a password.
Found on "Utils" page, a certificate utility is available and can be used to create a "self-signed"
certificate that can be used to secure the PSG server.
© psgsdk.com
25
NET Reports 3.0
Use "Certificate" to create a new certificate and go back to the server page to set it as default.
© psgsdk.com
Administrator manual
26
Fill all fields and press "Generate" button.
A bigger Bit Count will provide a better encryption but also will need more power. Generally 512 is
enough, but 2048 can be used as well.
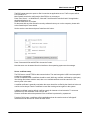
3.3
Users management
Available only for administrator in the client interface under "Admin" menu as "Users Management".
First set the users accounts. Administrator account can not be removed.
© psgsdk.com
27
NET Reports 3.0
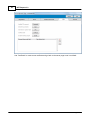
Next set the users groups, add users per groups and add rights to users groups.
The "Reports" document should be added to the user group access rights.
This will allow users to access the reports user interface.
© psgsdk.com
Administrator manual
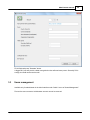
3.4
Reports management
This module is used to manage the installed reports (found using the client interface as
"administrator" under "Reports" menu).
© psgsdk.com
28
29
NET Reports 3.0
Tree view explorer:
Right click on a node for a short menu. One report can be copied with copy/paste from the short
menu.
Double click on one report to edit. Use right text box to write report description.
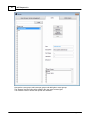
Database connections are needed in order to use reports.
The "Connections" button opens the database connections window.
Create the connection string that should work with the database on your server. An ODBC
connection string is required.
Press "Test connection" to verify the connection string.
Press "Create XML" to create a metadata XML file of the database to be used later by the reports
designer graphic interface.
© psgsdk.com
Administrator manual
Connections string samples for different database servers can be found at http://www.
connectionstrings.com
Check for ODBC connection.
3.4.1
Edit report
Reports editor, each report should have at least one SQL query and an output.
NET reports allows reports from more databases at a time and users interfaces.
© psgsdk.com
30
31
NET Reports 3.0
- Report description
- Variables Interface
- SQL Procedures
- Output
Report description page:
- used to add a description to the report that's useful for the end user
© psgsdk.com
Administrator manual
3.4.1.1
32
Variables interface
A visual form editor can be used to define variables that can be filled at runtime.
- Textbox
- Combobox
- Listbox
- Checkbox
- Label
Drag and drop the object on grid shape, a parameters list will be visible on the right side of the page.
Textbox
© psgsdk.com
33
NET Reports 3.0
Set the variable name and type.
ComboBox
Set the database, table and fields to be used.
The last field in the list will be used as the value of the control.
Widths - set the width of each field into the combobox (0 - to hide the key value).
© psgsdk.com
Administrator manual
ListBox
Same as the "combobox" control, the difference is that first field gives the value of the control.
Both, comobox and listbox, do not work well with integer keys, avoid using integer fields as key.
All variables declared with textbox,comobox and listbox can be used later in SQL queries.
Label
© psgsdk.com
34
35
NET Reports 3.0
Set the label caption.
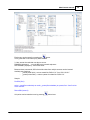
3.4.1.2
SQL procedures
Here the SQL queries can be set. This part requires SQL language knowledge.
1. The used databases (access the databases structures)
- here we see only one - Northwind, but a lot of databases can be used if we have proper
connections between them.
- Ex: Sales database and HR database data will require
at least a table codes of employees from
both databases if we want to integrate
data from both databases to the same report
- data and structure can be seen
- this control can be hidden using the vertical shape on right of the control.
2. SQL Queries
- each query should have a name.
- there can be as many as needed
- the query can be written by hand (right text edit or text editor
can be used
) or a visual query editor
.
© psgsdk.com
Administrator manual
Each query can be tested by pressing the
button.
It is a good idea to test each query when created.
3. Here we set the code that runs last on server.
RUNSQL(<sqlname>) - runs the SQL query named <sqlname>
RETURNSQL(<sqlnqme>) - return SQL result.
Between those commands, SQL's that collect data from multiple sources can be inserted.
Available new functions:
- _month(<date field>) - returns month like "M2011.01" from "2011-01-01"
- _quarter(<date field>) - returns quarter from date like "Q2011-01'
Sample:
RunSQL('first')
select _month(first.orderdate) as month,_quarter(first.orderdate) as quarter,first.* from first into
cursor second
ReturnSQL('second')
All queries can be tested at once by pressing
© psgsdk.com
button here.
36
37
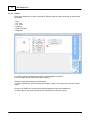
3.4.1.3
NET Reports 3.0
Output
Each report should have a report output layout. Different types of results can be set as output layout
as required.
- Files
- List - Print
- List - Excel
- CrossTab
- Excel PivotTable
- Dashboard
To create or modify a template layout first the records dataset is required.
Press "Get data" button to have the queries results (1).
Chose the report type and press "Create report".
If a report is already set, press "Remove report layout", chose a new output type and press "Create
report"
Files is set by default, the queries results will be presented as lists into a tabbed form.
All others options uses easy wizards and visual interfaces to create the layouts.
© psgsdk.com
Administrator manual
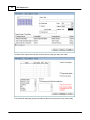
3.4.1.3.1 List - Print
Have the data cursors from the server, chose "Print report" and then "Create report".
Select all needed fields to the list in the right part of the form and press "Next".
© psgsdk.com
38
39
NET Reports 3.0
Set here some reports items as title, columns names, page type and press "Next".
The wizard can add page groups and totals, set them here and press "Finish" when ready.
© psgsdk.com
Administrator manual
The reports is created and opened into the report editor.
Each field could be set as wanted.
© psgsdk.com
40
41
NET Reports 3.0
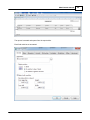
3.4.1.3.2 List - Excel
After you have the data cursors available, select the "MS. Excel workbook" option and press "Create
report".
Select the fields and press "Next".
Set the Excel page and column headers here.
© psgsdk.com
Administrator manual
Press "Finish".
3.4.1.3.3 CrossTab
Have the data cursors from the server, chose "CrossTab" and press "Create report" button.
© psgsdk.com
42
43
NET Reports 3.0
Drag and drop fields to corresponding containers in the right (Page filter, Row, Column, Data).
Press "Save" when ready.
See "CrossTab report" for the report result.
3.4.1.3.4 Excel PivotTable
Have the data cursors from the server, chose "Excel PivotTable" and press "Create report" button.
Drag and drop fields to corresponding containers in the right (Page filter, Row, Column, Data).
Press "Save" when ready.
See "Ms. Excel PivotTable" for the report result.
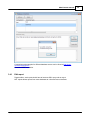
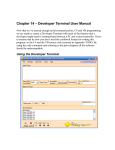
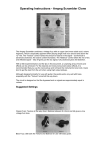
3.4.1.3.5 Dashboard
A visual editor for the Dashboard report.
This reports uses more than one data cursor if necessary.
This sample is a report that present sales and some lists.
- list of products and stock - products
- sales in a period - second
- list of employees - employees
© psgsdk.com
Administrator manual
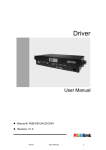
Press "Create report" to open the report editor.
- place objects on the page
- move and change size using the mouse
- right click to set the object properties or delete the object.
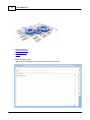
Graph object:
© psgsdk.com
44
45
NET Reports 3.0
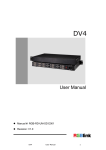
Select the data source, datafield, X Ax field and graph field.
For Pie reports type (pie and doughnut) the "Graph field" is not necessary.
3D Level - 0 for plain graph.
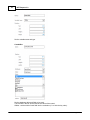
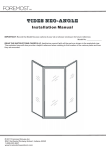
Grid list object:
Set the grid parameters, for each column and header you may set properties as font name and size.
© psgsdk.com
Administrator manual
46
The object will be resized vertically at run time to show all items in the list. All objects in the page
bellow the grid will be moved down accordingly.
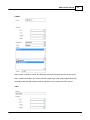
3.5
Users access rights
Found on client interface under "Reports" menu.
This can be used to set access to reports for users or users groups.
© psgsdk.com