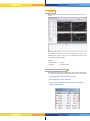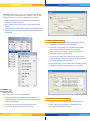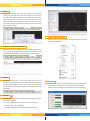
1
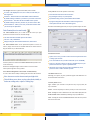
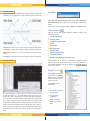
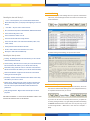
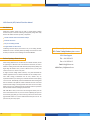
Table of
Contents
Introduction
Opening A Demo Account
Overview
Market Watch (Quotes Window)
Charts
Navigator
(Folder File)
Trade Terminal
(Your Account Details)
New Order
Execution
News Service
Account History
Alerts
Mailbox
Login Status Options
Changing Your Password
Sound Alert Control
Easy Reference Guide
PFD Limited Client User Manual
Introduction
PFD software allows users to trade in various markets utilizing
technical analysis in real-time. Offering an integrated package with many
features the software has several primary components:
Flexible real-time charts and technical analysis
Real-time news feed
Easy to use trading terminal
Integrated built-in web browser
Combining technical analysis, news and an easy to use trading terminal,
PFD Trader serves as an ideal platform providing users with all the tools
necessary for full-scale on-line trading in the Financial Markets.
Preface: Opening a Demo Account
For more help and assistance with
WSD Direct Trading Platform please contact:
WSD Client Support
Tel: + 64 9 632 0111
When starting PFD Trader for the first time, the software assumes you will
be registering for a Demo Account. You will need to do this first, in order to
establish a trading account with PFD Limited, (PFD), and
begin using the software. Once you have a Demo account, you may then
convert it into a "Live" version at any time.
Fax: + 64 9 632 0115
Email: [email protected]
MSN Chat: [email protected]
To begin real-time trading without monetary risk, please download the
software application from our website and follow the user friendly instructions. PFD strongly recommends that all users, whether they are
experienced traders or just starting out, trade with the demo before opening
a "Live" account. This will help you become familiar with all the trading tools
that are available on the platform as well as demonstrate some of the risks
associated with trading on a leveraged basis. The demo account is virtually
identical to the "Live" trading experience and allows traders to experiment
with the software without incurring any financial risk.
N.B. PFD Trader offers you the choice of receiving live market prices for
Forex and Financial Futures or just Forex. When completing the Open an
Account front page please go to the Account Type box at the bottom of the
page and select either “FT” for Forex and Financial Futures prices or “FX” for
just the Forex prices only option.
02
15
Overview
B elow is the PFD Trader program window as it will appear the first time it is
started.
The windows are anchored to each other by default only and can be
maneuvered in a variety of ways so as to be positioned anywhere on the
screen giving complete flexibility.
INDEX
1. Market Watch
3. Navigator
2. Charts
4. Trader Terminal
Market Watch (Quotes Window)
The Market Watch window is a floating palette. You are able to click and drag
it any where on the screen (even over other windows). It can be opened by:
The "Market Watch" option from the "View" menu
By pressing the Ctrl + M key combination.
Once open you can also show or hide the window by clicking the
toolbar icon shown below:
03
Market Watch shows current live prices of all traded securities and allows
you to make a quick and informed decision. To initiate a trade you must
open an Order Form, to do this from the Market Watch section simply:
Double-click the selected security and the Order Form will appear
allowing you to initiate a position or;
Right –click the selected security and the context menu will appear
as shown.
You are also able to initiate a trade through the Trade Terminal. A more
detailed explanation of this can be found in the Trade Terminal section
of the manual.
Server Tab - Server options:
Login & Password - the account number and password can be saved
automatically to enable easier access to the platform.
Server & Port - the production server IP address and port number
(these are set up automatically and should not be changed).
Check for a new version at startup – should be ticked at all times
Enable DDE – should be ticked at all times.
Open an Account – allows you to register for a new demo account.
Change the password - allows you to change the computer generated
password for something easier to remember.
Keep personal settings – when ticked then all account history, notepad
and mailbox content are saved automatically to your computer.
Charts
Opening the charts:
There are several ways to open a new Chart Window;
Select your chosen security from the Market Watch window and
right-click the mouse, then click the Chart Window command in the
context menu that appears.
04
Events tab - Audio notification settings:
Play Events – This switch turns the audio notification on and off.
Click on the “New” chart icon in the toolbar as shown above.
Select – Allows you to select the type of sound for each alert.
Click on “File - New Chart” from the top of the screen.
Play - Plays each audio alert notification.
13
Alerts
The Alerts function keeps track of your chosen security for you and sounds
a warning that your target rate has been reached. Simply click on the Alerts
tab in the Trader Terminal and right-click the mouse. This will bring up a
context menu that offers the option to Create a New Alert. Click on this
option and the Alert Editor will appear as shown. Then choose the security
and rate that you wish to be notified of and WSD Direct will sound a warning
when the target is reached.
Adding to chart information
Place the cursor over your selected chart and right-click the mouse; this will
bring up the context menu:
WSD Direct Internal Mail (Mailbox)
Internal mail is used by our managers and traders to ensure message delivery
to you, as a fail safe as regular e-mail is not always as reliable. This can be
activated through the Mailbox tab on the bottom of the Trade Terminal.
Journal
The Journal function keeps a record of every single action that occurs
through your account. Should you wish to double check a price quoted or a
previous trade for example then click on the Journal tab in the Trader
terminal and scroll to the relevant date and the recorded information details
will be shown.
Properties
To adjust the chart (colour scheme and display) simply open the Properties
window using the F8 button. Choose your selected look and click OK.
The selected chart will change to the required colour scheme immediately.
Options
The options window is used to open new accounts, change passwords and
alert sounds etc. To open:
Go to Tools -> Options menu on the toolbar at the top of the screen
Or use the Ctrl + O key combination
Or simply clicking the Options toolbar button as shown above.
12
05
News Service
Controlling the charts with "hot keys":
‘<-‘and ‘->‘cursor keys allow you to scroll backwards and forwards.
This window displays news headings with their respective announcement
times. Easily activated through the News tab located on the bottom of the
Trade Terminal box.
Home and End keys allow you to jump to the beginning or end in one
motion.
‘-’ and ‘shift’ ‘+’ keys are used to zoom in and out.
‘Alt+1’, ‘Alt+2’ & ‘Alt+3’ keys switch to and from the bar, candlestick or line charts.
Ctrl+G switches the grid on or off.
Ctrl+V switches the volume on or off.
Ctrl+I activates the indicators settings window.
Ctrl+S saves the chart in a file of the selected format (*.HST, *.CSV,
*.PRN, *.HTM).
Ctrl+P prints the chart in the black and white.
“Delete” deletes all the selected studies in one motion.
“Backspace” deletes the last added study.
By double-clicking a news heading, you open the news content:
Controlling the charts by mouse:
Scrolling - By holding down the left mouse button, you can scroll the
chart backwards and forwards.
Vertical Scaling - When the cursor is on the price scale, hold down the
left mouse button. This enables you to scale the chart vertically.
Horizontal Scaling - When the cursor is on the time scale, hold down
the left mouse button. This enables you to scale the chart horizontally.
Chart Control Window - Right-click the chart and a context menu
showing all controls will appear.
Edit Study – Double-click the left button mouse button on the study
which allows you to move or edit it.
Parallel Trend – Having selected a specific trend line, hold down the
left mouse button whilst simultaneously pressing the Ctrl key and
move the cursor away from the trendline which will then show a
parallel line.
Study Settings Window - Right click the selected object to edit its
properties.
Account History
The window is activated through clicking the Account History Tab on the
bottom of the Trade Terminal enabling you to view a comprehensive history
of completed transactions from your account.
FOR YOUR CONVENIENCE - A “HOT KEYS EASY REFERENCE” GUIDE IS ALSO
AVAILABLE ON THE BACK PAGE OF THIS MANUAL.
If you don’t see the most recent closed position in the list, just update the
records by pressing the F5 key or by right-clicking the window and selecting
the Refresh command from the context menu. You can print a copy of your
records through the File - > Print menu or save them into a file (File - >
Save).
06
11
Pending Orders
The principles of placing pending Orders are shown below. A more detailed
explanation can also be found in the Types of Orders section of our web site.
Line studies
Cross Hair, Vertical Line, Horizontal Line, Trend Line and Fibonacci
Retracement studies can be added to the chart through the Line Studies
toolbar:
The toolbar is activated through the View - Toolbars - Line Studies menu.
Technical Indicators
There are also 29 other technical indicators available to analyze chart
movements, such as:
A Buy Limit is an order to buy a security at a lower price than is currently on offer.
A Sell Limit is an order to sell a security at a higher price than is currently bid.
A Buy Stop is an order to buy a security at a higher price than is currently
on offer.
A Sell Stop is an order to sell a security at a lower price than is currently bid.
Close the Position
Average True Range
Bollinger Bands
Commodity Channel Index
MACD
Momentum
Moving Average
Parabolic SAR
Relative Strength Index
Stochastic Oscillator
Williams’ Percent Range, plus many more
These indicators can be added to a selected chart through the Insert
Indicators icon on the toolbar, shown above, or Ctrl+I key combination. A
more detailed explanation can also be found in the Technical Indicator
section of our website.
Navigator (Folder File)
The Navigator is designed to
work similarly to the Market
Watch. It provides quick and
convenient access to various
program resources.
The Navigator can be
activated by:
The Navigator option in
the View menu.
To open this window, go to the Trade Terminal. Place the cursor on the
desired open position and double-click the left mouse button. Request a
quote and when received the box directly under this will state “close # xxxxx
buy or sell xx lots @ xxx (price)”. Click this button once and your open
position will be automatically closed at the relevant price. All profit or loss is
instantly calculated and reflected in the Trade Terminal box. In order to
partially close an open position, first choose an appropriate number of lots
in the drop-down menu titled “lots” and then execute the same process as
above
10
The Ctrl + N key
combination.
Simply clicking the
toolbar icon, as shown
above.
07
The Navigator function is organized into folders, which include:
Accounts – This displays the active, live or demo, accounts that you
have registered.
A new position can then be opened in several ways:
From the Order Form item in the Tools menu
Indicators – This shows the list of 29 available technical indicators.
By double-clicking an indicator, you add it to your chosen active chart.
By pressing the "F9" key on your keyboard
Expert Advisors – This shows the list of available advice systems.
By double-clicking an advisor, you add it to your chosen active chart.
By right-clicking the Trade Terminal box and choosing the New
Order option from the context menu that appears
Custom indicators – Allows you to store your favorite indicators with
your chosen pre-set parameters.
By double-clicking a security in the Market Watch window
The Order Form window appears and you can open a position or place an order:
Trade Terminal (Your Account Details)
The Trade Terminal allows you to make trades and control your open
positions in real-time. This can be activated through
The View menu then Terminal option on the toolbar.
The Ctrl + T key combination.
Simply clicking the Trade Terminal toolbar icon, shown above.
The Trade Terminal window can be positioned anywhere on screen. To
move it, simply click the title bar and hold down the left mouse button to
drag the window to your desired location.
New Order Execution:
Symbol - the security you wish to trade. Click the drop-down box menu
to change your selection.
Lots - the number of lots you wish to trade with. (1 Lot = US$100k)
All active positions are listed in the Trade Terminal window (shown in the
screen shot above).
Stop Loss - the level at which you choose to automatically close your
position to limit losses or protect a profitable trade.
Positions are managed through a context menu. To view the context
menu’s options right-click on any position.
Take Profit - the level at which you wish to automatically close a
position in order to realize and lock-in profits.
Active Position Management Context Menu - A Brief Summary:
To create a new order or modify an existing order from the Trader Terminal:
Place the cursor over the chosen security and right-click.
This will allow you to choose to place a New Order, Modify or
Delete an existing order, or place a Trailing Stop.
The Market Order section
Following your request, the price quoted will appear from WSD Direct on
the left hand side of the section.
New Entry Order Section
Type – Whether your new order to be placed is a buy stop, buy limit, sell
stop or sell limit.
At Price – Enter the required price at which you wish your order to be executed.
Send – Sending the order to WSD Direct. The order will be displayed in the
Trade Terminal window immediately following receipt by WSD Direct.
Close – Pressing this closes the Order Form window and cancels any orders
that have not been sent.
08
09
The Navigator function is organized into folders, which include:
Accounts – This displays the active, live or demo, accounts that you
have registered.
A new position can then be opened in several ways:
From the Order Form item in the Tools menu
Indicators – This shows the list of 29 available technical indicators.
By double-clicking an indicator, you add it to your chosen active chart.
By pressing the "F9" key on your keyboard
Expert Advisors – This shows the list of available advice systems.
By double-clicking an advisor, you add it to your chosen active chart.
By right-clicking the Trade Terminal box and choosing the New
Order option from the context menu that appears
Custom indicators – Allows you to store your favorite indicators with
your chosen pre-set parameters.
By double-clicking a security in the Market Watch window
The Order Form window appears and you can open a position or place an order:
Trade Terminal (Your Account Details)
The Trade Terminal allows you to make trades and control your open
positions in real-time. This can be activated through
The View menu then Terminal option on the toolbar.
The Ctrl + T key combination.
Simply clicking the Trade Terminal toolbar icon, shown above.
The Trade Terminal window can be positioned anywhere on screen. To
move it, simply click the title bar and hold down the left mouse button to
drag the window to your desired location.
New Order Execution:
Symbol - the security you wish to trade. Click the drop-down box menu
to change your selection.
Lots - the number of lots you wish to trade with. (1 Lot = US$100k)
All active positions are listed in the Trade Terminal window (shown in the
screen shot above).
Stop Loss - the level at which you choose to automatically close your
position to limit losses or protect a profitable trade.
Positions are managed through a context menu. To view the context
menu’s options right-click on any position.
Take Profit - the level at which you wish to automatically close a
position in order to realize and lock-in profits.
Active Position Management Context Menu - A Brief Summary:
To create a new order or modify an existing order from the Trader Terminal:
Place the cursor over the chosen security and right-click.
This will allow you to choose to place a New Order, Modify or
Delete an existing order, or place a Trailing Stop.
The Market Order section
Following your request, the price quoted will appear from PFD Trader on
the left hand side of the section.
New Entry Order Section
Type – Whether your new order to be placed is a buy stop, buy limit, sell
stop or sell limit.
At Price – Enter the required price at which you wish your order to be executed.
Send – Sending the order to PFD Trader. The order will be displayed in the
Trade Terminal window immediately following receipt by PFD Trader.
Close – Pressing this closes the Order Form window and cancels any orders
that have not been sent.
08
09
Pending Orders
The principles of placing pending Orders are shown below. A more detailed
explanation can also be found in the Types of Orders section of our web site.
Line studies
Cross Hair, Vertical Line, Horizontal Line, Trend Line and Fibonacci
Retracement studies can be added to the chart through the Line Studies
toolbar:
The toolbar is activated through the View - Toolbars - Line Studies menu.
Technical Indicators
There are also 29 other technical indicators available to analyze chart
movements, such as:
A Buy Limit is an order to buy a security at a lower price than is currently on offer.
A Sell Limit is an order to sell a security at a higher price than is currently bid.
A Buy Stop is an order to buy a security at a higher price than is currently
on offer.
A Sell Stop is an order to sell a security at a lower price than is currently bid.
Close the Position
Average True Range
Bollinger Bands
Commodity Channel Index
MACD
Momentum
Moving Average
Parabolic SAR
Relative Strength Index
Stochastic Oscillator
Williams’ Percent Range, plus many more
These indicators can be added to a selected chart through the Insert
Indicators icon on the toolbar, shown above, or Ctrl+I key combination. A
more detailed explanation can also be found in the Technical Indicator
section of our website.
Navigator (Folder File)
The Navigator is designed to
work similarly to the Market
Watch. It provides quick and
convenient access to various
program resources.
The Navigator can be
activated by:
The Navigator option in
the View menu.
To open this window, go to the Trade Terminal. Place the cursor on the
desired open position and double-click the left mouse button. Request a
quote and when received the box directly under this will state “close # xxxxx
buy or sell xx lots @ xxx (price)”. Click this button once and your open
position will be automatically closed at the relevant price. All profit or loss is
instantly calculated and reflected in the Trade Terminal box. In order to
partially close an open position, first choose an appropriate number of lots
in the drop-down menu titled “lots” and then execute the same process as
above
10
The Ctrl + N key
combination.
Simply clicking the
toolbar icon, as shown
above.
07
News Service
Controlling the charts with "hot keys":
‘<-‘and ‘->‘cursor keys allow you to scroll backwards and forwards.
This window displays news headings with their respective announcement
times. Easily activated through the News tab located on the bottom of the
Trade Terminal box.
Home and End keys allow you to jump to the beginning or end in one
motion.
‘-’ and ‘shift’ ‘+’ keys are used to zoom in and out.
‘Alt+1’, ‘Alt+2’ & ‘Alt+3’ keys switch to and from the bar, candlestick or line charts.
Ctrl+G switches the grid on or off.
Ctrl+V switches the volume on or off.
Ctrl+I activates the indicators settings window.
Ctrl+S saves the chart in a file of the selected format (*.HST, *.CSV,
*.PRN, *.HTM).
Ctrl+P prints the chart in the black and white.
“Delete” deletes all the selected studies in one motion.
“Backspace” deletes the last added study.
By double-clicking a news heading, you open the news content:
Controlling the charts by mouse:
Scrolling - By holding down the left mouse button, you can scroll the
chart backwards and forwards.
Vertical Scaling - When the cursor is on the price scale, hold down the
left mouse button. This enables you to scale the chart vertically.
Horizontal Scaling - When the cursor is on the time scale, hold down
the left mouse button. This enables you to scale the chart horizontally.
Chart Control Window - Right-click the chart and a context menu
showing all controls will appear.
Edit Study – Double-click the left button mouse button on the study
which allows you to move or edit it.
Parallel Trend – Having selected a specific trend line, hold down the
left mouse button whilst simultaneously pressing the Ctrl key and
move the cursor away from the trendline which will then show a
parallel line.
Study Settings Window - Right click the selected object to edit its
properties.
Account History
The window is activated through clicking the Account History Tab on the
bottom of the Trade Terminal enabling you to view a comprehensive history
of completed transactions from your account.
FOR YOUR CONVENIENCE - A “HOT KEYS EASY REFERENCE” GUIDE IS ALSO
AVAILABLE ON THE BACK PAGE OF THIS MANUAL.
If you don’t see the most recent closed position in the list, just update the
records by pressing the F5 key or by right-clicking the window and selecting
the Refresh command from the context menu. You can print a copy of your
records through the File - > Print menu or save them into a file (File - >
Save).
06
11
Alerts
The Alerts function keeps track of your chosen security for you and sounds
a warning that your target rate has been reached. Simply click on the Alerts
tab in the Trader Terminal and right-click the mouse. This will bring up a
context menu that offers the option to Create a New Alert. Click on this
option and the Alert Editor will appear as shown. Then choose the security
and rate that you wish to be notified of and PFD Trader will sound a warning
when the target is reached.
Adding to chart information
Place the cursor over your selected chart and right-click the mouse; this will
bring up the context menu:
PFD Trader Internal Mail (Mailbox)
Internal mail is used by our managers and traders to ensure message delivery
to you, as a fail safe as regular e-mail is not always as reliable. This can be
activated through the Mailbox tab on the bottom of the Trade Terminal.
Journal
The Journal function keeps a record of every single action that occurs
through your account. Should you wish to double check a price quoted or a
previous trade for example then click on the Journal tab in the Trader
terminal and scroll to the relevant date and the recorded information details
will be shown.
Properties
To adjust the chart (colour scheme and display) simply open the Properties
window using the F8 button. Choose your selected look and click OK.
The selected chart will change to the required colour scheme immediately.
Options
The options window is used to open new accounts, change passwords and
alert sounds etc. To open:
Go to Tools -> Options menu on the toolbar at the top of the screen
Or use the Ctrl + O key combination
Or simply clicking the Options toolbar button as shown above.
12
05
Market Watch shows current live prices of all traded securities and allows
you to make a quick and informed decision. To initiate a trade you must
open an Order Form, to do this from the Market Watch section simply:
Double-click the selected security and the Order Form will appear
allowing you to initiate a position or;
Right –click the selected security and the context menu will appear
as shown.
You are also able to initiate a trade through the Trade Terminal. A more
detailed explanation of this can be found in the Trade Terminal section
of the manual.
Server Tab - Server options:
Login & Password - the account number and password can be saved
automatically to enable easier access to the platform.
Server & Port - the production server IP address and port number
(these are set up automatically and should not be changed).
Check for a new version at startup – should be ticked at all times
Enable DDE – should be ticked at all times.
Open an Account – allows you to register for a new demo account.
Change the password - allows you to change the computer generated
password for something easier to remember.
Keep personal settings – when ticked then all account history, notepad
and mailbox content are saved automatically to your computer.
Charts
Opening the charts:
There are several ways to open a new Chart Window;
Select your chosen security from the Market Watch window and
right-click the mouse, then click the Chart Window command in the
context menu that appears.
04
Events tab - Audio notification settings:
Play Events – This switch turns the audio notification on and off.
Click on the “New” chart icon in the toolbar as shown above.
Select – Allows you to select the type of sound for each alert.
Click on “File - New Chart” from the top of the screen.
Play - Plays each audio alert notification.
13
WSD Financial (NZ) Limited Client User Manual
Introduction
WSD Direct software allows users to trade in various markets utilizing
technical analysis in real-time. Offering an integrated package with many
features the software has several primary components:
Flexible real-time charts and technical analysis
Real-time news feed
Easy to use trading terminal
Integrated built-in web browser
Combining technical analysis, news and an easy to use trading terminal,
WSD Direct serves as an ideal platform providing users with all the tools
necessary for full-scale on-line trading in the Financial Markets.
For more help and assistance with
PFD Trader Trading Platform please contact:
PFD Client Support
Preface: Opening a Demo Account
When starting WSD Direct for the first time, the software assumes you will
be registering for a Demo Account. You will need to do this first, in order to
establish a trading account with WSD Financial (NZ) Limited, (WSD), and
begin using the software. Once you have a Demo account, you may then
convert it into a "Live" version at any time.
Tel: + 64 9 632 0132
Fax: + 64 9 632 0115
Email: [email protected]
MSN Chat: [email protected]
To begin real-time trading without monetary risk, please download the
software application from our website and follow the user friendly instructions. WSD strongly recommends that all users, whether they are
experienced traders or just starting out, trade with the demo before opening
a "Live" account. This will help you become familiar with all the trading tools
that are available on the platform as well as demonstrate some of the risks
associated with trading on a leveraged basis. The demo account is virtually
identical to the "Live" trading experience and allows traders to experiment
with the software without incurring any financial risk.
N.B. WSD Direct offers you the choice of receiving live market prices for
Forex and Financial Futures or just Forex. When completing the Open an
Account front page please go to the Account Type box at the bottom of the
page and select either “FT” for Forex and Financial Futures prices or “FX” for
just the Forex prices only option.
02
15