1
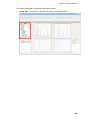
Chapter 5. Viewing the Data
•
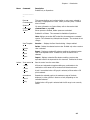
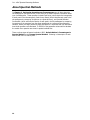
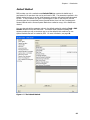
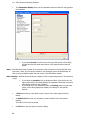
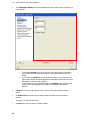
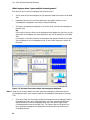
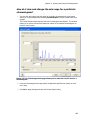
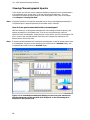
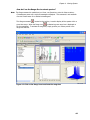
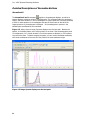
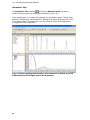
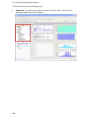
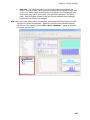
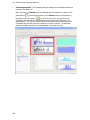
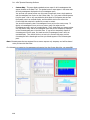
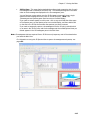
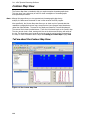
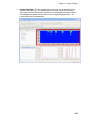
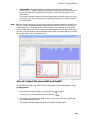
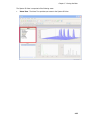
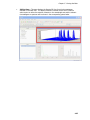
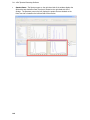
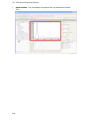
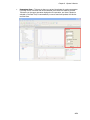
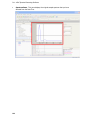
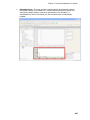
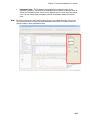
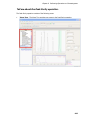
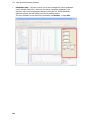
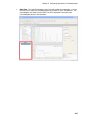
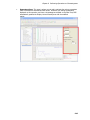
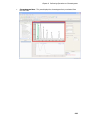
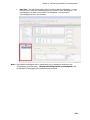
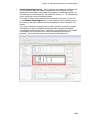
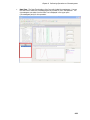
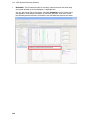
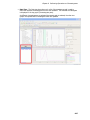
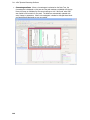
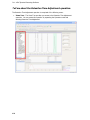
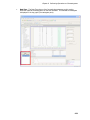
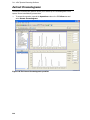
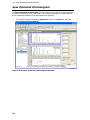
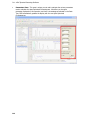
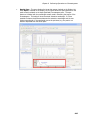
Contour Map Pane - This pane displays the contour map of a chromatogram that is
selected on the Data Tree. The display includes a crosshair cursor which is used to
select a point on either the retention time axis or the wavelength axis and the relevant
chromatogram and spectrum will be shown in the corresponding panes below. The
contour levels show the absorbances.
125