1
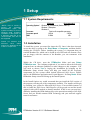
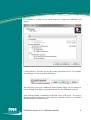
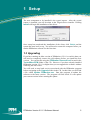
www.ppm-technology.com
Tel: +44 (0)1286 676 999
Fax: +44 (0)1286 671 811
www.ppm-technology.com
+44 (0)1286 676 999
+44 (0)1286 671 811
PPMonitor
Version 2.2.1.3
Software Manual
PPM Technology Ltd
Units 34-35 ᵒ Cibyn Industrial Estate
Caernarfon ᵒ LL55 2BD ᵒ Wales, UK
www.ppm-technology.com
[email protected]
Tel: +44 (0)1286 676 999
Fax: +44 (0)1286 671 811
PPMonitor Version 2.2.1.3 Software Manual
1
Contents
This user manual should be
used in conjunction with the
Wireless
IAQ
Profile
Monitor User Manual.
This user manual applies to
the PPMonitor software
version 2.2.1.3. If you are
unsure which version of the
software you are running,
click About on the menu bar
or select Help > About
PPMonitor and the version
number will be listed here.
Contents...............................................................................................................2
1 Setup.................................................................................................................3
1.1 System Requirements...............................................................................3
1.2 Installation................................................................................................3
1.3 Upgrading.................................................................................................5
2 Startup...............................................................................................................6
2.1 Before first run..........................................................................................6
2.2 Starting the software for the first time......................................................7
3 Monitoring......................................................................................................10
3.1 Graph overview.......................................................................................11
3.2 Detailed graph view................................................................................14
3.3 Importing data from a Touch Screen Unit..............................................15
4 Alarms.............................................................................................................17
5 Schedules........................................................................................................18
5 Shedules..........................................................................................................19
6 Unit Setup.......................................................................................................21
7 Reports............................................................................................................23
8 Admin.............................................................................................................25
8.1 Company Info.........................................................................................25
8.2 Preset Times............................................................................................25
8.3 Unit Groups............................................................................................26
8.4 System Information................................................................................27
8.5 Colour.....................................................................................................28
8.6 Alarm Labels...........................................................................................28
8.7 Locations.................................................................................................29
8.8 Messages.................................................................................................29
8.9 Paging.....................................................................................................29
8.10 Email.....................................................................................................30
9 Addresses........................................................................................................31
10 Session..........................................................................................................32
11 Troubleshooting............................................................................................33
PPMonitor Version 2.2.1.3 Software Manual
2
1 Setup
1.1 System Requirements
*NOTE: Due to issues in
gaining
the
necessary
administrative rights, this
system is unlikely to work on
Windows Vista. Therefore,
installation of this system on
a Windows Vista PC is not
recommended and will not
be supported.
Please be advised that
Microsoft
have
ended
support for Windows XP as
of the 8th of April 2014.
Operating System*
Processor
Processor speed
RAM
Minimum
Recommended
Windows XP Professional (Service Pack 3)
Windows 7 Enterprise
Windows 8
Pentium III compatible processor
1.0GHz
2.0GHz
512Mb
1Gb
1.2 Installation
To install the system, you must first insert the CD. Once it has been inserted,
access the drive by going to the Start Menu > Computer, and then doubleclicking the CD drive. Before installing the system, it is important that you
read the Readme file, which can be found in text, PDF and web formats. Once
you are happy with the contents of the Readme, you can commence with
installation.
Within the CD drive, open the PPMonitor folder and start Setup
PPMonitor.exe. The computer might ask if you want to allow the following
program from an unknown publisher to make changes to this computer. You
will need to choose Yes to beging the installation by bringing up the
PPMonitor Setup wizard. Setup will help you install all the necessary
components for the system which include Microsoft SQL Server, ZigBee
drivers, the PPMonitor application and Crystal Reports. Pressing Next> on the
PPMonitor Setup wizard will bring up the Install Optons.
In the Install Options we would recomend that you install the Full version of
the program, selecting all of the components available. The installer will begin
by scanning your system for Microsoft SQL Server. If an available instance of
this is found, the SQL Server 2008 Express will be grayed out and the install
option for this will be marked as already installed. If this is case you may have
difficulty installing the PPM database due to the permission settings of the SQL
Server and you should conntact PPM Technoogy and your network support
team for assistance.
PPMonitor Version 2.2.1.3 Software Manual
3
If no instances of SQL Server 2008 Express is found, the following will
appear:
up
Clicking Next > will take you to the license agreement screen. To continue,
you must agree to the terms and click Next >.
This will bring you to the Additional Tasks window where you can choose to
have a desktop item and/or a quick launch item for the PPMonitor software.
After clicking Next>, installation of the SQL server will begin. You will be
able to see the install progress of the SQL server and after the server is installed
the PPM database will be created.
PPMonitor Version 2.2.1.3 Software Manual
4
1 Setup
The next component to be installed is the crystal reports. After the crystal
reports is installed, you will be taken to the Telgesis driver installer. Clicking
Install will begin the installation of the driver.
Once setup has completed the installation of the client, click Finish, and the
system has now been set up. You will need to restart the computer before you
run the PPMonitor software for the first time.
1.3 Upgrading
If you have running an older version of PPMonitor (2.2.0.1 or earlier) then you
will need to completely remove the old software before you install the new
version. You can do this using the PPMonitor Removal tool located in the
Tools>Misc>PPM folder of the CD. However if you have already installed
PPMonitor version 2.2.0.1 or higher then you can upgrade the software without
removing the old version.
You will need to stop both services associated with the PPMonitor program
before navigating to the Upgrade folder in the CD. In this foder you will find
a file called Update PPMonitor.exe. Run this program to update the
software to the latest version. The program will first check if it can update
your current version before running the update.
PPMonitor Version 2.2.1.3 Software Manual
5
2 Startup
2.1 Before first run
Before
starting
the
software for the first time,
find the desktop icon,
right-click on it and select
Properties.
Once in the properties
window, go to the
Compatibility tab, and
tick the box labelled Run
this program as an
administrator. After this,
click OK.
PPMonitor Version 2.2.1.3 Software Manual
6
2 Startup
2.2 Starting the software for the first time
To start the software, double-click the desktop icon.
NOTE: The software is
split into two parts; the
client and the services.
The client provides the
graphical user interface
you are viewing, and
the services record
data and interface with
the wireless units. The
services
must
be
running any time you
wish to record data.
The splash screen will now appear. If the services are not running, you will be
prompted to start them.
For the software to run successfully, both services must be running, so click
Yes to both prompts.
PPMonitor Version 2.2.1.3 Software Manual
7
The first time the software is run, the Company Info screen will appear. You
are not required to enter all the data, but any field with an asterisk (*) is
required to continue (If you wish to change these details in future, information
on this can be found in section 8.1).
TIP: After you have
configured your Email
Sever Settings you can
Send a Test Email to
verify your settings.
Clicking on NEXT will bring you to the Setup PPMonitor screen. Here you
can select your temperature scale, decide if you want an audible alarm and
choose to recive e-mails if a celing alarm is breached.
PPMonitor Version 2.2.1.3 Software Manual
8
NOTE: Once you have
selected
either
'degrees Celsius' or
'degrees
Farenheit',
this cannot be undone.
You will need to clear
the database and loose
all saved data if you
wish to change to a
different temperature
scale.
If you are using your PPMonitor software as a means of looking at touchscreen
data only, then we would recommend not using audible alarms or alarm emails. If you choose to recive no e-mails then you can begin the program for
the first time by pressing Finish (you can choose to setup e-mails at a later
date). If you know your e-mail settings when you install the program, then you
can choose Yes to the e-mail option by simply pressing Next >> and
configure your email server settings before pressing the Finnish button to start
the software for the first time.
If you ar unsure of how to setup the e-mailing system but would like them then
you can set them up latter in the e-mail section of the Admin screen (see
section 8.10). Select No to the e-mail option for now then press the Finnish
button then contact PPMTechnology or your network administration team for
assitance.
PPMonitor Version 2.2.1.3 Software Manual
9
3 Monitoring
When
opening
the Monitoring
window for the
first time, there
will be a blank
screen while the
system attempts
to find the units
on the network.
After a while, the
system
should
find the units and
begin recording
the data.
If no units have
been
detected
after 10 minutes,
please
consult
the
troubleshooting
section.
3
PPMonitor Version 2.2.1.3 Software Manual
10
3 Monitoring
3.1 Graph overview
Clicking on the Monitor icon will bring up the monitoring window.
TIP:
Placing the cursor on
the graph line will show
the precise values and
time. For the TWA line
it will also tell you if it is
the projected or actual
TWA.
This window gives an overview
of the data being recorded by a
wireless unit in a series of
graphs. In the above image, the
data for the last 2 days is being
shown. This can be changed
using the Show last drop down
menus. You can view 1 to 24
hours worth of data or 1 to 7
days worth of data.
In instances where there are multiple wireless
units in use, the data for other units can be
viewed by selecting them in the Unit drop down
menu. They are seperated into three main
sections:
•
Units currently transmitting (the top
section),
•
Units downloaded from a touch screen
unit (the middle section)
•
Units currently unavailable (the bottom section).
PPMonitor Version 2.2.1.3 Software Manual
11
3. Monotoring
The monitoring screen has three Readings to show options, namely
Current, TWA and All.
•
1
. There can be small
gaps in the data but if
there are large gaps
then the TWA
calculating time
resets to 0 minutes.
Current shows only the graphs for the actual reading collected from the
sensors on a minute by minute basis.
•
TWA shows only the graphs for
the Time Waited Avarage calculated
from the past data. The TWA is based
on an 8 hour time period. For the first
1 hour of continious readings1 there is
no TWA reading available due to
insufficient data. A projected TWA is
calculated by the software between 1
and 8 hours of continious readings 1.
The last reading recived is projected
for the reminder of the 8 hour TWA
time period.
After 8 hours of
continious readings1 the software
calculates the actual TWA for that
minute based on the last 8 hours of
collected data.
•
All shows both the Current and TWA graphs. This is the default view.
In the default view once a TWA value is available you will have an extra line,
label and value on the top of each graph. For Projected TWA the TWA line,
label, and calculated value is gray. Once you have collected enough data for an
Actual TWA the line, label, and calculated value will turn green.
PPMonitor Version 2.2.1.3 Software Manual
12
3. Monitoring
In the event of an active alarm, the colour of the corresponding graph will
change.
The above graph is showing values above the ceiling (which has been set to
10°C for demonstration purposes) and the graph has turned red. The default
settings are red for a ceiling alarm and orange for an intermediate alarm.
Pressing the Reset Alarms button will deactivate any outstanding alarms as
long as the levels have dropped below the threshold.
PPMonitor Version 2.2.1.3 Software Manual
13
3 Monitoring
3.2 Detailed graph view
Double-clicking on a graph will bring up a more detailed view of the graph.
The panel on the right allows you to control the parameters of the graph. The
Data section allows you to define the date range the graph displays. The
Readings to Show section is the same as described in section 3.1. The
Current Schedule section displays the scheduled times for recording
information. The Y Axes section allows you to control the scale of the graph's
Y axis. In the example above, the system is in schedule overide mode, so
“N/A” is displayed. Print Graph displays a printable version of the data.
Clicking on the Sensors tab displays some additional statistics for the sensor.
The HCHO mg/m3 tab, which is only available for formaldehyde, also
displays some additional statistics.
PPMonitor Version 2.2.1.3 Software Manual
14
3 Monitoring
3.3 Importing data from a Touch Screen Unit
The Touch Screen IAQ Profile Monitor is a stand-alone Indoor Air Quality
(IAQ) monitoring unit, capable of monitoring multiple IAQ parameters. Sensor
readings are displayed continuously and in real time on an inbuilt LED screen.
The Touch Screen unit has a USB port which can be used to download the data
collected on the device. The downloaded data can then be imported by the
PPMonitor program and viewed in the PPMonitor software by clicking on
FILE and then on IMPORT TSU DATA. Choose the file containing the data
on the USB module and select IMPORT DATA.
PPMonitor Version 2.2.1.3 Software Manual
15
Please wait while the data is imported (time will vary depending on the amount
of data to be imported)
Once data has been sucessfully imported, it will be notified in the session
history (see section 10).
PPMonitor Version 2.2.1.3 Software Manual
16
4 Alarms
By default, the alarm window is minimised at the lower left of the screen.
This window will automatically pop up when there is an ongoing alarm, but it
can also be accessed by clicking restore or maximise on the minimised
window, or clicking the Alarms button at the top of the screen. When the
alarm window is active, it will display any current alarms and give additional
details (unit name, reading value, threshold value etc.)
Clicking the Disable Pop-up button will stop the alarm popping up, and it
will need to be accessed manually.
Information on setting up alarms can be found in section 6 of this manual (Unit
Setup).
PPMonitor Version 2.2.1.3 Software Manual
17
5 Schedules
The schedules window allows you to control the times at which data from the
units is recorded. The window can be accessed by clicking Schedules on the
menu bar. By default schedule override is turned on and a message will pop-up
notifying you of this.
While in schedule override mode, data from the units will be continuously
recorded. For any schedules to take effect, the Schedule Override tick box
must be unticked.
Within the schedules window, there is a panel on the left to select units, and a
week view displaying schedules.
The above window currently contains no schedules. To create one, double-click
on a time cell.
5 Schedules
PPMonitor Version 2.2.1.3 Software Manual
18
5 Shedules
A schedule unit has now been created. Double-clicking on this unit allows you
to further modify the times and days of this schedule unit.
The start and end times can be changed by using the arrow buttons. If the same
schedule recurs on other days of the week, ticking the appropriate boxes under
Recurrence will automatically copy the schedule to these days. Once the
schedule is complete, clicking Update makes the changes to the schedule.
Accessing the same window and clicking Delete will remove the schedule.
Once the schedule is complete, by default they are applied to one unit. It is
possible to apply the schedule to multiple units by selecting All units for this
service.
PPMonitor Version 2.2.1.3 Software Manual
19
5 Schedules
After making this selection, the schedule can be saved using the buttons at the
lower right of the window.
To copy a schedule from one unit to another, select the unit with the schedule
and click Copy. Then select the unit to copy the schedules to, and click Paste.
The schedules must be saved after copying. The Reset All buttons removes all
schedules from all units.
If you have stored presets, they can be applied to a unit by selecting the
appropriate preset, and clicking Save. Information on creating presets can be
found in section 8.2 (Preset Times).
PPMonitor Version 2.2.1.3 Software Manual
20
6 Unit Setup
When opening the Unit Setup window, the first thing you will encounter is the
list of groups and units. First you will see the ungrouped units followed by the
grouped units with each group appearing in alphabetical order. Within the list,
clicking the + next to the unit will expand it and show the measurements the
unit is capable of taking.
The circle next to
unit name indicates
current state of
unit. By default
colours are set
follows:
the
the
the
the
as
The colours can easily
be
changed,
and
information on doing
this can be found in
section 8.5 (Colour).
Within the options of a unit, the following information will be displayed.
Within these options, you are able to change the name of the unit (which is the
serial number by default) to something more friendly. You can also change the
location of the unit (more on locations in section 8.7). Since we can now
receive data from multiple COM Ports the COM port number receiving data
from the unit in question is shown. Changes made here can be saved by
clicking Save at the lower right of the window.
Clicking Unit History brings up this
window. Within this window is a list
of the unit's activity for the entire
day. Other days can be viewed by
changing the date at the top of the
window. Most items in the history are
computer generated, but it is possible
to add your own text to the history by
typing in the box and clicking Add
Text.
6 Unit Setup
PPMonitor Version 2.2.1.3 Software Manual
21
6. Unit Setup
The unit history for the selected date can be saved as a text file by clicking
Save. The Print button generates a printable version of the history.
NOTE: Relays can only
be used under two
circumstances:
1. The wireless unit has
its own relays.
2. The wireless unit is
in a group where there
is a master unit with
relays (more on unit
groups in section 8.3).
TIP:
Relays
are
devices that open and
close
an
external
circuit. They have many
potential applications,
such as activating a
siren when levels of a
chemical
become
dangerous,
or
activating a climate
control system at a
certain temperature.
Clicking one of the subcategories will take you to the sensor and threshold
settings.
On this screen, you can change the name of the measurement taken. Threshold
settings allow you to change the thresholds which trigger the alarms to match
your own safety regulations. Which relays activate with which alarm and the
duration they remain on can be set under Relays and Duration, respectively.
The colour option sets the background colour of the graph in use when an
alarm is triggered. The settings here are not stored until Save is clicked.
PPMonitor Version 2.2.1.3 Software Manual
22
7 Reports
The Report feature allows you to generate a report of sensor activity for a
specific duration. Clicking Report brings up the report window.
Selecting Company Details will generate a document containing the
company details only (how to set company details in section 8.1). The
company details are also included in the Sensor Report. Clicking OK takes
you to the next screen, where more parameters can be set.
To generate a report, you must select the units and sensors to include data from,
and then select the date range you wish to get readings from. The units are
ordered in three sections which are: Active Units, Inactive Units and Touch
Screen Units. When you select a unit from the Units list it will automatically
select all sensors present on that list in the Sensor Types list. If you are only
interested in particular sensors for your report then you can uncheck the
unwanted sensors from the Sensor Types list. Selecting Include Readings
Data in Report will include all the readings taken by the sensor in the report
if Preview is selected.
PPMonitor Version 2.2.1.3 Software Manual
23
7 Reports
To generate the report, you must select its destination. Select Preview for an
instantly readable and printable format. Preview Reports are also effected by
your Reading Types radio button selection. You can include only Current
readings, only TWA readings or both these reading types (by selecting All) in
your preview reports. If you wish to manipulate the data in another software
package (such as Microsoft Excel), the report can be exported in a comma
delimited file which can be read externally. In locales where the decimal
separator is the comma, a pipe delimited file can be generated instead. For
comma and pipe delimited files only the current readings are included. If you
want to report the TWA values for these then you can calculate them yourself
using the other software package.
Once all the parameters have been selected, clicking OK will generate the
report. If Preview was selected, a preview window will open which includes
the report. The navigation on the left allows you to view the report details for
each individual unit and sensor, and the arrow buttons at the top of the window
allow you to navigate between pages in the report.
PPMonitor Version 2.2.1.3 Software Manual
24
8 Admin
8.1 Company Info
The company info screen allows you to enter the details of the company using
the software. These details will then be used by the software to generate
reports.
For systems without a
keyboard, the onscreen
keyboard utility can
easily be accessed by
one of three methods:
1. Clicking the keyboard
button within the
window.
2. Clicking the keyboard
icon on the menu bar.
8.2 Preset Times
3. Selecting Help > OnScreen Keyboard from
the menu bar.
The
Preset
Times screen
allows you to
create
schedule
presets to use
in
the
schedules.
To create a
preset, you
must
first
create
a
schedule
(information on how to do this in section
5). Once you have completed the schedule,
enter a name for it and click Save.
PPMonitor Version 2.2.1.3 Software Manual
25
8 Admin
8.3 Unit Groups
NOTE: A unit can only
be assigned to one
group at any one time.
The Unit Groups section allows you to assign all the wireless units into groups.
This allows units without relays to make use of relays in other units. To move
units between groups, select the group from the drop down menu and move the
units across. Moving to the right adds a unit to the group while moving to the
left removes a unit from the group. You can also select a master unit for the
group. To become a master unit, it must contain relays. The relays on the
master unit may then be used by other units within the group.
To create a new group, you must click New next to the drop down box, and a
window will appear. In this window, you can enter a name and an optional
description. Clicking Save then creates the group.
PPMonitor Version 2.2.1.3 Software Manual
26
8 Admin
8.4 System Information
Within the system information section are two useful tools; debug mode and
the ZigBee Network Tool.
In the event of a problem with the software, you may be asked to
place the software in debug mode. To do this, click the button
labelled Debug is off, and it should change to Debug is on.
When in debug mode, a text file is generated. These files can be
found in C:\ppm and will be titled with the date.
If the system is not finding any of the wireless
units, you may need to use the ZigBee Network
Tool. When a connection to the wireless units
cannot be established, the button will display a 5
minute countdown.
Once the 5 minutes have elapsed, the tool will be
available to use. Click on Start Network Tool and
the following window will open.
Since the ZigBee Service can now recieve data from multiple COM ports you
can select a port number using the drop down list. If only one port number is
available the drop down list will be greyed out. To use the tool, click Check
and then Fix. If the tool was successful, a dialog box will appear stating that
SCASTs have been received.
PPMonitor Version 2.2.1.3 Software Manual
27
8 Admin
8.5 Colour
The colour screen allows you to change the colours of the icons next to the
units (see section 6) to match any standard colours in use at the user's locale.
To change the colour, click the button next to the colour, and select a new one
from the palette. Click Save to keep any changes you have made.
8.6 Alarm Labels
This screen allows you to change the names associated with the alarms. These
new labels appear on the alarm screen and in the session and unit histories. To
change a name, just type it into the appropriate text box, and click Save to
keep the changes.
PPMonitor Version 2.2.1.3 Software Manual
28
8 Admin
8.7 Locations
This screen allows you to assign units to different locations. This may help in
finding where a unit is located, and also allows you to select locations to
generate reports on (see section 7).
To add a location, type a name into the text box and click Add. Selecting
Enable will add it to the Enabled list. To enable or disable a location, select it
in the list, and use the arrow buttons to move it between the Enabled and
Disabled lists.
8.8 Messages
This feature is not fully functional and currently has no use.
8.9 Paging
The paging feature (also found in Unit Setup) is only relevant to the SAS unit.
Technical support will advise you when this feature needs to be used.
PPMonitor Version 2.2.1.3 Software Manual
29
8 Admin
8.10 Email
1
. This is only an
example, try and make
your
password
as
secure as possible
using numbers, capitals
and special characters.
This screen alows you to setup the system to send emails when a ceiling alarm
is breached. Firstly you need to set an e-mail account from which you will
send e-mails. For instance you could set up an e-mail with google called
[email protected] with the password myPassword 1. After this you will
need to enter your Email Server Settings into the PPMonitor program and
decide which e-mail account/s need to recieve the alarm messages.
2
. Other e-mail servers
will
have
different
details which are often
found by an internet
search. If you are using
your own companys
server to send the
alarm
e-mails
then
contact your network
administration team for
server details.
3
. For some servers the
Username is only the
characters before the
@.
For the example above the Server setting is smtp.gmail.com using port number
587 and using SSL2. Both the Email Address and Username are set to
[email protected]. The password is myPassword or whatever you have
chosen when setting up your account.
You can add new recipients, update selected recipients using the Emails
Settings section. It is also possible to send a test e-mail by clicking on a
recipient and pressing the Send Test Email button. If your Email Server
Settings are correctly configured and your recipient is valid then you shoud
shortly recieve an e-mail in your account.
PPMonitor Version 2.2.1.3 Software Manual
30
9 Addresses
The addresses section is used to connect the client to a COM port on another
computer on your network or to an Ethernet Access Point. The Ethernet
Access Point ia a "gateway" allowing access to ETRX2 mesh networking
modules via an industry standard Ethernet IP Network. Once the IP address of
the EAP has been established and Firewall access negotiated, the EAP can be
accessed from anywhere in the world.
For example, multiple EAPs can be deployed, each connected via Ethernet to a
ZigBee PAN in different parts of the building.
Here we see the system configured to accept data from EAP_001. The EAP is
configured to transmit data on port 10001 of IP 192.168.123.61. You can
configure the system to receive data from multiple EAPs by adding more
remote ports on other IP addresses.
PPMonitor Version 2.2.1.3 Software Manual
31
10 Session
The session window is similar to the Unit History, but this displays the history
for all units and the software itself. The session history for today is displayed
when opened, but the date can be changed using the drop down calendar at the
lower right of the window. Clicking Refresh allows you to view events that
have happened since the window was opened.
The session history can be exported as a text file by clicking Save, or it can be
exported in printable format by clicking Print.
PPMonitor Version 2.2.1.3 Software Manual
32
11 Troubleshooting
Alarms are not being triggered when values pass the threshold.
This may occasionally happen, and there is no obvious cause for it. Restarting
the client is usually enough to resolve this problem.
The monitoring screen is not updating.
If the units have been detected but the graphs are not being updated, this
problem is usually resolved by restarting the client.
Units are not being detected by the software.
The system is sent out pre-configured so that detection of units is automatic. If
units are not being detected, try the following solutions:
1. Make sure the wireless units are turned on.
2. Make sure the wireless units are within range of each other and the PC
recording the data.
3. If the units are not being detected after 10 minutes, follow the
instructions in section 8.4 to run the ZigBee Network Tool.
If the troubleshooting section has not resolved any of your problems, please
contact PPM Technology or your distributor. Contact details can be found here:
Contact PPM Technology
PPMonitor Version 2.2.1.3 Software Manual
33