1
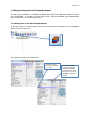
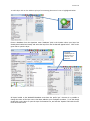
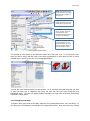
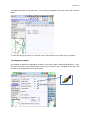
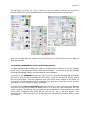
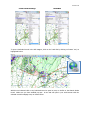
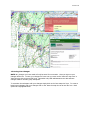
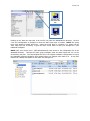
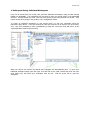
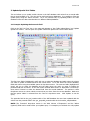
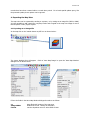
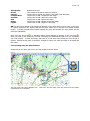
AS Oct 2012
WalesHER
GAT User Manual
GIS Mapper
1. Editing and Saving the GAT Group Workspace
1.1 Adding Layers
1.2 Creating Layer Groups
1.3 Editing Layer Styles
1.4 Hotlinking RCAHMW & Cadw Listed Building Records
1.5 Saving Your Changes
2. Editing and Saving Individual Workspaces
3. Update Spacial Join Tables
3.1 Example: Updating the Postcode Field
4. Exporting the Map View
4.1 Exporting as an Image File
4.2 Exporting using the Print Function
AS Oct 2012
1. Editing and Saving the GAT Group Workspace
The GAT group workspace is the default workspace that loads in the ‘Web GIS’ table in the panel
view of WalesHER. It is visible to all user access levels. Only the WalesHER group administrators
(user access level 1) can edit their group layer.
1.1 Adding Layers to the GAT Group Workspace
In the map click on the ‘switch themes on/off’ icon (to the right of the hammer icon) as highlighted
below. This is your layer tool:
The Layers box will open as shown below:
To expand & collapse
layer groups, click on the
+ or – icons.
Check the tick boxes to
view layers, make them
selectable and editable.
Uncheck the boxes to turn
these options off. Always
hit ‘Apply’ to apply your
changes.
AS Oct 2012
To add a layer click on the ‘Add a map layer from existing data source’ icon as highlighted below:
Chose a database from the dropdown menu ‘Database’ (this is the location where your layer has
already been loaded and saved) and select the layer from the list that will appear below. Click on the
green tick to open the layer.
Your newly
uploaded layer will
appear at the top
of the list in the
Layer box.
All layers loaded to the WalesHER database must have the prefix ‘geo’. However it is possible to
change the name of the layer once it has been added to your workspace as above. To do this simply
double-click on the layer to open the Layer Information box, and edit the ‘Caption’ field with the new
name as shown below:
AS Oct 2012
Name: Editing this field will
change the name of the layer.
This name will not appear in
the layer list.
Caption: Editing this field will
change the name of the layer
that appears in the layer list.
Comment: Describe the data
source, purpose, nature etc.
of the layer here. This
information will appear when
you hover over the layer.
Group: If you layer is part of
a group of layers, you can
chose which layer group you
want your layer to appear in
from the dropdown menu.
It is possible to move layers up and down the layers list in the Layer Tool. To do this click on the
layer you want to move, and then click on the ‘Move selected layer or group down one line’ or ‘Move
selected layer or group up one line’ tools as highlighted below:
You can also move selected layers into layer groups. To do this make sure that the group you want
to move the layer into is expanded, then move the layer into the layer group using the tools
highlighted above. The layer will appear slightly indented to the right when it has been successfully
moved into a layer group.
1.2 Creating Layer Groups
To create a layer group click on the ‘Add a map layer from existing data source’ icon (see above). In
the ‘Add Layer’ box navigate to the last tab on the right called ‘Group’. Give your layer group a name
AS Oct 2012
and caption and click on the green tick. Your group should appear at the top of layer list as shown
below:
To move the layer group down or up the list, and to move layers into the layer group, see above.
1.3 Editing Layer Styles
It is possible to change the appearance of layers to suit group needs or individual preferences. To do
this open the Layer Tool and double click on the layer you want to edit. Navigate to the ‘Style’ tab
and click on the paintbrush icon as shown below:
AS Oct 2012
This will open the ‘Styles’ box. This is where you can pick symbols, area fills and colours etc.
Navigate between the various dropdown-menus to find a style that you like, as shown below:
Once you are happy with your selection click on the green tick to close the boxes, and hit ‘Apply’ to
apply your changes.
1.4 Hotlinking RCAHMW and Cadw Listed Building Records
The data supplied by the RCAHMW and Cadw on a quarterly basis contains a url to each individual
record entry on the Coflein and Historic Wales Portal webpages. It is possible to link the RCAHMW
and Cadw Listed Building data in the GIS mapper to these webpages.
To do this for the RCAHMW data open the Layer Tool box, select the RCAHMW layer and double
click on it to open the Layer Information box (see above). Under the tab ‘General’ tick the ‘Hotlink’
tick box at the bottom. From the dropdown menu ‘pick column name’ navigate to and select ‘url’
from the list. ‘url’ will then appear in the ‘Expression’ box. Click on the green tick to close the Layer
Information box and hit ‘Apply’ to apply your changes.
To do this for the Cadw Listed Building data open the Layer Tool box, select the Listed Buildings
layer from the layer group Cadw and double click on it to open the Layer Information box (see
above). Under the tab ‘General’ tick the ‘Hotlink’ tick box at the bottom. From dropdown menu ‘pick
column name’ navigate to and select ‘Hw_url’ from the list. ‘Hw_url’ will then appear in the
‘Expression’ box. Click on the green tick to close the Layer Information box and hit ‘Apply’ to apply
your changes.
AS Oct 2012
Cadw Listed Buildings
RCAHMW
To open a hotlinked record in the GIS mapper, click on the ‘Load URL by clicking on feature’ tool, as
highlighted below:
With this tool selected click on any hotlinked record to open its entry on Coflein or the Historic Wales
Portal. Make sure you have enabled pop-ups. A new tab will open in your web browser with the
selected record’s webpage entry as shown below:
AS Oct 2012
1.5 Saving Your Changes
NOTE: Any changes you have made will only be saved for one session. Once you sign out your
changes will be lost. To save your changes for future use you must use the ‘Save the map view’ or
‘Save the map view as an xml file’ tools. Remember only HER administrators can edit and save
changes made to the GAT group workspace.
To overwrite the workspace with your changes simply click on the ‘save map view’ icon. To create a
brand new workspace with your changes click on the ‘Save the map view as an xml file’ icon. Both
options are highlighted below:
AS Oct 2012
Save the map
view as an xml
file
Save the map
view
Clicking on the ‘Save the map view as an xml file’ will open the WalesHER file directory. Click on
‘root’ and ‘configuration’ to navigate to where the GAT group layer is located. NOTE: The group
layer must always be called ‘layers.xml’. Select the group layer to overwrite it (or simply use the
‘save map view’ tool as above), or give the layer a new name to save your changes as a new
individual workspace.
NOTE: Only user access level 1 (HER administrators) have access to the configuration file in the
WalesHER directory. Therefore the GAT group workspace must be called ‘layers.xml’ for it to be
accessed by everyone. The ‘layersoriginal.xml’ file is the original workspace configuration set up by
the WalesHER software developer Steve Smith before any changes were made to it. It has been
retained as a backup and please do not make any changes to it.
AS Oct 2012
2. Editing and Saving Individual Workspaces
Users on all access levels can create, edit, and save individual workspaces using the data already
loaded into WalesHER. The workspaces can be saved to their user profile folder in the WalesHER
directory. All users below user level 1 will only have access to their own personal user profile. They
cannot access other people’s user profiles, or the configuration folder.
To create an individual workspace on user access levels 3-2 edit your workspace using the
instructions given above. Then save it using the ‘Save the map view as an xml file’ icon in the Layer
Tool. Give your workspace a name (remembering to keep the .xml at the end) and save it in the
‘myConfiguration’ folder as shown below:
When you start a new session the default GAT workspace will automatically open. To open your
individual workspace simply open the Layer Tool and click on the ‘load a saved map view’ icon (the
open folder icon) and select your workspace from the list. Click the green tick to open the
workspace.
AS Oct 2012
3. Update Spacial Join Tables
This tool allows you to update a table column in the GAT database with values from a second table
that is joined spatially to it. The join can be performed across databases. It is possible to filter the
update query using the ‘Where’ function. It’s a very efficient way of populating fields in the GAT
database where the data exists elsewhere in different tables/databases.
3.1 Example: Updating the Postcode Field
Click on the ‘Ink Tool Tree’ icon in the map and navigate to ‘Geo Table Update/Query’ and ‘Update
Spacial Join Tables’. This will open the ‘Update Tables with Spacial Join’ box as shown below.
The first three fields (highlighted in pink) ask you to select the database and table where the column
you want to update is located and then the column itself. To do this select the correct database,
table and column using the available options in drop-down menus. The next two fields (highlighted in
green) ask you to select the database and the table where the value you want to update the
postcode field with is located. In the next section entitled ‘With Column or Expression’ use the dropdown menu ‘Columns’ to select the desired field from the second database. The options in these
drop-down menus are colour coded to ensure that you chose from the correct database. Make sure
that the option ‘Within’ is selected from the ‘Join On’ drop-down menu. Click ‘Update’ to run the
query.
The postcode field in the geo_locations table of the GAT database has now been updated with the
values from the postcode field in the geo_gwynedd_postcode table in the herwales_map database.
NOTE: The ‘Functions’ drop-down menus in the ‘With Column of Expression’ and the ‘Where
(optional)’ fields can be used to filter your update query. For example you could ask it to only update
AS Oct 2012
records that have been created within a certain time period. For a basic spacial update query, like
the postcode update, these options can be ignored.
4. Exporting the Map View
The map view can be exported by sending to a printer, or by saving as an image file (JPEG or PNG).
It is also possible to add a scale bar, compass, border and a legend to the map view image for use in
HER enquiries or GAT project reports.
4.1 Exporting as an Image File
In the map click on the ‘switch themes on/off’ icon as shown below:
The Layers dialogue box will appear. Click on ‘Save Map Image’ to open the ‘Save Map Window’
dialogue box as shown below:
Fill out the fields in the Save Map Window dialogue box above as follows:
xy
Image Width
Format
Auto-filled with location of the map view
Default set to 800. Change as necessary
use the dropdown menu to select JPEG or PNG
AS Oct 2012
JPEG Quality
Rotate
Smooth
Compass Rose
Scale Bar
Grid
Border
Legend
Default set to 80%
This rotates the image by degrees if desired
Tick this box to smooth the edges of the image (anti-alias filter)
Tick this box to add a compass to the image
Tick this box to add a scale bar to the image
Tick this box to add a grid to the image
Tick this box to add a border around the image
Tick this box to add a legend to the image
NB The layers that appear in the legend will depend on the layers that you have open in the map.
To remove layers from the legend, uncheck the ‘layer visible’ box in the layer tool (Switch themes
on/off). To make grouped layers invisible expand the group and uncheck the ‘layer visible’ box for
each layer individually.
Save using the green tick , or abandon making these changes by clicking on the red cross .
When you click on the green tick, the map view image will automatically open as a new window in
your web browser. To save the image, right click on it and select ‘Save Image As’ from the list of
options. Amend the file name if necessary, navigate to where you want the image to be saved and
click ‘Save’.
4.2 Exporting using the Print Function
Simply click on the ‘print map’ icon in the map toolbar as shown below:
This will open the Print dialogue box.
connected to your computer.
Click ‘OK’ and the map view will print from the printer