1
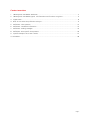
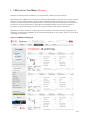
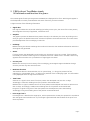
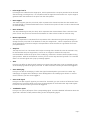
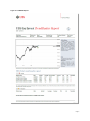
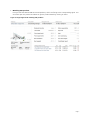
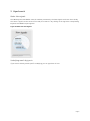
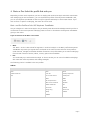
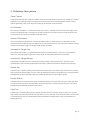
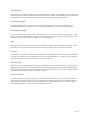
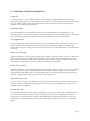
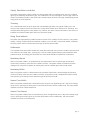
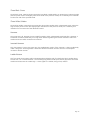
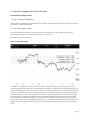
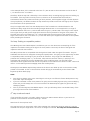
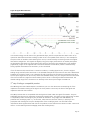
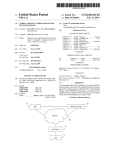
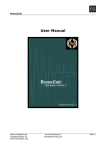
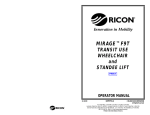
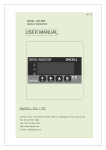
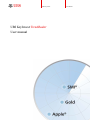
UBS KeyInvest TrendRadar UBS KeyInvest TrendRadar User manual Page 1 Content overview 1. UBS KeyInvest TrendRadar: Welcome! ................................................................................................ 3 2. UBS KeyInvest TrendRadar signals: All information and functions at a glance .................................... 4 3. Signal search ...................................................................................................................................... 8 4. Basic or Pro: Select the profile that suits you ....................................................................................... 9 5. Definitions: Chart patterns ............................................................................................................... 13 6. Definitions: Candlestick information ................................................................................................. 15 7. Definitions: Trading strategies .......................................................................................................... 19 8. Definitions: Price-specific chart patterns............................................................................................ 20 9. Specific examples: this is how it works.............................................................................................. 21 10. Disclaimer ......................................................................................................................................... 28 Page 2 1. UBS KeyInvest TrendRadar: Welcome! Welcome to UBS KeyInvest TrendRadar, your signal sender, based on technical analysis! With KeyInvest TrendRadar you can gain new investment ideas based on technical chart analysis, without having to actively analyse yourself. The KeyInvest TrendRadar analyses underlyings from various asset classes in real-time and identifies whether patterns or formations relevant to chart-technical analysis can be found in the price development. If the KeyInvest TrendRadar detects a technical chart pattern or formation it is illustrated clearly in the form of a signal including all the relevant information. Depending on which markets or underlyings you are interested in and which trading strategy you are following, the KeyInvest TrendRadar can be customized individually to your needs. How this can be done is outlined in this manual. Figure 1: TrendRadar Landing page Page 3 2. UBS KeyInvest TrendRadar signals: All information and functions at a glance The newest signals found by the KeyInvest TrendRadar are displayed in list form. Which signals appear in the list depends on which personalisation and search functions you have activated. A signal consists of the following information: • Signal data Each signal includes the concerned underliyng including current price, the name of the chart pattern, the recognition time and, if applicable, a break-out time. • Graphics The graphics present the detected chart pattern directly in the relevant price chart. By clicking on the chart you get to the deailed view which includes all important chart-technical levels. The chart shows price developments of the underlying in real-time. • Exchange Besides naming the relevant exchange the candle stick interval is also mentionned based on which the chart-signal was generated. • Status If a chart pattern has developed but not broken out, the status is given as 'Formed'. If the breakout has already occurred the status is given as “Breakout occurred”. Please note: in the Basic version only signals that have broken out a pre-selection of signal types are shown. • Current price Besides the current price and currency of the underlying, percentage change and absolute change since the previous day close are also shown • Breakout direction The breakout direction shows whether it is an upward (long, i.e. rising price potential of the underlying) or a downward (short, i.e. falling price potential of the underlying) signal. This information is only displayed when the signal has broken out. • Time frame Short-term: a signal is short-term if the chart pattern has developed over less than 10 days. Accordingly a short-term holding time of the position recommends itself. Medium-term: a signal is medium term if the chart pattern has developed over less than 30 but more than 10 days. Accordingly a medium-term holding time of the position recommends itself. Long-term: a signal is long-term if the chart pattern has developed over more than 30 days. Accordingly a long-term holding time of the position recommends itself. • Price target level 1 Price target level 1 describes the target price, which represents the closest price potential in accordance with the signal that has broken out. A price target is generated with the breakout of the price from the chart pattern. Page 4 • Price target level 2 Price target level 2 describes the target price, which represents the next price potential to be achieved after achieving price target level 1 in accordance with the signal that has broken out. A price target is generated with the breakout of the price from the chart pattern. • Next support The closest support gives the price level, which represents the closest level that the value would have to break through in a downward direction from a technical chart point of view in order to then be able to continue falling. • Next resistance The next resistance gives the price level, which represents the closest obstacle from a technical chart point of view. The price must overcome this obstacle in order to then be able to continue rising. • Return expectation The return expectation is calculated for chart patterns with a breakout and gives the percentage of change from the price level of the breakout to the price target level 1, which is expected on the basis of the calculations of technical analysis. This expectation cannot be seens as a guarantee for future price performance. • Stop-loss The stop-loss level is an instrument which helps to manage risks. Should this value be reached it may be assumed that the price target levels 1 and 2 can no longer be achieved. The stop-loss recommendation relates to the price of the underlying, at which the investor should consider closing open positions. With the 'Professional' versions you can set the stop-loss level yourself. If it is reached there is an acoustic signal and a pop-up message appears. • Alert Here you can define an alert that will create an accoustic signal and show a pop-up message as soon as the underlying reaches the given price level. In order to use this function you have to be logged-in. • Save underlying Here you can add the underlying in which the signal has developed to your watch list. Under 'My underlyings' all signals which develop or have developped on this underlying are shown. In order to use this function you have to be logged-in. • Save trend signal Here you can add a specific signal to your watch list. Therewith, you can continue to follow the future performance of a specific signal at any time. All saved signals can be found under 'My Trend Signals'. In order to use this function you have to be logged-in. • TrendRadar report Here you can open a pdf-report of the corresponding signal. It contains detailed information about the signal and a selection of UBS products fitting to the corresponding signal. Page 5 Figure 2: TrendRadar Report Page 6 • Matching UBS products Here you will find selected UBS structured products, which are fitting to the corresponding signal. You can either open the product termsheet or get the product details by clicking on them. Figure 3: Single Signal with matching UBS products Page 7 3. Signal search Radar: New signals The UBS KeyInvest TrendRadar scans the markets permanently. The latest siganls are shown here visually. The closer a signal is to the center of the radar, the newer it is. By clicking on the signal the corresponding KeyInvest TrendRadar report appears. Figure 4: Radar with new Signals Underlying search by type in If you want to directly search specific underlyings you can type them in here Page 8 4. Basic or Pro: Select the profile that suits you Depending on how much experience you have in dealing with technical analysis and which asset classes and underlyings you are interested in, you can use different profiles of the KeyInvest TrendRadar. Also, you can use KeyInvest TrendRadar to search only for signals that develop in certain asset classes. If you wish to focus on specific underlyings, the watch list can be used. Basic- and Pro-Profiles of the UBS KeyInvest TrendRadar Are you a beginner in technical analysis or do you already have advanced knowledge? Would you like to concentrate on the most important underlying assets or move in all markets? The KeyInvest TrendRadar gives you the choice. Figure 5: Selection of the Basic or Pro Profile • Basic The "Basic" version is best suited for beginners in technical analysis. In the Basic profile the KeyInvest TrendRadar only shows you signals which are based on the most common technical chart patterns: trend channels, triangles and head & shoulder formations. The profile allows you to select underlyings from a broad universe of stocks, indices, currency pairs and commodities. • Pro: You are already a pro with technical analysis. In the Pro version you can scan all available underlyings with more than 50 chart patterns and trading strategies. The following choice is available in the two profiles: Indices Basic Pro DAX ATX Nikkei EURO STOXX 50 CAC 40 Nasdaq Composite SMI China Shenzhen B Nasdaq 100 DAX SDAX DJ Transportation SET50 Dow Jones Industrial S&P 500 EURO STOXX 50 SMI FTSE 100 SMIM PI Hang Seng Swiss PI PR Kospi TecDAX MDAX Page 9 Stocks from Indices Basic Pro DAX ATX Nasdaq 100 Dow Jones CAC 40 Nasdaq Composite EURO STOXX 50 DAX S&P 500 Nasdaq DJ Transportation SDAX SMI Dow Jones Industrial SMI EURO STOXX 50 SMIM PI FTSE 100 Swiss PI PR MDAX TecDAX Precious metals & commodities Basic Pro Gold Aluminium Orange juice Silver Brent crude oil Palladium Cocoa Platinum Coffee Rapeseed Corn Rhodium Copper Rice Cotton Rubber Feeder cattle Silver Gold Soybeans Henry HUB natural gas Soybean meal Lead Sugar Lean hogs Timber Live cattle Tin Milk Wheat Nickel WTI crude oil Oats Zinc Page 10 Currency pairs Basic Pro Euro / US Dollar British Pound / South African Rand Swiss Franc / Norwegian Krona British Pound / Australian Dollar Swiss Franc / South African Rand British Pound / New Zealand Dollars Swiss Franc / Hungarian Forint British Pound / Hungarian Forint Swiss Franc / Swedish Krona Euro / Swiss Francs Euro / Japanese Yen US Dollar / Swiss Francs British Pound / Swiss Franc British Pound / Japanese Yen Swiss Franc / Polnish Zloty Swiss Franc / Japanese Yen Swiss Franc / Danish Krone British Pound / US Dollar Swiss Franc / HK Dollar British Pound / Danish Krone US Dollar / Türkish lira Euro / New Zealand Dollar US Dollar / South African Rand Euro / Turkish Lira US Dollar / Mexican Peso Euro / South African Rand US Dollar / Hungarian Forint Euro / Austrailian Dollar US Dollar / Czech Koruna Euro / Hungarian Forint US Dollar / Swiss Franc Euro / Swiss Franc US Dollar / Japanese Yen Euro / Japanese Yen US Dollar / Danish Krone Euro / British Pound US Dollar / HK Dollar Euro / Danish Krone US Dollar / Norwegian Krona Euro / US Dollar Underlyings Do you prefer to trade in specific asset classes? Select between 'Indexes', ‘Stocks’, 'Currencies' and 'Commodities' in the menu so that only signals from these classes are displayed. To see chart signals from the entire underlying universe, select ‘All underlyings’ My underlyings Do you prefer to trade in certain underlyings? Then add these to your personalised watch list under 'Save underlying’. As a registered user you can create a list so that the KeyInvest TrendRadar only displays signals based on these underlyings. My Trend-signals Has the KeyInvest TrendRadar found one or more signals that interest you? Then save these under 'Save trend signals' in order to be able to retrieve them later as a registered user under 'My trend signals' and follow their future development. Filter TrendRadar will present a list of available chart patterns according to the profile you have chosen (basic or pro) and whether you have restricted the search to a specific asset class via the personalization function. Page 11 To further narrow down the results you can limit the list to certain pattern types or expected returns. You can choose an expected performance by entering a value in the field. Figure 6: TrendRadar Menu Page 12 5. Definitions: Chart patterns Trend Channel A trend channel limits the range of variation of the price action within a trend and is created by a parallel projection of an existing trend line through the extreme values on the opposing side. Leaving a trend channel generates a buy or sell signal according to the direction of the breakout. HS Formation The head and shoulders is a reversal formation that occurs in upward trends. Here two local high points surround an absolute high. The signal for the trend reversal occurs when the price resets under the line connecting the lows of the two smaller local high points. Inverse HS Formation The inverse head and shoulders is a reversal formation within a downward trend. Here two local low points surround an absolute low. The signal for the trend reversal occurs when the price breaks out above the line connecting the highs of the two small smaller local lows. Symmetrical Triangle Top The symmetrical triangle is a reversal formation within an upward trend, in which the price oscillates within two narrowing equiangular trend lines, while the fluctuation decreases continuously. Symmetrical Triangle Bottom A symmetrical triangle bottom is a reversal formation within a downward trend, in which the price oscillates within two narrowing equiangular trend lines, while the fluctuation decreases continuously. Double Top A double top is a bearish (falling prices) reversal formation that occurs when the price action can increase due to previously formed high, but then veers off towards the bottom. The double top is confirmed when subsequently the price falls back below the lowest rate between the two highest points. Double Bottom A double bottom is a bullish (rising prices) reversal formation that occurs when the price action falls back to a previous low, but then veers upwards. The double bottom is confirmed when the price rises above the highest point between the two lowest points. Triple Top A triple top is a bearish (falling prices) reversal formation that occurs when the price action can rise to a high, which was previously formed and achieved once more, but then veers off downwards. The triple top is confirmed when the price subsequently falls back below the lowest point of the price between the three high points. Page 13 Triple Bottom A triple bottom is a bullish (rising prices) reversal formation that occurs when the price action falls back to low, which was previously formed and achieved once more, but then veers upwards. The triple bottom is confirmed when the price rises above the highest point between the three lowest points. Ascending Triangle The ascending triangle is bounded on top by a horizontal trigger line and on the underside by an ascending trend line. It usually occurs in an upward trend and has a trend continuation character. Descending Triangle In the descending triangle the horizontal boundary line is – in contrast to the ascending triangle – on the bottom, while the top is limited by a descending trend line. Accordingly, descending triangles can often be found as a trend continuation formation in a downward trend. Flag The flag is similar to the trend channel, directed against the main trend consolidation formation, which can limit price action by two parallel trend lines. Flags are usually trend continuation formations. Pennant A pennant is a short-term consolidation formation inclined against the main trend that visually resembles a triangle and consists of two converging trend lines. Pennants generally act to affirm a trend, meaning that after closing in the direction of the main trend this continues Diamond Top A diamond top is a bearish (falling prices) reversal formation that occurs at the end of an upwards trend. Ideally the listings move to a phase of diversification and afterwards connect seamlessly together again like a symmetrical triangle before a sometimes sharp downward movement. The result is a highly volatile lying diamond, which also gave the formation its name. Diamond Bottom A diamond bottom is a bullish (rising prices) reversal formation that occurs at the end of a downwards trend. Ideally the listings move to a phase of diversification and afterwards connect seamlessly together again like a symmetrical triangle before a sometimes sharp upward movement. The result is a highly volatile lying diamond, which also gave the formation its name. Page 14 6. Definitions: Candlestick information Dragonfly The 'dragonfly doji' is a one-candle formation, characterised by a marginal difference between the opening and closing prices. Here the 'dragonfly doji' shows no or only a short wick with a relatively large fuse. This 'bullish reversal' shows a downward trend in the dominance of the bulls and may be an indication of an ending downward trend. Gravestone Doji The 'gravestone doji' is a one-candle formation and is inversely related to the 'dragonfly doji'. This formation shows no or only a short fuse with relatively long wick for a small candle body. The 'gravestone doji' is generally considered a 'bearish reversal' and may herald the end of an upward trend. Long-legged Doji The 'long-legged doji' signals market uncertainty. This one-candle formation closes near or equal to the opening rate and has an equally long wick as fuse. Due to the increased volatility in the bullish and bearish directions with a closing price close to the opening price, the 'long-legged doji' can herald the end of a trend. Above The Stomach 'Above the stomach' is a two-candle formation that represents a 'bullish reversal'. It arises in a downward trend and contains a black bearish candle followed by a white bullish candle. The opening rate of the white candle lies above the middle area of the black candle and forms a white candle body with a short wick and fuse. The theory then assumes a break in the downward movement. Below The Stomach 'Below the Stomach' is a two-candle formation that represents a 'bearish reversal'. It occurs in an uptrend and includes a white bullish candle followed by a black bearish candle. The opening rate of the black candle lies below the middle area of the white candle and forms a black candle body with a short wick and fuse. The theory then assumes a break in the upward movement. Eight New Price Lines The 'new prices' are a chain of candlesticks, which can consist of both white and black candles. The fact that each candle is created with a higher high than the previous one is fundamental. Their occurrence indicates a high trend dynamic. Evening Doji Star In an upwards trend a long white candle is followed by a 'doji' with an upward gap. Trading takes place in a narrow range without turning the bullish (rising prices) requirements of the previous candle into further gains. An 'evening doji star' shows a clear weakness in the upwards trend behaviour, which is confirmed by a price decrease and a black candle on the following day and is clearly to be considered bearish Page 15 Morning Doji Star In a downwards trend a long black candle is followed by a 'doji' with an downward gap. Trading takes place in a narrow range without the bearish (falling prices) requirements of the previous candle leading to further losses. A 'morning doji star' shows a clear weakness in the downward trend behaviour, which is confirmed by a price rise and a white candle on the following day and is clearly to be considered bullish. Three Line Strike Bearish After three candles with a falling price and lower lows within a downward trend, an increase above the high of the first candle takes place with a fourth candle. Therefore a complete upward revision occurred within a candle and a subsequent continuation of the downward trend is likely. Three Line Strike Bullish After three candles with a rising price and higher highs within an upward trend, an sale below the low of the first candle takes place with a fourth candle. Therefore a complete revision occurred within a candle and a subsequent continuation of the upward trend is likely. Hanging Man A 'hanging man' is a one-candle formation in which after an increase a sale takes place within a candle before the market turns back to the candle high. This indicates market weakness and further falling prices are likely. The pattern is confirmed by a following black candle. Mat Hold This bullish (rising prices) candle formation has five candles, in which the first - a long white candle- is corrected by three small black candles. Here, the first black candle opens above the first white candle, forming the high, which must be exceeded by the fifth, again a long white candle, in order to complete the pattern. Therefore the long white candle gives the start for the continuation of the uptrend. Dark Cloud Cover When the body of a long white candle is fully engulfed in an upwards trend by the body of the subsequent black candle, then it is referred to as a 'bearish engulfing pattern'. This chart pattern indicates emerging market weakness and a bearish (falling prices) trend change. Engulfing Bullish When the body of a long black candle is fully engulfed in a downwards trend by the body of the subsequent white candle, then it is referred to as a 'bullish engulfing pattern'. This chart pattern signals emerging market strength and a bullish (rising prices) trend change. Side By Side White Lines Bearish This bearish (falling prices) continuation pattern consists of a black candle within a downward trend, which is undercut again by the following candle with a gap. This candle can indeed close higher, but neither will it nor the subsequent white candle achieve an increase above the gap. Subsequently further falling prices are to be expected. Page 16 Side By Side White Lines Bullish This bullish continuation pattern consists of a white candle within an upward trend, which is surpassed again by the following candle with a gap. This candle does not only close higher, the torn gap is also not closed. The following candle is also white and it remains above the level of the gap. Subsequently further rising prices are to be expected Thrusting If in a downwards trend the price opens with a downwards gap after a long black candle, but in the course of the candle it recovers and forms into a long white candle, this is referred to as 'thrusting'. This usually bearish (falling prices) chart pattern can, however, also have a reversal character in the event of a breakout of the white candle above the low of the black candle. Rising Three Methods This bullish trend-perpetuating candle formation consists of five candles, of which the first, a long white candle, is clearly corrected by three small black candles. In turn the fifth, a long white candle, completes the chart pattern with an increase above the high of the first white candle. Deliberation In an upward trend three white candles each close above the high of the previous candle of which the last one contains a short body 'doji', 'spinning top'. This last candle signals emerging trend weakness and a possible reversal. Accordingly, the formation of a black candle should be expected as confirmation. Breakaway Bearish After a long white candle in an upward trend, the market opens with an upward gap and tends to continuously increase by more than two candles. The fifth, a long black candle concludes the bearish (falling prices) reversal chart pattern by moving back into the upward gap of the second candle. Breakaway Bullish After a long black candle in a downward trend, the market opens with a downward gap and tends to continue to fall by more than two candles. The fifth, a long white candle, completes the bullish reversal chart pattern by increasing into the downward gap of the second candle Harami Cross Bullish After a long black candle within a downward trend, the prices rise significantly and a 'doji' short trading range occurs, opening and closing price on the same level within the first candle body. This chart pattern indicates the end of a downward trend. Harami Cross Bearish After a long white candle within an upward trend, prices fall significantly and a 'doji' short trading range occurs, opening and closing price on the same level within the first candle body. This chart pattern indicates the end of an upward trend. Page 17 Three Black Crows Three black crows, meaning three consecutive long black candles within an upward trend, where the high and low points of each are slightly lower than those of the previous candle, are a relatively sure indication for the near end of the upwards trend. Three White Soldiers Three white soldiers, meaning three consecutive long white candles within a downward trend, where the high and low points of each are slightly higher than those of the previous candle, are a relatively sure indication for the near end of the downward trend. Hammer The name says it all, because the one-candle formation within a downward trend looks like a hammer: a small black or white candle body on a long lower shadow signalising the bottom formation within the candle and thus a bullish reversal on the market. Inverted Hammer This chart pattern is just as the name says, the upside-down version of the 'hammer': a short candle body under a long wick. It also signalises a short-term bottom formation and the chance of a subsequent increase or bullish reversal. Ladder Bottom This five-candle chart pattern within a downwards trend begins with four declining black candles where the last one is an 'inverted hammer'. The following long white candle opens with a gap above the fourth candle and closes near the candle high - a clear signal for a bullish (rising prices) reversal Page 18 7. Definitions: Trading strategies Expansion Breakout In this trading strategy by Jeff Cooper, the underlying asset is bought just above the high of the previous day after a 40-candle high was achieved with the previous candle and the current trading range exceeds the low to high of the last nine candles. A 1% gap to the current low functions as the stop-loss. Expansion Breakdown In this trading strategy by Jeff Cooper, underlying asset is short sold just below the low of the previous day after a 40-candle low was achieved with the previous candle and the current trading range exceeds the high to low of the last nine candles. A 1% gap to the current high functions as the stop-loss. Expansion Pivot Long In this trading strategy by Jeff Cooper, the underlying asset is bought just above the high of the previous candle after on one hand the trading span of the last 9 candles was exceeded and on the other hand a moving 50-day upward average was achieved on the previous day. A 1% gap to the current low functions as the stop-loss. Expansion Pivot Short In this trading strategy by Jeff Cooper, the underlying asset is short sold just below the low of the previous candle after a 40-candle low was achieved with the previous candle and the current trading range exceeds the high to low of the last 9 candles. A 1% gap to the current high functions as the stop-loss. Lizard Day Long In this trading strategy by Jeff Cooper, the underlying asset is bought just above the high of the previous candle after a 10-candle low developed on the previous day, however the price subsequently moved upwards and closed in the upper quarter of the candle. A 1% gap to the current low functions as the stop-loss. Lizard Day Short In this trading strategy by Jeff Cooper, the underlying asset is short sold just below the low of the previous candle after a 10-candle high developed on the previous day, however the price fell subsequently and closed in the bottom candle quarter. A 1% gap to the current high functions as the stop-loss. Page 19 8. Definitions: Price-specific chart patterns Short-term EMA Cross In this trading strategy a signal is generated by an exponential moving average EMA with a period length of 12 crossing a short-term EMA of the length 20. Depending on the direction of the cross a long or short signal is generated. Medium-term EMA Cross In this trading strategy a signal is generated by an exponential moving average EMA with a period length of 20 crossing a medium-term EMA of the length 50. Depending on the direction of the cross a long or short signal is generated. Long-term EMA Cross In this trading strategy a signal is generated by an exponential moving average EMA with a period length of 50 crossing a long-term EMA of the length 200. Depending on the direction of the cross a long or short signal is generated. MACD Standard Cross In this trading strategy the MACD indicator is crossed in its standard settings 12.26 by a signal line and depending on the direction of the cross, a long or short signal is generated MACD Fast Cross In this trading strategy the MACD indicator is crossed in a very short-term close market setting of 8.13 by a signal line and depending on the direction of the cut, a long or short signal is generated. Page 20 9. Specific examples: this is how it works a) Ascending Triangle in Gold 1st step: the signal is detected UBS KeyInvest TrendRadar has detected the chart pattern 'ascending triangle' in the gold price chart and generated a corresponding signal. 2nd step: the signal in detail The most important information about this signal can be found in the signal detail. To see all the information and details about this signal simply click on the chart. The following can now be seen: Figure 7: Signal-Detail Gold The gold price formed a so-called ascending triangle betweeb 16.02.2012 to 20.02.2012. This chart pattern normally occurs during an upward trend and indicates its continuation. At the same time the rise of the underlying asset, in this case gold, is limited by a horizontal resistance line. In the example this is at the level of 1,736.05 USD and forms the top side of the ascending triangle. At this level there are more sell orders than buy orders in the market for a short time, meaning that the price cannot rise further for the time being. In contrast the bottom side of the ascending triangle is characterised by several higher lows. This pattern builds when there are no further sales orders at this price and an increase in buying interest at the same time with slightly declining prices. It can therefore be assumed that the market is in a positive mood for a further increase in the price and will use the short-term drops in the price as entry points. Page 21 In the example above, this is observed at the low of 1,705.70 USD on the16.02.2012 and at the low of 1,717.25 USD on the 17.02.2012. Therefore, while the top side is limited by a clear resistance level, increasing buying pressure is building up from below. If the top limit line and its price are crossed it can be assumed that there will be a simultaneous flood of buy orders and closing of short positions, which together trigger a further dynamic rise. By implication, the breakout above the top resistance provides a technical chart signal, which implies the continuation of the upward trend. The price targets which arise from the development of the formation are calculated based on the maximum trading range which the ascending triangle demonstrates. In our example this is a range of 30.35 USD between the low at 1,705.70 USD and the high at 1,736.05 USD. If this range is now copied to the upper limit you will get the target price based on the full potential of the given chart pattern. On the other hand, the price target level 1 at 1,754.30 USD arises from the range of the resistance to the higher interim low on the 17.02.2012 at 1,717.25 USD. Other price targets entered relate to the upwards trend preceding the formation. 3rd step: finding a compatible product The UBS KeyInvest Trend Radar Report is available to you as a clear document summarising all of the important information relating to the signal: the chart pattern concerned, the time of the signal and important technical chart markers. The UBS products that are compatible with the signal are listed under the signal information. They are subdivided into the two risk categories: leverage and participation. This gives you the opportunity to select a compatible product according to your personal risk tolerance. They range from UBS PERLES, i.e. products with underlying asset 1:1, to warrants, turbo warrants and mini futures, in which you can participate with leverage to the price development of the underlying asset. You will find further information about opportunities and risks of the products on the relevant term sheet or under "Learn and Inform" on the UBS KeyInvest homepage (www.ubs.com/keyinvest). The KeyInvest TrendRadar Report always relates to the time it was called up and can be saved as a PDF, printed or forwarded. A click on the securities number brings you automatically to the relevant UBS KeyInvest product details page. Hints: • • • Save the chart pattern using 'Save Trend Signal' so that you can follow its future development at any time under 'My Trend Signals'. If you are interested in other chart patterns for gold, save the underlying asset using 'Save Underlying Asset' and you will always have a current overview of all detected price signals for gold under 'My Underlying Assets'. Save or print the KeyInvest TrendRadar Report – then you will always have a retrievable history of the price signal at the time of the breakout. 4th step: trade and watch If you would like to invest in a product, please contact your UBS customer advisor or your bank. All products can be traded on the Swiss Exchange - Scoach. Watch out for the stop-loss level! The stop-loss level is an instrument, which helps manage risks. Should this value be undercut it may be assumed that the price target levels 1 and 2 can no longer be achieved. The stop-loss recommendation Page 22 relates to the price of the underlying asset, at which the investor should consider closing open positions. With the 'Professional' version you can set the stop-loss level with the help of the alert function by yourself. If it is reached an acoustic signal sounds and a message appears. This function will also be available for you by SMS or email in the future. The UBS KeyInvest Team wishes you luck with your stock exchange transactions! More hints: • • • • • Under 'Most popular' in the left-hand menu bar on the homepage you will see which signals other users are currently most interested in Subscribe to our free 'KeyInvest Daily Markets' newsletter, in which two underlying assets are analysed in detail from a technical chart point of view on every trading day (www.ubs.com/keyinvestdaily-markets) You will find more helpful explanations in the TrendRadar Online Manual under the heading 'Info and Learning (top menu bar) Here you will find a short introductory video about the KeyInvest TrendRadar, webinars, information about roadshows and events, etc. Like all the other contents of the KeyInvest TrendRadar, the film is available in English, French and German. Use our wide range of information and tools for investors and traders at www.ubs.com/keyinvest b) Trend Channel in Actelion 1st step: the signal is detected UBS KeyInvest TrendRadar has found the chart pattern 'trend channel' in the price of Actelion and generated a corresponding signal. 2nd step: the signal in detail You will already find the most important information about this signal in the signal list. To see all the information and details about this signal simply click on the chart. The following can now be seen: Page 23 Figure 8: Signal-Detail Actelion In chart technology a trend channel is a geometrical shape, which incorporates the classic action of an upward or downward trend thus making it easier to see. The upward trend channel, in our example for the price action of Actelion shares starting from 12.03, is constructed by connecting consecutive higher lows with a straight line. This signals the slightly rising price range, below which no market participants are prepared to sell shares any longer during the course of the trend. This straight line is now parallelprojected by a high on the opposite side. The action between the trendlines, which is determined by strong upward movements and corrections, is thus contained. If one of these trend channels lines is crossed or undercut, a trading signal occurs, since the original trading range was left at the same time. In the selected example this occurred on 21.03 with a downward breakout to the level of 35.61 CHF. Following this sell signal the price fell almost unchecked on 22.03 to the first price target level at 34.74 CHF, which was attained exactly. This price target arises from the width of the trend channel's range from the breakout point at 35.61 CHF being transferred downward. The double trading range of the channel occurs similarly to the second price target at 33.98 CHF. 3rd step: finding a compatible product The UBS KeyInvest Trend Radar Report is available to you as a clear document summarising all of the important information relating to the signal: the chart pattern concerned, the time of the signal and important technical chart markers. The UBS products that are compatible with the signal are listed under the signal information. They are subdivided into the two risk categories: leverage and participation. This gives you the opportunity to select a compatible product according to your personal risk tolerance. They range from UBS PERLES, i.e. products with underlying asset 1:1, to warrants, turbo warrants and mini futures, in which you can participate with leverage to the price development of the underlying asset. You will find further information about opportunities and risks of the products on the relevant term sheet or under "Learn and Inform" on the UBS KeyInvest homepage (www.ubs.com/keyinvest). Page 24 The KeyInvest TrendRadar Report always relates to the time it was called up and can be saved as a PDF, printed or forwarded. A click on the securities number brings you automatically to the relevant UBS KeyInvest product details page. Hints: • • • Save the chart pattern using 'Save Trend Signal' so that you can follow its future development at any time under 'My Trend Signals'. If you are interested in other chart patterns for gold, save the underlying asset using 'Save Underlying Asset' and you will always have a current overview of all detected price signals for gold under 'My Underlying Assets'. Save or print the KeyInvest TrendRadar Report – then you will always have a retrievable history of the price signal at the time of the breakout. 4th step: trade and observe If you would like to invest in a product, please contact your UBS customer advisor or your bank. All products can be traded on the Swiss Exchange - Scoach. Watch out for the stop-loss level! The stop-loss level is an instrument, which helps manage risks. Should this value be undercut it may be assumed that the price target levels 1 and 2 can no longer be achieved. The stop-loss recommendation relates to the price of the underlying asset, at which the investor should consider closing open positions. With the 'Professional' version you can set the stop-loss level with the help of the alert function by yourself. If it is reached an acoustic signal sounds and a message appears. This function will also be available for you by SMS or email in the future. More hints: • • • • • Under 'Most popular' in the left-hand menu bar on the homepage you will see which signals other users are currently most interested in Subscribe to our free 'KeyInvest Daily Markets' newsletter, in which two underlying assets are analysed in detail from a technical chart point of view on every trading day (www.ubs.com/keyinvestdaily-markets) You will find more helpful explanations in the TrendRadar Online Manual under the heading 'Info and Learning (top menu bar) Here you will find a short introductory video about the KeyInvest TrendRadar, webinars, information about roadshows and events, etc. Like all the other contents of the KeyInvest TrendRadar the film is available in English, French and German. Use our wide range of information and tools for investors and traders at www.ubs.com/keyinvest The UBS KeyInvest Team wishes you luck with your stock exchange transactions! c) Head and Shoulders Formation (HS) in Aurubis 1st step: the signal is detected UBS KeyInvest TrendRadar has found the chart pattern 'head and shoulders' in the price of Aurubis and generated a corresponding signal. 2. Schritt: Das Signal im Detail Page 25 You will already find the most important information about this signal in the signal list. To see all the information and details about this signal simply click on the chart. The following can now be seen: Figure 8: Signal-Detail Aurubis In chart technology, a reversal formation, i.e. a development in the price action, which ends an existing trend and establishes a new trend in the opposite direction, is described as a head and shoulders formation (HS in short). Ideally in an HS an absolute high (head) is framed by two lower high points to the left (left shoulder) and to the right (right shoulder) of the head. The breakout above the line connecting the lows between the so-called shoulders provides the sell signal in this case and signals a reversal. In our example, the Aurubis shares have been in an upward trend since the low at EUR 40.30. This initially led to a high at EUR 44.45 on 02.02.2012, the left shoulder of the HS. Subsequently there was a consolidation, followed by a further upward movement to EUR 45.50, which formed the so-called head of the formation. At this point the upward trend ended and profit takings allowed the price to fall back to EUR 42.77. Then new buyers entered the market, however it was not possible to develop another high. The right shoulder formed at EUR 44.23. Followed by a volatile lateral movement, the shares undercut the neckline at EUR 43.00 through a downwards gap on 02.03.2012, thus completing the HS formation and generating a sell signal. This was then followed by the expected downward movement, which allowed the shares above the price target level 1 at EUR 40.55 to fall to the price target level 2 at EUR 39.61. 3rd step: finding a compatible product The UBS KeyInvest Trend Radar Report is available to you as a clear document summarising all of the important information relating to the signal: the chart pattern concerned, the time of the signal and important technical chart markers. Page 26 The UBS products that are compatible with the signal are listed under the signal information. They are subdivided into the two risk categories: leverage and participation. This gives you the opportunity to select a compatible product according to your personal risk tolerance. They range from UBS PERLES, i.e. products with underlying asset 1:1, to warrants, turbo warrants and mini futures, in which you can participate with leverage to the price development of the underlying asset. You will find further information about opportunities and risks of the products on the relevant term sheet or under "Learn and Inform" on the UBS KeyInvest homepage (www.ubs.com/keyinvest). The KeyInvest TrendRadar Report always relates to the time it was called up and can be saved as a PDF, printed or forwarded. A click on the securities number brings you automatically to the relevant UBS KeyInvest product details page. Hints: • • • Save the chart pattern using 'Save Trend Signal' so that you can follow its future development at any time under 'My Trend Signals'. If you are interested in other chart patterns for gold, save the underlying asset using 'Save Underlying Asset' and you will always have a current overview of all detected price signals for gold under 'My Underlying Assets'. Save or print the KeyInvest TrendRadar Report – then you will always have a retrievable history of the price signal at the time of the breakout. 4th step : Handeln und Beobachten If you would like to invest in a product, please contact your UBS customer advisor or your bank. All products can be traded on the Swiss Exchange - Scoach. Watch out for the stop-loss level! The stop-loss level is an instrument, which helps manage risks. Should this value be undercut it may be assumed that the price target levels 1 and 2 can no longer be achieved. The stop-loss recommendation relates to the price of the underlying asset, at which the investor should consider closing open positions. With the 'Professional' version you can set the stop-loss level with the help of the alert function by yourself. If it is reached an acoustic signal sounds and a message appears. This function will also be available for you by SMS or email in the future. The UBS KeyInvest Team wishes you luck with your stock exchange transactions! More hints: • • • • • Under 'Most popular' in the left-hand menu bar on the homepage you will see which signals other users are currently most interested in Subscribe to our free 'KeyInvest Daily Markets' newsletter, in which two underlying assets are analysed in detail from a technical chart point of view on every trading day (www.ubs.com/keyinvestdaily-markets) You will find more helpful explanations in the TrendRadar Online Manual under the heading 'Info and Learning (top menu bar) Here you will find a short introductory video about the KeyInvest TrendRadar, webinars, information about roadshows and events, etc. Like all the other contents of the KeyInvest TrendRadar the film is available in English, French and German. Use our wide range of information and tools for investors and traders at www.ubs.com/keyinvest Page 27 10. Disclaimer This handbook has been prepared by UBS AG in co-operation with BörseGo AG. This handbook is not prepared for the needs of any specific recipient. It is published solely for information and is not a solicitation or offer to buy or sell any securities or related financial instruments (“Instruments”). UBS makes no representation or warranty, either express or implied, on the completeness or reliability of the information contained in this document (“Information”) except that concerning UBS AG and its affiliates. The Information should not be regarded by recipients as a substitute for using their own judgment. Any opinions expressed in this material may change without notice and may be contrary to opinions expressed by other business areas of UBS as a result of using different assumptions or criteria. UBS is under no obligation to update the Information. Neither UBS nor any of its affiliates, or their officers or employees, accepts any liability for any loss arising from use of the Information. UBS specifically prohibits the redistribution or reproduction of this material in whole or in part without the written permission of UBS and UBS accepts no liability whatsoever for the actions of third parties in this respect. © UBS 2012. The Key symbol and UBS are among the registered and unregistered trademarks of UBS. All rights reserved. Page 28