1
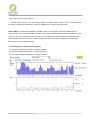
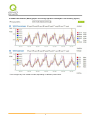
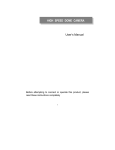
QRTG
User Manual
1
QRTG (Qno Router Traffic Grapher)
QRTG utilizes dynamic GUI and simple statistic to display system status of Qno Firewall/ Router
presently, including CPU Utilization(%), Memory Utilization(%), Session and WAN Traffic.
Enable QRTG: The funcation is disabled by default. When you are going to enable the QRTG function,
system will pop-up a warning massage to remind you this function will be enabled, which may influence router
efficiency. You can use drop down menu to select current status that including statistic and graphics of the
following items when this function is enabled. System will refresh the statistic and graphics to latest data
timing when you click “Refresh” button.
I. CPU Usage (As in the the following figure)
(1) CPU Hours Usage Rate graphic / average/ maximum
(2) CPU Days Usage Rate graphic / average/ maximum
(3) CPU, Week Usage Rate graphic / average/ maximum
2
II. WAN Traffic Statistic (hourly) graphic and average (up/down stream) (As in the following figures)
3
* The UI might vary from model to model, depending on different product lines.
4
III. WAN Traffic Statistic (Day) graphic and average (up/down stream)(As in the following figures)
* The UI might vary from model to model, depending on different product lines.
5
IV. WAN Traffic Statistic (Week) graphic and average (up/down stream)(As in the following figures)
* The UI might vary from model to model, depending on different product lines.
6