1
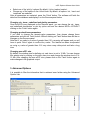
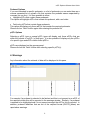
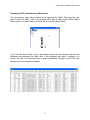
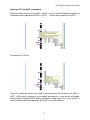
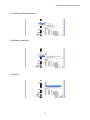
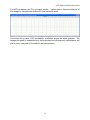
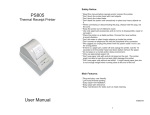
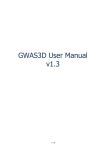
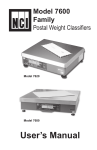
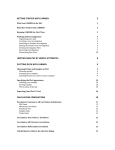
eQTL Explorer Software
USER GUIDE
Version 4.0
September 2005
© 2005, MRC
eQTL Explorer Software User Guide
1. Logging In
When eQTL Explorer is launched you are presented with the following login window:
By default the guest login details appear in the window. Click ‘connect’ or press ‘enter’
to start the database connection.
2. The Main Screen
When eQTL Explorer has loaded and retrieved experiment information from the
database you will be presented with the main screen, from which you can fetch the
detailed information.
How to fetch data
• Choose an experiment from the drop down list.
• Click on the tissue(s) you are interested in. If you wish to visualise eQTL information
for all tissues, click and drag on all tissue rows under the ‘QTL reaper analysis’
heading. Choose the value of the max eQTL size.
• By default, the p-value is 1.0E-4. You can change the p-value to any number
between 0 to1.
2.
eQTL Explorer Software User Guide
•
•
Select one of the ‘plot by’ options. By default, it is by ‘marker location’.
Choose any of the options in the ‘show’ block. By default, all options ‘cis’, ‘trans’ and
‘undefined’ are selected.
After all parameters are selected, press the ‘Fetch’ button. The software will fetch the
data from the database and display it on the Genome panel below.
Changing cis-, trans-, undefined and plot-by parameters
Once the eQTLs are displayed on the Genome panel, you can change the cis-, transand undefined checkboxes or plot by option and see the desired eQTLs WITHOUT
clicking on the ‘Fetch’ button again.
Changing p-value/tissue parameters
If you wish to change the tissue/p-value parameters, then please change these
parameters and click on ‘Fetch’ button. Without clicking on ‘Fetch’ button there will be no
changes on the Genome panel.
Note that if you select a p-value of greater than 0.01 a warning will appear and you will
have to press ‘Fetch’ again to confirm the p value. This feature has been incorporated
as using a p value of greater than 0.01 may return many data points and take a long
time.
Changing max eQTL size
By default, the window size for defining cis- and trans- is set to 10 Mb. You can change
this window size by clicking on the drop down icon and change the window size to 5 or
15 Mb. After changing the max eQTL size, please click on the ‘Fetch’ button again to
make changes in the graphical output.
3. Advanced Options
It is possible to filter the information that is retrieved even further using the ‘Advanced
Options’ tab.
3.
eQTL Explorer Software User Guide
Probeset Options
If you are interested in specific probesets, or a list of probesets you can enter them as a
comma separated list or upload a file that contains the probeset names separated by
commas (on one line). It is then possible to either:
• Highlight eQTLs that contain these probesets
This option will highlight eQTLs that contain this probeset, with a red circle.
• Fetch only eQTLs that contain these probesets
This option will display only those eQTLs that contain the required probesets.
Please click on ‘Fetch’ button again after entering the probeset list.
pQTL Options
Selecting a pQTL type or several pQTL types will display only those eQTLs that are
within the bounds of a pQTL (of that type). It is also possible to display only the pQTLs
of a specific type and eQTLs within those pQTLs.
pQTLs are displayed on the genome panel.
Please click on the ‘Fetch’ button after selecting specific pQTL(s).
4. Warnings
Any information about the retrieval of data will be displayed in this pane.
For example if a probeset is selected to be fetched and this is not present in an eQTL of
the required criteria this will be reported in the warnings window. Similarly, if a probeset
is entered to be highlighted and it is not present amongst the eQTLs, this is reported. In
addition, probeset identifiers that are not of the required format (DIGITS_letters) are
reported as warnings.
4.
eQTL Explorer Software User Guide
An example of the warnings display.
5. Export
The export tab gives the option to export information from particular chromosomes, all
chromosomes or specific chromosome regions.
As with the Fetch on the Main Page:
• Choose an experiment from the drop down list.
• Click on the tissue you are interested in. If you wish to visualise eQTL information for
all three tissues, click and drag on all three tissue rows under the ‘QTL reaper
analysis’ heading. (Figure 1). Choose the value of the max eQTL size.
• By default, the p-value is 1.0E-4. You can change the p-value to any number
between 0 to1.
• Select one of the ‘plot by’ options. By default, it is by ‘marker location’.
• Choose any of the options in the ‘show’ block. By default, all options ‘cis’, ‘trans’ and
‘undefined’ are selected.
• You can select a single chromosome, or multiple chromosomes (using CTRL+click)
or the ALL option which is at the end of the list.
• It is also possible to select a specific bp region for one chromosome (or the same
region on several/all chromosomes).
5.
eQTL Explorer Software User Guide
•
By default all columns will be exported but it is possible to select which columns you
want to be written to the file. Selection is in a similar manner to the chromosomes.
After all parameters are selected, press the ‘Export’ button. The software will ask you for
an output file, with the usual file request box. The data will then be fetched from the
database and written to the file.
Menu Bar
Selecting the file menu, it is possible to export a jpeg image of the genome panel (at
96dpi) or exit the program. The display menu can be used to select the number of
columns in the Genome Panel, from 1 chromosome to 5 chromosomes wide, in order to
visualize large clusters of eQTLs more easily. From the help menu it is possible to
access a simplified help document and information about the program.
6. The Genome Panel
Once the data have been fetched, you are presented with a display of eQTLs and
pQTLs on the Genome Panel. This panel displays all the chromosomes in 3 columns.
You can scroll through the chromosomes by using the scrollbar on the right hand side of
the panel. Each chromosome is one chromosome panel demarcated by black boundary
line.
eQTLs in each row are ordered by their p-value. The eQTL with the lowest p-value is
nearest to the chromosome.
At certain p-values, the number of eQTLs is so large at a particular locus that they reach
the extreme left of the boundary of the chromosome panel.
6.
eQTL Explorer Software User Guide
Please click on a particular chromosome to zoom in and visualize all the eQTLs and
their information.
The number of eQTLs fetched for each analysis (tissue-type) is displayed in the
information bar at the bottom of the genome panel.
7. Chromosome Panels
The chromosome panel is a detailed view of a chromosome.
If the eQTLs appear to reach the extreme left boundary of the chromosome panel,
please click on the chromosome anywhere within the black boundary to zoom in that
chromosome. You can scroll towards the left using the scroll bar provided on the bottom
of the chromosome panel.
Zooming in a particular chromosome minimizes the main window of the software. After
closing the zoomed chromosome panel, you will have to restore the main software
window.
There is a slider provided on the right side of the chromosome panel and dragging the
slider upwards will zoom-in the chromosome further along its y-axis.
7.
eQTL Explorer Software User Guide
Visualising eQTL information in table format
The chromosome panel has an option in the menu-bar as ‘Table’. There are two submenus under this option. One is to visualise eQTL data in table format (Show Table).
Other option is to import data in an Excel file to local disk (Save Table).
If you click the ‘Show Table’ option, the software imports all the relevant data from the
database and populates the table. After it has populated the table, it displays it on
screen. The last 4 columns have links to external database. Clicking on any of the cells
will take you to the respective website.
8.
eQTL Explorer Software User Guide
Viewing eQTL and pQTL annotations
Place the mouse cursor over the eQTL or pQTL. A tool tip text box will appear displaying
information about that particular eQTL or pQTL. Here is the information for eQTLs:
And similarly, for pQTLs:
The links to external sources of information are accessed by left-clicking on the eQTL or
pQTL. eQTLs link to information for probesets and markers. A pop-up box will appear
having links to Ensembl/ RGD/ Entrez databases. Please select any of the options to
view information about that particular eQTL/pQTL from the database.
9.
eQTL Explorer Software User Guide
For eQTLs probeset information:
And Marker information:
For pQTLs:
10.
eQTL Explorer Software User Guide
For eQTL probesets, the “Plot qtl reaper results…” option gives a Genome-wide plot of
the linkage for that particular probeset in that particular tissue.
This shows the p-value, LRS and additive coefficient across the whole genome. The
linkage plot panel is subdivided into chromosomes and clicking each chromosome will
give a zoom-view panel of the data for that chromosome.
11.
eQTL Explorer Software User Guide
8. Troubleshooting
a. I clicked on the option ‘Show Table’ and the table does not appear.
Please be patient. The software extracts all the information from the database and
populates the table. The number of eQTLs it has to fetch governs the time it will take to
populate the table.
b. I clicked on ‘Fetch’ button and it appears that the software is not doing
anything.
It depends on the internet speed, amount of data to be fetched from the database and
number of people using this database at the same time. If it takes a lot of time, please
close the application and re-run it.
c. I closed the zoomed image of the chromosome and when I maximize the
main window of the software, the images don’t appear.
There is probably less of graphics memory. Please click on ‘File’ menu button to refresh
the main window.
d. I click on 'Fetch' button and I don’t see all the pQTLs or eQTLs?
It is probably because the text field in the advanced options is not clear and still has a
list of Affymetrix probeset ids. Similarly, some of the pQTLs may be selected in the
previous 'Fetch'. Click on the 'Reset' button to deselect the entire pQTLs list and click on
'Fetch' again.
9. Additional Information
Please contact [email protected] for any problems or suggestions.
System Requirements
Minimum system requirements are 256Mb RAM and the ability to run Java 1.4.2.
The software has been tested on Windows XP, Linux 2.4+ and Mac OS X.
Licence
The eQTL Explorer software is distributed under the GNU Public Licence. It is freely
available for non-commercial use.
Disclaimer
eQTL Explorer is distributed in the hope that it will be useful but WITHOUT ANY
WARRANTY; without even the implied warranty of MERCHANTABILITY or
FITNESS FOR A PARTICULAR PURPOSE. See the GNU General Public License
for more details.
12.