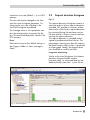
1
Series 373x
Electropneumatic Positioner
Type 373x-5
+
EXPERT
with FOUNDATION™ fieldbus communication
Fig. 1 · Valve diagnostics with TROVIS-VIEW Operator Interface
Operating Instructions
EB 8388-5 EN
Firmware version R 1.4x/K 1.2x
Edition August 2008
Contents
Contents
Page
1
1.1
1.2
1.3
1.3.1
1.3.2
1.4
1.5
1.6
1.7
1.7.1
1.8
Description. . . . . . . . . . . . . . . . . . . . . . . . . . . . . . . 4
General . . . . . . . . . . . . . . . . . . . . . . . . . . . . . . . . 4
Diagnostic functions . . . . . . . . . . . . . . . . . . . . . . . . . . 5
Activating EXPERT+ . . . . . . . . . . . . . . . . . . . . . . . . . . . 5
Activation with activation code . . . . . . . . . . . . . . . . . . . . . 5
Activation with USB dongle . . . . . . . . . . . . . . . . . . . . . . . 6
Actuator and valve specification data . . . . . . . . . . . . . . . . . . 7
Start the reference test . . . . . . . . . . . . . . . . . . . . . . . . . 7
Range of functions . . . . . . . . . . . . . . . . . . . . . . . . . . . 8
Activation, analysis and presentation of diagnostic data . . . . . . . . . 9
Printing the diagnostic log . . . . . . . . . . . . . . . . . . . . . . . 10
Exporting measured data . . . . . . . . . . . . . . . . . . . . . . . 11
2
2.1
2.2
2.3
2.4
2.5
2.5.1
2.5.2
2.6
Statistical information AUTO
Data logger . . . . . . . . .
Travel histogram . . . . . .
Setpoint deviation histogram.
Cycle counter histogram . . .
Drive signal diagram . . . .
Steady-state drive signal. . .
Hysteresis test (d5) . . . . .
End position trend. . . . . .
.
.
.
.
.
.
.
.
.
.
.
.
.
.
.
.
.
.
.
.
.
.
.
.
.
.
.
.
.
.
.
.
.
.
.
.
.
.
.
.
.
.
.
.
.
.
.
.
.
.
.
.
.
.
.
.
.
.
.
.
.
.
.
.
.
.
.
.
.
.
.
.
.
.
.
.
.
.
.
.
.
.
.
.
.
.
.
.
.
.
.
.
.
.
.
.
.
.
.
.
.
.
.
.
.
.
.
.
.
.
.
.
.
.
.
.
.
.
.
.
.
.
.
.
.
.
.
.
.
.
.
.
.
.
.
.
.
.
.
.
.
.
.
.
.
.
.
.
.
.
.
.
.
11
11
14
15
17
18
18
21
24
3
3.1
3.1.1
3.1.2
3.1.3
3.2
3.2.1
3.3
Tests in manual mode. . . . . . . . .
Tests MAN (d1 to d3) . . . . . . . . .
Drive signal diagram steady-state (d1) .
Drive signal diagram hysteresis (d2) . .
Static characteristic (d3) . . . . . . . .
Partial stroke test – PST (d4) . . . . . .
Step reponse . . . . . . . . . . . . .
Data logger . . . . . . . . . . . . . .
.
.
.
.
.
.
.
.
.
.
.
.
.
.
.
.
.
.
.
.
.
.
.
.
.
.
.
.
.
.
.
.
.
.
.
.
.
.
.
.
.
.
.
.
.
.
.
.
.
.
.
.
.
.
.
.
.
.
.
.
.
.
.
.
.
.
.
.
.
.
.
.
.
.
.
.
.
.
.
.
.
.
.
.
.
.
.
.
.
.
.
.
.
.
.
.
.
.
.
.
.
.
.
.
.
.
.
.
.
.
.
.
.
.
.
.
.
.
.
.
.
.
.
.
.
.
.
.
26
26
27
29
31
33
39
39
4
4.1
4.2
4.3
4.4
4.5
Diagnosis – Status alarms . . . .
Standard EXPERT alarms . . . .
Extended EXPERT+ alarms . . . .
Logging. . . . . . . . . . . . .
Condensed state . . . . . . . .
Classification of the status alarms
.
.
.
.
.
.
.
.
.
.
.
.
.
.
.
.
.
.
.
.
.
.
.
.
.
.
.
.
.
.
.
.
.
.
.
.
.
.
.
.
.
.
.
.
.
.
.
.
.
.
.
.
.
.
.
.
.
.
.
.
.
.
.
.
.
.
.
.
.
.
.
.
.
.
.
.
.
.
.
.
.
.
.
.
.
.
.
.
.
.
.
.
.
.
.
.
41
41
42
42
42
43
5
Resetting diagnosis parameters . . . . . . . . . . . . . . . . . . . . 45
2
EB 8388-5 EN
.
.
.
.
.
.
.
.
.
.
.
.
.
.
.
.
.
.
.
.
.
.
.
.
.
.
.
.
.
.
.
.
.
.
.
.
.
.
.
.
.
.
.
.
.
.
.
.
.
.
.
.
.
.
Contents
6
Diagnostic parameters saved in non-volatile memory . . . . . . . . . 48
7
Troubleshooting . . . . . . . . . . . . . . . . . . . . . . . . . . . 49
8
Starting partial stroke test manually. . . . . . . . . . . . . . . . . . 52
9
Code 49 in parameter list
. . . . . . . . . . . . . . . . . . . . . . 53
Note: These Operating Instructions EB 8388-5 EN are valid for:
Type 3730-5 Positioners with firmware version R 1.44/K 1.24 and higher
Type 3731-5 Positioners with firmware version R 1.45/K 1.25 and higher.
EB 8388-5 EN
3
Description
Note: The screen shots in these instructions
are used to illustrate the appearance of
TROVIS-VIEW. Certain details on screen
may differ.
1
Description
1.1
General
The Type 373x-5 Positioner in the EXPERT+
version with partial stroke testing (PST) is
based on the Type 373x-5 Positioner with
FOUNDATION™ fieldbus communication.
These instructions EB 8388-5 EN supplement the Mounting and Operating Instructions EB 8384-5 EN and EB 8387-5 EN.
Technical data, installation, electrical connection as well as operation and standard
valve diagnostics are described in the
Mounting and Operating Instructions:
Type 3730-5 → EB 8384-5 EN
Type 3731-5 → EB 8387-5 EN
Differences from standard positioner
EXPERT+ provides predictive, status-oriented
maintenance of pneumatic control valves. If
EXPERT+ is not activated, refer to section 1.3
on how to activate it.
EXPERT+ upgrades the standard EXPERT diagnostics firmware incorporated in the
positioner. The upgraded version provides
extended functions to pinpoint valve parameters that have worsened, allowing the user
to plan predictive maintenance and service
work before malfunctions can affect the process and may cause unscheduled plant shutdowns.
4
EB 8388-5 EN
Basics of EXPERT+
EXPERT+ records the valve faults in automatic mode while the process is running
and issues alarms on the required maintenance work. In addition, numerous tests can
be performed in manual mode to pinpoint
emerging faults.
The EXPERT+ diagnostics are completely integrated in the positioner. Data required for
diagnostics are automatically compiled and
saved in the positioner. These data are analyzed by the positioner, which generates
classified status alarms, providing information on the condition of the valve.
The diagnostics data, results and status
alarms are available over DD (Device Description).
Apart from the basic settings at the
positioner using the rotary pushbutton
,
the TROVIS-VIEW3 software allow the parameters to be viewed and set conveniently.
Note: All the parameter settings that are
changed over the operator interface must
also be downloaded onto the positioner to
allow them to become effective.
Description
1.2
Diagnostic functions
There are two main groups of diagnostic
functions available.
Statistical information AUTO
(in-service monitoring)
4 Data logger
4 Histograms
4 Drive signal diagram
4 Drive signal diagram steady-state
4 Drive signal diagram hysteresis
4 End position trending
These tests are performed while the process
is running (automatic mode) without disrupting the process.
Activated tests are automatically performed
when they are triggered by their start condition (e.g. data logger and drive signal diagram hysteresis).
Other tests are already performed in the
background without being activated (e.g.
histograms, cycle counter, drive signal diagram steady-state and end position
trending).
Tests MAN
(out-of-service diagnostics)
4 Drive signal diagram steady-state
4 Drive signal diagram hysteresis
4 Static characteristic
4 Partial stroke test (PST)
4 Additionally, the data logger from statis-
tical information AUTO can be started in
the manual mode.
These MAN tests must not be performed in
closed-loop operation as the positioner can-
not follow the reference variable while performing these tests.
The valve is moved to a certain position defined by the test settings and the valve may
move through its full working range.
1.3
+
Activating EXPERT
The extended EXPERT+ diagnostics can be
activated later at the positioner when
EXPERT+ is not already activated on delivery
of the positioner. The required activation
code or an EXPERT+ USB dongle can be
purchased to activate EXPERT+.
1.3.1 Activation with activation
code
The activation code can be ordered (order
number 1400-9318) from SAMSON. On
ordering this option, specify the serial number of the positioner.
EXPERT+ is activated directly at the
positioner.
Activation of EXPERT+
Enable configuration at the positioner:
Turn
→ Code 3, press
turn
→ ON, press
,
.
After enabling configuration:
Turn
→ Code 48, press
Code 48 blinks.
EB 8388-5 EN
5
Description
1.3.2 Activation with USB dongle
Turn
to select d, press
turn
to select d8, press
,
.
d8 blinks.
Fig. 2 · EXPERT+ USB dongle (order no. 1400-9555)
Turn
and set the activation code XXXX.
Press
to confirm the entered code.
The EXPERT+ USB dongle can be ordered for
the required number of activations (order
no. 1400-9555).
To activate EXPERT+, the TROVIS-VIEW3
software (firmware 3.30 and higher) is required for the positioner:
Type 3730-5 → Order no. 6661-1058
Type 3731-5 → Order no. 6661-1065
Activation of EXPERT+
After the activation has been successfully
completed, yES appears on the display.
Note: On entering the wrong activation
code, the display returns to Code 0. The activation of EXPERT+ has been unsuccessful.
After an incorrect activation code has been
entered three times, Err appears on the display after selecting Code 48 and d8. An activation code can only be entered again after the positioner has been reset to its default settings (Code 36).
6
EB 8388-5 EN
1. Switch on the computer.
2. Insert the EXPERT+ USB dongle into a
free USB port of the computer.
3. Connect the positioner to the computer
over the serial interface adapter.
4. Start TROVIS-VIEW for Type 373x-3
Positioner.
5. In offline mode, select EXPERT+ activation from the Device menu and follow
the prompts.
Description
1.4
Actuator and valve
specification data
To correctly analyze the diagnostic data,
several actuator and valve specifications
need to be entered for the EXPERT+ diagnostics.
Enter the required data in the Identification
folder (> Positioner (AO, TRD) > Actuator)
as well as (> Positioner (AO, TRD) > Valve).
Download the data to the positioner.
The Model and Booster parameters in the
Actuator folder and Stuffing box parameter
in the Valve folder need to be entered.
Set the positioner to
Turn
→ Code 0, press
Code 0 blinks.
Turn
→ MAN, press
moves to manual mode.
These parameters do not need to be
changed if the control valve also has these
default settings.
1.5
Start the reference test
EXPERT+
,
, the positioner
Manual operating mode
The default settings of these parameters are:
4 Model = Single-acting
4 Booster = Not present
4 Stuffing box = Self-adjusting
manual mode:
%
You can activate the reference test either by
selecting the Diagnosis folder (> Start reference test) and right-click the parameter to
select Execute, or, alternatively, start the reference test at the positioner itself by selecting Code 48 as follows:
Enable configuration at the positioner:
After
has been activated properly,
the reference graphs for future diagnostic
purposes need to be plotted to allow the diagnostics to function in its full scope.
Turn
→ Code 3,
turn
→ ON, press
The reference graphs are plotted automatically after the positioner has been initialized
when the EXPERT+ has been activated (e.g.
supplied with EXPERT+ already activated).
On activating EXPERT+ at later time, the reference graphs are plotted after the
positioner is re-initialized.
If the reference graph plotting is to be
started separately in an initialized positioner
or replotted, proceed as follows:
Turn
.
After enabling configuration:
→ Code 48, press
,
Code 48 blinks.
Turn
until d appears, press
,
EB 8388-5 EN
7
Description
to select d7, press
turn
.
d7 blinks.
The positioner can also function properly after it has been initialized successfully without
the reference data.
1.6
→ yES,
Turn
press
to start the reference test.
CAUTION!
The control valve moves through its travel
range during the reference test.
The following points need to be observed
when the positioner is started up in the SUB
mode (substitute calibration) or when a double-acting actuator and/or booster is used:
Start-up of the positioner in SUB mode
(substitute calibration), without
initialization:
4 A reference test cannot be started.
4 The start of all tests (Tests MAN) in one
The tests d1 (drive signal diagram
steady-state) and d2 (drive signal diagram
hysteresis) are performed during the diagnostic reference test.
During the reference test, tESt and d1 or
d2 appear in alternating sequence on the
positioner display.
The measured data are used as reference
data and any existing reference graphs are
overwritten.
If the reference graphs could not be plotted
correctly or are incomplete, this information
is saved under Code 81 (which can be assigned to a classification, refer to section
4.5) in a non-volatile memory.
4
On canceling the reference test which was
started in manual mode, the positioner remains in the manual mode.
4
On canceling a reference test automatically
performed directly after initialization, the
positioner changes to the automatic mode.
8
EB 8388-5 EN
Range of functions
4
sweep is not possible.
The Drive signal diagram steady-state
and Drive signal diagram hysteresis for
both Statistical information and Tests
cannot be started.
Activating the partial stroke testing with
cancelation conditions is not recommended.
Double-acting actuator with reversing amplifier:
4 A reference test cannot be started.
4 The Drive signal diagram steady-state
and Drive signal diagram hysteresis for
both Statistical information and Tests
cannot be started.
Activating the partial stroke testing with
cancelation conditions is not recommended.
Description
Booster:
4 The Drive signal diagram steady-state
4
4
and Drive signal diagram hysteresis for
Statistical information are not performed
nor analyzed.
Depending on the hystersis of the
booster, the reference graph of Drive
signal diagram hysteresis (d2) (Test) cannot be plotted.
During the partial stroke test, larger
overshoots can occur if a booster is used.
As a result, the default settings of the x
control value and PST tolerance band
parameters must be changed correspondingly.
Note: Code 81 is set if the reference graphs
could not be plotted or are incomplete.
1.7
Activation, analysis and
presentation of diagnostic
data
All diagnostic functions which do not compile data automatically in the background
(data logger, drive signal diagram hysteresis, tests MAN) must be activated to start
them.
Note: To activate the tests MAN in manual
mode, the positioner must be first set over
Code 0 to
manual mode.
Canceling diagnostic functions
There are two ways to cancel an active test:
4 In the TROVIS-VIEW operator interface,
4
select Stop test in the corresponding
folder to cancel the test. The positioner
then moves to the previously set operating mode and to the travel value previously set (manual mode) or returns to the
reference variable (automatic mode).
Press the rotary pushbutton once to cancel the tests MAN
d1 (drive signal diagram steady-state)
d2 (drive signal diagram hysteresis)
d3 (static characteristic)
d4 (partial stroke test)
and the test in statistical information
AUTO
d5 (drive signal diagram hysteresis)
as well as the reference test in Code 48.
On canceling a test (d1 to d4), the
positioner moves to the operating mode previously set. The positioner goes into automatic mode on canceling test d5 from statistical information AUTO.
The reference graphs must be plotted before
the tests for drive signal diagrams
steady-state and hysteresis in the manual
mode can be analyzed.
Note: The analysis of raw data in automatic
mode is started after the positioner has been
in closed-loop operation for over one hour
(after initialization).
This does not apply to the end position trend
test and the dynamic stress factor in the cycle counter histogram as their analysis starts
directly after closed-loop operation begins.
EB 8388-5 EN
9
Description
Alarms generated from the tests MAN are
marked TEST.
If the electrical auxiliary power is too low,
the test being performed is ended and the
positioner moves to the operating mode
previously set.
Upon failure of the auxiliary power, tests in
tests MAN and statistical information AUTO
must be restarted due reasons of safety.
However, the drive signal diagram hysteresis test from statistical information AUTO
and the partial stroke test (PST) remain activated.
In the event that the solenoid valve is triggered (Type 3730-5) or the forced venting is
activated (Type 3731-5), active tests are
stopped and the positioner changes to the
fail-safe position.
1.7.1 Printing the diagnostic log
The Print command allows you to print out a
diagnostic log of individual tests or the entire diagnosis.
The diagnostic log includes a title page and
a list of all the data points including all their
values and properties.
The title page contains all key information
for clear identification of the printed log (device type, file name, time and date of creation, time and date of the last change and
TROVIS-VIEW version).
Select Print in the File menu to add further
information.
1. In the File menu, select Print Options to
choose the scope of the diagnostic log.
After installing/updating the
TROVIS-VIEW software, customer data
10
EB 8388-5 EN
(Customer data in the Edit menu) and
summary (table of contents) are listed in
the diagnostic log by default.
Check the check boxes for the Comments
and Graphics options to add these options to the diagnostic log.
2. Right-click the Diagnosis folder or the required subfolder and select Print from
the context-sensitive menu to print the diagnostic log.
The printout contains the contents of the
folder and its subfolders.
Statistical information AUTO
1.8
Exporting measured data
2
Statistical information AUTO
You can export the measured data compiled
from tests and statistical information in a file
(csv, xml or xls).
1.
2.
3.
4.
The signals x, w and y need to be analyzed
on a more precise basis to obtain advanced
diagnostic information also over the valve,
actuator and pneumatic air supply. The
Open the Tests or Statistical information
positioner compiles raw data for this purfolder you require.
pose.
Click
button located below the graph on The signals are plotted, stored and analyzed
the right-hand side to switch to a table
while the process is running. In addition, an
of the measured data.
additional underlying hysteresis test detects
any changes in friction.
Click
button to export the data.
Save the data in a file, selecting the file
type and name as required.
2.1 Data logger
Fig. 3
The data logger allows the reference variable w, valve position x in relation to the
operating range, drive signal y and setpoint
deviation e to be plotted over time.
The measured data are saved in a FIFO
memory with a capacity to save 100 data
points in the positioner.
5. Click
button to return the graph of the
measured data.
The data logger is completely integrated into
the positioner. The software is only necessary for activation and to set the parameters.
The measured data can be viewed as a
graph or in a list by selecting Upload from
Device in the Device menu or by clicking
on the device toolbar.
Note: Upon failure of the auxiliary power,
the data logger is inactive and must be reactivated.
EB 8388-5 EN
11
Statistical information AUTO
Data logging
Data can be permanently logged or the logging can be automatically triggered when a
start condition is fulfilled.
Right-click Selection parameter in Data logger folder to select Permanent or Trigger
and set the Scan rate parameter. Right-click
the Start data logger parameter and select
Execute to start data logging.
Permanent data logging
The w, x, y and e variables are saved according to the adjusted scan rate in the FIFO
memory which always stores the last 100
measured data points of each variable.
Fig. 3 · Data logger
12
EB 8388-5 EN
Note: You can read the data recorded over
the last 24 hours in a graph in
TROVIS-VIEW3 by leaving the Data logger
folder open and keeping the positioner online during this time.
Triggered data logging
On selecting Trigger in the Selection parameter, the data logger records the measured
data constantly in the background. A triggering event leads to the last 100 measured
data points being stored together with the
pretrigger time as well as the logging of the
triggering condition.
Statistical information AUTO
The following conditions are available for
triggering data logging:
4 Setpoint
4 Internal solenoid valve/forced venting
4 Valve position
4 Setpoint deviation
4 Drive signal y
4 Binary input
Setpoint, valve position, setpoint deviation,
drive signal y
Right-click Trigger status parameter and select Modify from the context-sensitive menu
to select the required trigger condition.
Activate data logging by selecting Start data
logger parameter and select Execute.
The triggering event starts data logging
when the start value exceeds or falls below
an entered value.
Enter the required value at which data logging should be triggered in Start value parameter.
Select whether data logging should start
when the entered value exceeds or falls below the start value in the Logging limit parameter.
After being triggered, the variables w, x, y
and e are saved at the adjusted scan rate in
the FIFO memory.
Additionally, there is a pretrigger time available to allow the variables to be stored that
were logged before the triggered event.
Enter the required pretrigger time by
right-clicking the Pretrigger time parameter
and selecting Modify. However, the
pretrigger time entered may not be higher
than the maximum pretrigger time determined by the positioner. This maximum
pretrigger time is shown in the Max.
pretrigger time parameter. The data logging
finishes automatically as soon as the maximum memory capacity of 100 measured
data points for each variable including the
pretrigger time is reached.
Internal solenoid valve/forced venting
Note: This function can only be used if the
positioner is fitted with a solenoid valve
(Type 3730-5) or the forced venting function
(Type 3731-5).
Select Trigger status parameter and select
Start trigger via int. sol. valve/forced venting. Activate data logging by selecting Start
data logger and select Execute to start data
logging as soon as the internal solenoid
valve voltage drops (Type 3730-5) or the
forced venting is activated (Type 3731-5).
Similar to the travel condition, the variables
w, x, e and y are saved at the adjusted scan
rate in the FIFO memory on triggering.
Additionally, there is a pretrigger time available to allow the variables to be stored that
were logged before the triggered event.
Enter the required pretrigger time by
right-clicking the Pretrigger time parameter
and selecting Modify. However, the
pretrigger time entered may not be higher
than the maximum pretrigger time determined by the positioner. The data logging
finishes automatically as soon as the maximum memory capacity of 100 measured
data points for each variable including the
pretrigger time is reached.
EB 8388-5 EN
13
Statistical information AUTO
Setpoint or internal solenoid valve/forced
venting
The triggering event starts as soon as one of
the conditions (Start trigger via setpoint or
Start trigger via int. sol. valve/forced venting) is fulfilled.
Binary input 1
Note: Triggering is started by the binary input (voltage input only). Set Selection binary
input 1 parameter in the Binary input 1
(DI1, TRD) folder to 5 – 30 V DC.
Select Trigger status parameter and select
Start via binary input. Activate data logging
by selecting Start data logger parameter
and select Execute. The triggering event
starts data logging as soon as the state of
the binary input is changed. On selecting
Start when falling below the initial value in
Logging limit parameter, the logging is
started when the binary input is passive. By
selecting Start when exceeding the initial
value, the logging is started when the binary
input is active.
After fulfilling the start condition, the variables w, x, e and y are saved at the adjusted scan rate in the FIFO memory.
The pretrigger time allows the variables to
be stored that were logged before the triggered event. Enter the required pretrigger
time by right-clicking the Pretrigger time parameter and selecting Modify. However, the
pretrigger time entered may not be higher
than the maximum pretrigger time determined by the positioner. This maximum
pretrigger time is shown in the Max.
pretrigger time parameter. The data logging
14
EB 8388-5 EN
finishes automatically as soon as the maximum memory capacity of 100 measured
data points for each variable including the
pretrigger time is reached.
2.2
Travel histogram
Fig. 4
The valve travel histogram is a statistical
analysis of the plotted valve travel.
The histogram provides information, for example, about where the valve mainly works
during its service life and whether it shows a
recent trend concerning changes in its
operating range.
The valve travel is recorded and assigned to
valve travel classes. The distribution showing
how often the valve travel remains within a
class is shown in per cent. The result is presented as a bar graph.
Long-term monitoring
The Travel histogram folder contains
long-term data, i.e. measured data are updated cyclically (scan rate 1 s) over the entire positioner service life and stored every
24 hours in the positioner’s non-volatile
memory for long-term monitoring.
The Number of measurement values parameter shows the total amount of classified
measured data points previously recorded.
The Average value x long parameter contains the class in which the travel remained
on average the most.
Short-term monitoring
In order to be able to recognize any
short-term changes in valve travel properly,
the last 100 measured data points are
Statistical information AUTO
stored at a scan rate (default: 1 s) in a FIFO
memory.
The scan rate can be changed in the Scan
rate short-term histogram parameter. On
changing the scan rate, old data in the
short-term histogram are deleted.
The Average values x short parameter contains the average class assignment for the
last 100 measured data points stored in the
FIFO memory.
Reset
Data can be reset to their default settings in
the Diagnosis folder (> Status messages >
Reset).
2.3
Setpoint deviation histogram
Fig. 5
The setpoint deviation histogram contains a
statistical analysis of any setpoint deviations
recorded. This provides a summary of how
often and to which level a setpoint deviation
has occurred during the positioner service
life and whether it shows a recent trend concerning the setpoint deviation.
The setpoint deviation is recorded and assigned to predetermined level classes. The
percentages showing how often the setpoint
deviation remains within a class is presented
as a bar graph. Ideally, the setpoint deviation should be as small as possible.
Long-term monitoring
Similar to the travel histogram, the Setpoint
deviation histogram folder contains
long-term data, i.e. measured data are updated cyclically (scan rate 1 s) over the en-
Fig. 4 · Travel histogram
EB 8388-5 EN
15
Statistical information AUTO
tire positioner service life and stored every
24 hours in the positioner’s non-volatile
memory for long-term monitoring.
Additional information determined from this
long-term histogram are shown in Fig. 5.
The Min. setpoint deviation and Max.
setpoint deviation are also indicated as drag
indicators.
Short-term monitoring
In order to obtain a summary of recent
setpoint deviations, the last 100 setpoint deviations are saved at an adjustable scan
rate (default: 1 s) in a FIFO memory.
The scan rate can be changed in the Scan
rate short-term histogram parameter. On
changing the scan rate, old data in the
short-term histogram are deleted.
The Average values e short parameter indicates the class in which the last 100 measured setpoint deviations were stored on average in the FIFO memory.
Fig. 5 · Setpoint deviation histogram
16
EB 8388-5 EN
Reset
Data can be reset to their default settings in
the Diagnosis folder (> Status messages >
Reset).
Statistical information AUTO
2.4
Cycle counter histogram
Fig. 6
The histogram shows the span of cycles the
valve has moved through and the frequency
of the cycles.
A valve cycle starts at the point where the
valve stroke changes direction until the point
where it changes direction again. The valve
stroke between these two changes in direction is the cycle span.
The cycle counter histogram provides a statistical analysis of the cycles. As a result, the
cycle counter also provides information on
the dynamic stress of a bellows seal and/or
packing.
The Dynamic stress factor parameter is specified as a percentage reflecting the stress of
the packing. An alarm is issued if the dynamic stress factor exceeds 90 %.
The Dynamic stress factor is determined from
the cycle span and how often the cycle spans
occurred (frequency) depending on which
packing has been selected (see section 1.4)
self-adjusting, adjustable or bellows seal.
To ensure this factor is correctly determined,
make sure the correct packing is selected in
the Stuffing box parameter in the Identification folder (> Positioner (AO, TRD) > Valve).
The number of cycles to determine the dynamic stress factor is limited to 1 000 000 if
the Others is selected.
The cycle counter records the number of cycles and the cycle spans which are assigned
to cycle classes.
The calculated percentages on how often a
cycle occurs within a class are shown as a
bar graph.
Long-term monitoring
The Cycle counter histogram folder contains
long-term data, i.e. measured data points
are updated cyclically over the entire
Fig. 6 · Cycle counter histogram
EB 8388-5 EN
17
Statistical information AUTO
positioner service life and stored every 24
hours in the positioner’s non-volatile memory for long-term monitoring.
The Average value z long parameter contains the cycle class in which the average
cycle spans were found.
The Counter of all measured values parameter contains the total of classified measured
data points previously recorded.
Short-term monitoring
In order to obtain a summary of recent cycles, the last 100 cycles measured are
stored in a FIFO memory.
The Short-term folder contains this additional cycle counter histogram.
The Average value z short parameter contains the average cycle class for the last 100
measured data points stored in the FIFO
memory.
Reset
Data can be reset to their default settings in
the Diagnosis folder (> Status messages >
Reset).
18
EB 8388-5 EN
2.5
Drive signal diagram
2.5.1 Steady-state drive signal
Fig. 7
The signature diagram plotting drive signal
versus valve position is based upon the drive
signal y being the internal control signal of
the i/p converter.
In relation to the valve position, this signal
runs directly proportional to the signal pressure in the pneumatic actuator.
This graph is plotted after initialization and
is stored as a reference in the positioner.
A pressure drop across the valve while the
process is running causes the signal pressure in the actuator to change by the same
amount as the valve travel because the flow
forces have an affect on the equilibrium of
forces at the valve stem.
A similar effect arises when the actuator
springs loose their compression due to one
or more springs failing. As a result, a
change in the correlation between the internal drive signal y and the valve travel also
pinpoints to one of these events having occurred.
A reduced spring force or a control valve
with the fail-safe position ”Fail-to-close”
leads to the drive signal y shifting downwards with an ever smaller gradient.
In contrast, the pressure drop across the
valve while the process is running does
cause the drive signal y to drop, but the gradient rises irrelevant of the valve travel.
If significant leakage in the pneumatics
arises due to screw fittings that are not tightened properly or due to a tear in the diaphragm, the drive signal even starts to rise
steadily at a certain valve opening com-
Statistical information AUTO
pared to the reference graph.
The drive signal y starts to rise almost unsteadily at the restricted valve position if the
positioner supply pressure is insufficient.
The steady-state drive signal diagram contains recent data to allow recent changes to
be recognized. Furthermore, long-term data
are also analyzed to be able to detect problems due to supply pressure changes or air
leaks in the pneumatics before they have an
impact on the process.
The measured data allows the following
problems to be detected and the associated
alarms to be issued:
4 Air leakage in the pneumatics
4 Spring force reduced
4 Changes in supply pressure
The valve position and its associated drive
signal y are measured after the pressure
conditions have settled (steady-state). Each
pair of measured data points recorded is
assigned to a valve position class. The average drive signal y is calculated for each
class. The stored data can be read. The reference data required are plotted and stored
after initialization.
Long-term monitoring
The long-term monitoring involves the average drive signal y for each valve position
class being determined from all measured
data points per valve position class. The average drive signal y is plotted against the
valve position x.
Short-term monitoring
The short-term monitoring involves the average drive signal y determined from the last
measured data points per valve position
class. This allows short-term changes in actuator pressure to be pinpointed at various
valve positions.
Fig. 7 · Drive signal diagram steady-state
EB 8388-5 EN
19
Statistical information AUTO
The Drive signal y and Valve position x folders contain a table of the last ten measured
data points.
Graphs
The Steady-state folder contains a common
graph for long-term, short-term and reference data. The graph plotted using the reference data covers the full working range of
the valve.
The data for long-term and short-term monitoring are recorded online while the process
is running, and therefore, the graphs do not
necessarily cover the full working range of
the valve.
Reference values are used in cases where no
data could be compiled for valve positions x
as the valve did not move to those positions
or a steady-state could not be reached.
The diagram allows changes in drive signal
y at the corresponding valve positions to be
easily recognized. Changes in pressure are
also evident as the drive signal y is proportional to the actuator pressure.
Test requirements
A successfully plotted reference graph is
necessary to record and analyze the data.
Refer to section 1.6 in case a double-acting
actuator with reversing amplifier or a
booster is used or start-up was performed in
the SUB mode (substitute calibration).
20
EB 8388-5 EN
Reset
Data can be reset to their default settings in
the Diagnosis folder (> Status messages >
Reset).
Note: The valve can be moved through its
travel range in manual mode, during plant
shutdown or when the process allows it by
selecting Drive signal diagram steady-state
in Test MAN to check the results or statements determined in automatic mode in the
Diagnosis folder (> Status message > Extended).
Statistical information AUTO
2.5.2 Hysteresis test (d5)
Fig. 8
The hysteresis test allows changes in friction
to be analyzed and an alarm is issued when
a significant change in friction is detected.
If the diagnostic test d5 is activated and the
condition for the Minimum time distance
from test parameter is met and the pressure
conditions have settled, the test is performed
with a change in travel < 1 % to find Δy.
tESt and d5 appear on the positioner display in alternating sequence and
for
manual mode appears while the test is running.
The test is immediately canceled and the
positioner returns to closed-loop operation
during this test phase if the valve position
leaves the entered Tolerance band of hysteresis or a change in the reference variable
occurs which is greater than the Tolerance
band of hysteresis.
If the test was interrupted due to a change in
the reference variable, the test is started
again after waiting 30 seconds using the
new operating point.
If the test is canceled again at this point due
to a change in the reference variable Δw,
the test is started again after waiting 60 seconds with the new operating point.
This can happen ten times, during which the
time between tests is increased by 30 seconds each time (30 s x Number of tests repeated).
After the test is canceled for the tenth time
(due to Δw), the time entered in Minimum
time distance from test parameter is kept
again.
The hysteresis test is deactivated by default.
We recommend activating the test after you
have entered Minimum time distance from
test by selecting Start test.
Fig. 8 · Drive signal diagram hysteresis
EB 8388-5 EN
21
Statistical information AUTO
The Minimum time distance from test and
the control parameters are stored in the
non-volatile memory of the positioner.
Long-term monitoring
The measured results Δy are classified according to the valve position x in the valve
position classes. The average value Δy per
valve position class is determined from all
the measured data
Short-term monitoring
To provide a short-term trend, the last ten
valve positions x and the associated Δy values are saved in the Short-term folder
(> Valve position x and Difference signal
drive).
Graphs
The Hysteresis folder contains a graph with
two lines plotted. The Measurement line
shows the measured data recorded for
long-term monitoring and the Reference line
shows the reference data recorded after initialization.
The graph plotted using the reference data
covers the full working range of the valve.
The data for long-term monitoring are recorded online while the process is running,
and therefore, the graphs do not necessarily
cover the full working range of the valve.
A straight line from the average reference
data is shown in cases where no data could
be compiled for valve working ranges which
were not covered by the long-term monitoring.
The diagram allows changes in Δy with the
corresponding valve positions to be recognized.
Changes in friction are highlighted as Δy is
proportional to the actuator pressure which,
in turn, is a measurement for friction. A
change in friction leads to an alarm being
issued.
Test requirements:
4 A successfully plotted reference graph is
4
4
22
EB 8388-5 EN
necessary to analyze the friction.
The characteristic type (Code 20) must
be set to Linear in order to record the
data.
Refer to section 1.6 in case a double-acting actuator with reversing amplifier or a
booster is used or start-up was performed in the SUB mode (substitute calibration).
Statistical information AUTO
Note: The valve can be moved through its
travel range in manual mode, during plant
shutdown or when the process allows it by
selecting Drive signal diagram hysteresis in
Test MAN to check the results or statements
determined in automatic mode in the Diagnosis folder (> Status message > Extended).
The following parameters are changed correspondingly during hysteresis test (d5) from
statistical information AUTO:
4 Lower x-range value (Code 8): 0 %
4 Upper x-range value (Code 9): 100 %
4 Lower/upper x-limit (Code 10/11): OFF
4 Setpoint cutoff w decrease/increase
(Code 14/15): OFF
4 Pressure limit (Code 16): Active pressure
limit is raised one stage higher
4 W-ramp OPEN/CLOSED (Code 21/22):
Variable
Reset
Data can be reset to their default settings in
the Diagnosis folder (> Status messages >
Reset).
EB 8388-5 EN
23
Statistical information AUTO
2.6
End position trend
Fig. 9
The end position trend is used to detect a
creeping zero point shift due to seat and
plug wear or dirt between the seat and
plug. A fluctuating zero point also causes an
alarm to be issued.
To accomplish this function, the valve position x and the drive signal y are automatically logged and time-stamped by the operating hours counter in automatic mode
when the valve moves to the lower end position. The measured data are stored in a
FIFO memory that always stores 30 measured data points plus reference data. Measured data are first recorded in the FIFO
memory when the valve position x deviates
from the previously recorded value by the
threshold value (0.25 %).
Fig. 9 · End position trend
24
EB 8388-5 EN
To allow the test to run automatically in the
background, activate the tight-closing function (over Code 14 or in the Positioner (AO,
TRD) folder (> Reference variable > Setpoint
cutoff decrease) and make sure the
positioner is in the AUTO operating mode.
In cases where a reference test has not been
performed, the first zero point that the valve
moved to in closed loop operation serves as
the reference. The reference value is stored
in a non-volatile memory independently
from the FIFO memory.
An alarm is generated after a change in
zero point or when a zero point shift outside
of the zero point limit is detected.
Enter the zero point limit in the Positioner
folder (> Error control > Zero point limit) or
over Code 48 in the positioner, selecting d5
(default setting 5 %).
Statistical information AUTO
Note: The valve end position is also logged
when the valve moves to the fail-safe position over the forced venting option and with
an actuator with AIR TO OPEN.
Graph versions
Select Trend of valve end position folder to
view a graph of the recorded end positions.
The reference value is represented by a
straight line in the graph.
The graph highlights a trend and a change
in the end position.
The Lower end position folder contains a table of the measured data (valve position x,
drive signal y) with time stamp.
Reset
Data and the reference value can be reset to
their default settings in the Diagnosis folder
(> Status messages > Reset).
EB 8388-5 EN
25
Tests in manual mode
3
Tests in manual mode
Select the Start all tests parameter to automatically start the tests one after the other
(refer to sections 3.1 and 3.2).
3.1
Tests MAN (d1 to d3)
These tests are not performed in closed-loop
operation. The positioner does not follow its
reference variable.
CAUTION!
In the tests d1 (drive signal diagram
steady-state), d2 (drive signal diagram hysteresis) and d3 (static characteristic), the
control valve moves through its full working
range after the test starts.
As a result, it is important to make sure before starting the test whether the conditions
(in the plant or process) allow the valve to
move.
In contrast to the tests in statistical information AUTO, the corresponding test MAN
covers the full working range of the valve
and also serves to detect errors within the
travel range.
The tests MAN provide a trend showing the
current control valve state, any possible existing malfunctions and help to pinpoint
faults and to schedule predictive maintenance work.
For reasons of safety, the tests MAN can
only be started when the positioner is in
manual operating mode.
26
EB 8388-5 EN
Select the operating mode over Code 0 on
the positioner or in Positioner (AO, TRD)
folder (> Operating mode).
The following list of parameters are changed
while the tests MAN (d1 to d3) are being
performed:
4 Lower x-range value (Code 8): 0 %
4 Upper x-range value (Code 9): 100 %
4 Lower/upper x-limit (Code 10/11): OFF
4 Setpoint cutoff w decrease/increase
4
4
4
(Code 14/15): OFF
Pressure limit (Code 16): Active pressure
limit is raised one stage higher
Characteristic (Code 20): Linear
W-ramp OPEN/CLOSED (Code 21/22):
Variable
Note: The tests MAN can only be activated
in the manual operating mode.
Tests in manual mode
3.1.1 Drive signal diagram
steady-state (d1)
Fig. 10
As described in detail in section 2.5 on the
drive signal diagram, the drive signal y plotted versus valve position x allows the following changes at the control valve to be recognized (and an alarm issued):
4 Air leakage in the pneumatics
4 Spring force reduced
4 Changes in the supply pressure
This test (d1) causes the valve to move
through the travel range to allow the results
and alarms issued in automatic mode to be
accurately checked.
After starting the test, the valve is moved to
various fixed valve positions x distributed
over the full working range of the valve.
The drive signal y is measured for each
valve position x and stored in the positioner
memory. The necessary data set for the reference graph is automatically plotted and
stored directly after initialization. The start
time for the reference graph is stored with
the Reference time stamp in the positioner’s
non-volatile memory.
Any further measurement is stored as a repeated measurement. Previously recorded
repeated measurements stored in the
positioner are overwritten. However, note
that you can upload previous repeated measurements to a computer before starting a
new test.
While the test is active, d1 and tESt appear
on the positioner display in alternating sequence and
indicates manual operating
mode.
Fig. 10 · Drive signal diagram steady-state
EB 8388-5 EN
27
Tests in manual mode
Viewing the recorded parameters:
The Drive signal diagram steady-state folder
contains the reference and repeated measurements in a table and in a graph plotting
the drive signal versus the valve position.
Test requirements:
4 A successfully plotted reference graph
4
28
and repetition lines are necessary in order to analyze the data.
If a reference graph still has not been
plotted on starting the test, this test is
adopted as the reference.
Refer to section 1.6 in case a double-acting actuator with reversing amplifier or a
booster is used or start-up was performed in the SUB mode (substitute calibration).
EB 8388-5 EN
Tests in manual mode
3.1.2 Drive signal diagram
hysteresis (d2)
Fig. 11
Similar to the corresponding test in statistical
information AUTO, this test (d2) is used to
analyze the change in friction forces.
However, unlike the test in statistical information AUTO, this test causes the valve to
move to defined valve positions over the
travel range, and determines Δy for each
valve position.
The valve is made to move to fixed nodes of
the valve position x and the valve position is
ramped up (< 1 %) correspondingly.
The drive signal y and the change in valve
opening are analyzed during this test concerning changes in Δy for changes in direction to precisely check the results or any
alarms issued in automatic mode.
If the valve cannot move to a certain valve
position node or the setpoint leaves the Tolerance band of hysteresis during the test, a
message is generated in Test information
and the test is canceled.
The necessary data set for the reference
graph is automatically plotted and stored directly after initialization. The start time for
the reference graph is stored with the Reference time stamp in the non-volatile memory
of the positioner. Any further measurement
is stored as a repeated measurement.
Previously recorded repeated measurements
stored in the positioner are overwritten.
However, you can upload previous repeated
measurements to a computer before you
start a new test.
While the test is active, d2 and tESt appear
on the positioner display in alternating sequence.
indicates manual operating
mode.
Fig. 11 · Drive signal diagram hysteresis
EB 8388-5 EN
29
Tests in manual mode
Viewing the recorded parameters:
The Drive signal diagram hysteresis folder
contains a table or graph with reference
measurements and the last repeated measurement performed plotting the change in
drive signal Δy versus the valve position x.
Test requirements:
4 A successfully plotted reference graph
4
30
and repeated measurements are necessary in order to analyze the data.
If a reference graph still has not been
plotted on starting the test, this test is
adopted as the reference.
Refer to section 1.6 in case a double-acting actuator with reversing amplifier or a
booster is used or start-up was performed in the SUB mode (substitute calibration).
EB 8388-5 EN
Tests in manual mode
3.1.3 Static characteristic (d3)
Fig. 12
The static performance of the control valve is
affected by the friction hysteresis and the
elastic processes in the valve stem packing.
The static characteristic is plotted to check
the static performance. An analysis of the
control loop is performed using the analysis
parameters: Min. dead band, Max. dead
band and Average dead band.
To accomplish this, the reference variable w
is commanded in small steps and the response of the valve position x is plotted after
waiting a predetermined period of time.
This test (d3) allows the full working range
of the valve to be recorded in manual mode.
the test range. 100 measured points are
plotted at the maximum, i.e. max. 50 measured points are available for the ascendent
and the descendent.
The step height and the number of measuring points are determined automatically by
the adjusted test range. The dead band is
analyzed by a step height smaller than
0.2 %.
The setpoint difference that causes a minimal change in the valve position x is termed
dead band. It is recorded and analyzed in
the positioner for each step.
While the test is active, d3 and tESt appear
on the positioner display in alternating sequence.
indicates manual operating
mode.
It is also possible to define a test range by
selecting the Start and End parameters. The
ascendent and descendent are plotted within
Fig. 12 · Static characteristic
EB 8388-5 EN
31
Tests in manual mode
Viewing the recorded parameters
The Static characteristic folder contains a table and a graph of the measured points,
plotting the valve position x versus the reference variable w.
The Measured data subfolder (>Valve position x) and (> Reference variable w) contain
a table of the individual corresponding
measured points.
Data can be reset the Diagnosis folder (>
Status messages > Reset).
Test requirements
The starting point must be smaller than the
final point.
The dead band is analyzed if the step height
is smaller than 0.2 %.
Reset
Data can be reset to their default settings in
the Diagnosis folder (> Status messages >
Reset).
32
EB 8388-5 EN
Tests in manual mode
3.2
Partial stroke test – PST (d4)
Fig. 13
The partial stroke test (d4) is particularly
suitable for the status-oriented detection of
malfunctions in pneumatic shut-off valves.
As a result, the probability of failure on demand (PFD) can be reduced and maintenance intervals may possibly be extended.
The partial stroke test can prevent a valve
normally in its end position from seizing up
or getting jammed. Recording the test additionally allows an analysis of the dynamic
control response.
During the partial stroke test, the valve is
moved from a defined start value, e.g. the
operating point (end position), either in
steps or in a ramp function until it reaches a
defined final value. Then, the valve is moved
back again to its initial position.
The partial stroke test can be performed, for
example between 5 and 10 % based on the
start value while the plant is running, yet
without disrupting plant operation. The start
and final values for the partial stroke test
can be configured by the user.
The various test cancelation conditions provide additional protection against the valve
slamming shut and moving past the final
value. The increasing and decreasing characteristic are analyzed separately.
Partial stroke tests can be started and canceled either manually at any time (on site or
using an engineering tool) or automatically
according to a certain time schedule.
A test status is determined at the end of a
partial stroke test, which allows operators to
directly see whether the test has been completed successfully or not. When the test has
not been completed successfully, possible
reasons why the test was canceled are
given. The test status and the reason for the
Fig. 13 · Step response/partial stroke test (PST)
EB 8388-5 EN
33
Tests in manual mode
cancelation are indicated on the positioner’s
display and in the engineering tool used.
Note: You can configure the partial stroke
test either over the operator interface or directly at the positioner by selecting Code
49. These instructions contain a supplement
to the code list in EB 838x-5 EN listing Code
49 (section 9 on page 53).
Upon failure of the auxiliary power, the automatic activation of the partial stroke test
remains active. The time counter in Auto test
time is reset to 0 again.
The hysteresis test d5 from statistical information AUTO as well as the setpoint deviation histogram and cycle counter histogram
are also available in manual mode if the
partial stroke test is automatically started
(PST Auto) (refer to section on starting the
partial stroke test).
Changes to the parameters are possible regardless of the operating mode when the
PST Man is set in the PST testing mode parameter.
w
[%]
Depending on the parameter settings, the
partial stroke test is conducted either in steps
or in a ramp function of the valve position
(see Fig. 14).
After being activated, the test does not start
until the Settling time before test start (t1) has
elapsed. This waiting period ensures that the
valve has reached the position defined by
the Step start parameter (pos. 2) before the
test starts.
w
Pos. 1
Pos. 1
Pos. 2
Pos. 2
[%]
v1
v2
Pos. 3
Pos. 3
t
t1
t2
Valve positions:
Pos. 1 = Required manual
reference variable w
Pos. 2 = Step start
Pos. 3 = Step end
t2
[s]
t
t1
Times:
t1 = Settling time before test start
t2 = Delay time after step
t2
Velocities:
100
%
Ramp time (falling) s
100
%
v2 =
Ramp time (rising) s
v1 =
Fig. 14 · Courses of the partial stroke tests with step response (left) and ramp function (right)
34
EB 8388-5 EN
t2
[s]
Tests in manual mode
Starting from the Step start position (pos. 2),
the valve moves to the defined end position
(Step end parameter, pos. 3). The valve remains in this position for the time defined by
the Delay time after step (t2) before performing a second step change in the opposite direction from Step end (pos. 3) to Step start
(pos. 2). After the Delay time after step (t2)
has elapsed, the valve is moved back to its
initial position (= Required manual reference
variable w, pos. 1).
The Step tolerance limit sets the permissible
tolerance limit for the step’s start and end
values.
The Scan rate defines the interval at which
the measured values are recorded during
the test.
The positioner stores a maximum of 100
measured values per measured variable
(valve position x, reference variable w,
setpoint deviation e, drive signal y and the
time when they were recorded).
The Min. recommended scan time, which
should not be shorter, if at all possible, is
calculated from the Duration of the test.
After 100 measured values per measured
variable have been stored, the logging is
stopped. However, the test is still completed.
The Measured data storage out of memory
alarm is generated if the test is not ended
with data logging.
The Display section in TROVIS-VIEW3
shows the Progress flag in percent.
1. Step response function, Fig. 14 left
The step response function is activated when
the Activation of the ramp function parameter is set to "No".
The valve is moved in steps to the Step end
position (pos. 3) during the first half of the
test and to the Step start position (pos. 2)
during the second half of the test.
2. Ramp function, Fig. 14 right
The ramp function is active when the Activation of the ramp function parameter is set to
"Yes" (default).
A step before the partial stroke test can be
prevented when the Step start parameter is
consistent with the operating point of the
positioner.
The valve is moved to the Step end (pos. 3)
and Step start (pos. 2) positions with fixed
velocities (v1 and v2) set by the Ramp time
(falling) and Ramp time (rising) parameters.
The ramp time specifies the time required by
the valve to move through the travel range
100 to 0 % (falling) and 0 to 100 % (rising).
Note: Times for the Ramp time (falling/rising) are determined during initialization of
the positioner. Do not set the times in these
parameters below these limits for the partial
stroke test with ramp function.
Cancelation conditions
The positioner cancels the partial stroke test
when one of the following activated cancelation conditions is fulfilled. This cancelation
causes a classified status alarm to be generated.
EB 8388-5 EN
35
Tests in manual mode
Definable cancelation conditions include:
4 Max. test duration: The test is canceled
4
4
4
36
when the maximum permissible test duration is exceeded.
x control value: The test is canceled when
the value falls below the adjusted valve
position.
The condition is only active when Activation x control is set to “Yes“.
delta y-monitoring value: The test is canceled when the control signal y falls below the predetermined comparison
value. This comparison value is made up
from delta y-monitoring reference value
parameter and the set safety factor delta
y-monitoring value.
The delta y control value is set in % and
is based on the entire control signal
range (10 000 1/s).
The cancelation condition is active when
Activation delta y-monitoring is set to
“Yes“.
Monitoring the delta y only makes sense
when the partial stroke test is performed
as a ramp function.
The results of the first partial stroke test
are used as reference values.
PST tolerance band: The test is canceled
as soon as the deviation of the valve position (in relation to the step height) exceeds the adjusted value. The condition
is only active when Activation PST tolerance band control is set to “Yes“.
EB 8388-5 EN
Note: Changes to the parameters listed below cause the delta y-monitoring to change
as well as the Scan time and Max. test duration parameters. As a result, new reference
values need to be saved.
– Step start
– Step end
– Activation of the ramp function
– Ramp time (falling)
– Ramp time (rising)
– Delay time after step
Starting the partial stroke test
The partial stroke test can be started manually or automatically according to a time
schedule.
4 Manual start of the partial stroke test
4
(AO Transducer Block)
The test can be started and canceled using the ENHANCED_ DIAG_CMD parameter in the AO Transducer Block (see
page 40). The test is started in the PST
Man testing mode. The AO Transducer
Block must be in the Local Override
mode (display of on-site operation:
)
or in the manual mode (display
and
). Refer to section 8 on page 52.
In the manual mode, the reference variable can be determined by the
FINAL_VALUE parameter of the AO
Transducer Block.
Manual start of the partial stroke test
using DI2 Function Block
To start the partial stroke test and evaluate the condensed status, the DI2 Function Block can be used. It can be activated by selecting the “Condensed status
and PST“ option of the SELECT_
Tests in manual mode
BINARY_ INPUT2 parameter in the Resource Block. The partial stroke test is
started when the simulation is locked by
writing the discrete value 7 on the
SIMULATION_ VALUE with a status
greater than “uncertain“.
The condensed status is issued at the discrete output OUT_D for analysis purposes.
The DI2 Function Block allows the test to
be started manually from any operating
mode with either PST Man and PST Auto.
Refer to section 8 on page 52.
Note: On enabling the simulation, the partial stroke test of the DI2 Function Block is
deactivated.
4 Automatic starting of the test according
to a predetermined time schedule (Auto
test time)
An automatic test according to a time
schedule is only performed when
the Auto test time parameter is set to ≠ 0.
The testing mode also needs to be
switched over to PST Auto. The first test is
started when the interval has elapsed for
the first time.
The Time until the next automatic PS Test
takes place parameter indicates the time
that remains until the next test is started.
tEst d4 appears on the positioner display
during the test.
The following listed parameters are changed
correspondingly during a partial stroke test:
4 Lower x-range value (Code 8): 0 %
4 Upper x-range value (Code 9): 100 %
4 w-ramp OPEN/CLOSED (Codes 21/22):
variable
A successfully performed partial stroke test
is logged. The cancelation messages created
by the partial stroke test are recorded in the
logging. Should the same fault occur again
at a later point in time, this message is
relogged.
The results of the first partial stroke test are
used as reference values.
Measured data analysis
Analyses of the last three partial stroke tests
completed are saved in the positioner with a
time stamp and a statement about how the
test was started (manually or automatically).
If the test has not been completed successfully, the reason why the test was canceled
is indicated under “Maintenance alarm“.
Possible reasons for cancelation depending
on the defined cancelation conditions are:
4 x cancelation: The valve position fell be4
4
4
low the x control value.
y cancelation: The drive signal fell below
the predefined comparison value (see
description on page 36).
Tolerance band exceeded: The deviation
of the valve position exceeded the PST
tolerance band.
Max. test time exceeded: The test was
not completed within the specified period
of time.
Further error messages include:
4 No text available
4 Test man. canceled: The test has been
4
manually canceled.
Measured data storage out of memory:
The scan rate has been selected too low.
EB 8388-5 EN
37
Tests in manual mode
4
4
After 100 measured data per measured
variable have been recorded, the logging stops. However, the test is continued.
Int. sol. valve/forced venting: The test
was canceled because the internal solenoid valve has been triggered
(Type 3730-5) or the forced venting has
been activated (Type 3731-5).
Supply pressure/friction: An insufficient
supply pressure or excessive friction occurred during the test.
When a partial stroke test has been completed successfully, analyzed parameters
are also displayed separately for the increasing and the decreasing characteristic.
Parameters for a partial stroke test (step response):
4 Overshoot (relative to the step height) [%]
4 Dead time [s]
4 T63 [s]
4 T98 [s]
4 Rise time [s]
4 Settling time [s]
4 Minimum value for y control (y_Min)
[1/s]
Parameters for a partial stroke test (ramp):
4 Overshoot (relative to the step height) [%]
4 Minimum value for y control (y_Min)
[1/s]
If the test has not been completed successfully, this is indicated under Code 82. The
influence on the condensed state is determined in the Partial Stroke Test - Status
active parameter (default: Maintenance requested).
38
EB 8388-5 EN
Reset
Using the Reset PST parameter, the parameters of the partial stroke test are reset to their
default values.
Any recorded measured values and error
messages are deleted. Logging messages
are not changed.
Resetting the start-up parameters over Code
36 also resets the PST parameters.
Tests in manual mode
3.2.1 Step reponse
3.3
Data logger
The dynamic performance of the control
valve can be tested by plotting its step response.
The step response of the valve is plotted with
the PST function by sudden changes in the
valve position. To proceed, the Activation of
the ramp function parameter needs to be set
to “No” (see Fig. 14, left). In addition, the
following settings are recommended:
The data logger from the statistical information AUTO can also be started in the manual mode (refer to section 2.1) and, as a result, is available in the PST Auto and PST
Man testing modes. Changes can only be
made when PST Man is set.
4 Deactivate all cancelation conditions of
4
the partial stroke test (see page 35).
Start the partial stroke test manually (PST
Man).
After the test is completed, the data are automatically analyzed in the positioner and
the Overshoot, Dead time, T63, T98, Rise
time, Settling time and Minimum value for y
control parameters are determined separately for both step responses.
Viewing the recorded parameters:
The PST folder contains a graph plotted over
time of the parameters required for an analysis of the step response such as the reference variable w, valve position x, setpoint
deviation e and drive signal y.
EB 8388-5 EN
39
Tests in manual mode
Accessible functions of ENHANCED_DIAG_CMD parameter:
0
1
2
3
4
5
6
7
8
9
10
11
12
14
15
16
17
21
22
23
24
25
26
27
28
29
30
31
32
37
38
39
40
No function
Start data logger
Abort data logger
Start hysteresis online test
Abort hysteresis online test
Start partial stroke test/step response
Abort partial stroke test /step response
Start test in turn
Abort test in turn
Start drive signal diagram steady
Abort drive signal diagram steady
Start drive signal diagram hysteresis
Abort drive signal diagram hysteresis
Abort static characteristic
Start reference test
Abort reference test
Reset event logger
Reset ‘X – long term histogram’
Reset ‘Cycle counter histogram – long term’
Reset ‘E long term setpoint deviation’
Reset ‘Y - X long term’
Reset ‘Y - X short term’
Reset ‘Hysteresis long term’
Reset ‘Lower end position’
Reset ‘Lower end position – ref. values’
Reset ‘X – short term histogram’
Reset ‘E – short term setpoint deviation’
Reset ‘Cycle counter histogram – short term’
Reset ‘Hysteresis short term’
Reset ‘Step response/partial stroke test’
Reset ‘Y - X measured values
Reset ‘Hysteresis measured values’
EB 8388-5 EN
Diagnosis – Status alarms
4
Diagnosis – Status alarms
4.1
Standard EXPERT alarms
The following folders contain particularly informative data for valve diagnostics:
4 Positioner (AO/TRD) folder (> Process
The standard EXPERT diagnostics provides
information about positioner states such as
operating hours counter, process monitoring, number of zero calibrations and
initializations, total valve travel, temperature, initialization diagnostics, zero/control
loop errors, etc.
In addition, the standard EXPERT diagnostics
generates messages and status alarms
which allow faults to be pinpointed quickly
when a fault occurs. The messages and status alarms generated by EXPERT appear on
the positioner display and can also be
viewed on the TROVIS-VIEW interface in the
Diagnosis folder (> Status messages).
Alarms and messages are classified in the
following main groups:
4 Status
4 Operation
4 Hardware
4 Initialization
4 Data memory
4 Temperature
Further information on the positioner status
(e.g. tight-closing function) and the parameters (e.g. characteristics) are displayed in
the Positioner (AO/TRD) folder.
4
4
4
4
data)
Information on the current process variables, condensed state, state of the
Transducer Block and temperature.
The Trend Viewer function (activate
Trend Viewer in the View menu) allows
process variables to be shown in one or
more graphs.
To proceed, drag and drop the required
process variable into the graph.
Positioner (AO/TRD) folder (> Error control)
Information on total travel with a freely
defined limit
Positioner (AO/TRD) folder (> Error control > Classification report)
Classification of individual events/alarms
with a status
Positioner (AO/TRD) folder (> Start-up >
Initialization)
List of initialization errors which can also
be found in the Diagnosis folder (> Status messages).
Diagnosis folder (> Status messages >
Logger)
Alarms recorded that have been sent by
the positioner.
EB 8388-5 EN
41
Diagnosis – Status alarms
4.2
+
Extended EXPERT alarms
4.4
Further status alarms are generated from the
extensive information gained in the diagnostic functions of EXPERT+ and the partial
stroke test which provide the user with information covering the whole control valve.
These status alarms can be viewed in the Diagnosis folder (> Status messages >
Extended).
An active alarm generated by EXPERT+ or
by the partial stroke test appears on the
positioner display over Code 79.
A partial stroke test that has not been successfully completed is also registered in
Code 82.
4.3
Logging
The last thirty alarms (EXPERT/ EXPERT+) are
stored in the positioner with a time-stamp
(logged by the operating hours counter).
The alarms stored can be viewed in the Status message folder > Logger.
Entries can be reset in the Reset folder.
Condensed state
red
Maintenance required/
Maintenance requested
blue
Function check
orange
No message
green
EB 8388-5 EN
To provide a better overview, the state of the
positioner is summarized in a condensed
state which is made up from a summary of
all classified alarms generated by the
positioner.
Note: If an event is classified as “No message”, this event does not have any affect
on the condensed state of the positioner.
The condensed state is displayed in the engineering tool (TROVIS-VIEW/DTM) as well
as on the positioner display as in the table
below.
Additionally, the condensed state can be
read from the CONDENSED_STATE parameter in the Resource Block and from the
OUT_D parameter in the DI Function Blocks.
Note: The condensed state and status
alarms are marked with
in
TROVIS-VIEW3 until they have been read
out.
TROVIS-VIEW/DTM
Maintenance alarm
42
Condensed state
Positioner display
Text
Diagnosis – Status alarms
4.5
Classification of the status
alarms
A status is assigned to every event or alarm.
The following states listed in the table below
are possible.
Select Positioner (AO, TRD) folder (> Error
control > Classification report) to modify the
classification of standard alarms generated
by EXPERT.
Select Positioner (AO, TRD) folder (> Error
control > Classification report > Extended)
to modify the classification of alarms
generated by EXPERT+.
All additional alarms generated by EXPERT+
have the status “No message” by default,
except for the status alarms for the partial
stroke test (PST). The status alarm for the
partial stroke test has the “Maintenance
required” as its default setting.
On resetting the positioner parameters to
their default settings (Code 36), the status
classification is also reset to the default setting.
Status classification of individual alarms
Note: If modifications that have already
been made should be kept, we recommend
uploading them on a computer before performing a reset and then downloading them
onto the positioner again afterwards.
The following classifications are possible:
4 Maintenance alarm
4
4
The positioner cannot perform its control
task due to a functional fault in the device or in one of its peripherals or an initialization has not yet been successfully
completed.
Maintenance required/requested
The positioner still performs its control
task (with restrictions). A maintenance
requirement or above average wear has
been determined. The wear tolerance
will soon be exhausted or is reducing at
a faster rate than expected. Maintenance
is necessary in the medium term.
Function check
Test or calibration procedures are being
performed. The positioner is temporarily
unable to perform its control task until
this procedure is completed.
TROVIS-VIEW3/DTM
Maintenance alarm
red
Maintenance required/
Maintenance requested
blue
Function check
orange
No message
white
EB 8388-5 EN
43
Diagnosis – Status alarms
Status classification over FOUNDATION™
fieldbus
The CONDENSED_ STATE is created by
summarizing all classified status alarms
from the positioner and is available in the
Resource Block. In addition, the
CONDENSED_STATE is shown in the
OUT_D parameter of the DI Function Blocks
and appears on the positioner display. The
status of individual alarms can be assigned
as required using the ERROR_OPTS parameter.
The following classifications of the states are
possible:
4 Maintenance required
4 Maintenance requested
4 Maintenance alarm
4 Function check
4 No message
In addition to the condensed state, the messages of Block Error (Resource and AO
Transducer Block) can also be assigned to
the events:
4 No message
4 Device needs maintenance soon
4 Device needs maintenance now
44
EB 8388-5 EN
Resetting diagnosis parameters
5
Resetting diagnosis
parameters
When an alarm is issued, the source of the
error should be first located and the error
remedied.
In the case of an EXPERT alarm, we recommend reading the recommended action in
the error code list (refer to EB 8384-5 EN or
EB 8387-5 EN).
Recommended action on EXPERT+ alarms
are listed in the table in section 7.
Standard EXPERT diagnostics
Alarms generated by EXPERT, which are indicated on the positioner display by an error code, can be confirmed by pressing the
rotary pushbutton after selecting the corresponding error code.
Resetting error codes as well as resetting options such as logging or the total valve travel
can be performed using an engineering
tool, for example, TROVIS-VIEW3 software
(see Fig. 15).
Extended EXPERT+ diagnostics
Extended alarms generated by EXPERT+ are
based upon the tests in statistical information AUTO and tests MAN. An active
EXPERT+ alarm is indicated by Code 79 in
the positioner. A partial stroke test that has
not been successfully completed is also registered in Code 82.
Select Diagnosis folder (> Status messages
> Reset) to reset data from statistical information AUTO and tests MAN (see Fig. 15).
Note that the corresponding short-term histogram/short-term monitoring is also reset
on resetting long-term histogram/long-term
monitoring. The data of the partial stroke
test are directly reset in the Diagnosis folder
(> Tests MAN > Step response/Partial stroke
test > Reset - PST).
On performing the tests MAN, the measuring data of the last measurement as well as
the reference measurements (for d1 and d2)
are stored in the positioner.
Fig. 15 · Resetting diagnostic parameters
EB 8388-5 EN
45
Resetting diagnosis parameters
On restarting a test MAN, the existing data
are updated by the repeated measurement
data and stored in the positioner.
In addition, the repeated measurements of
the tests MAN such as drive signal diagram
steady-state and drive signal diagram hysteresis can be reset by selecting the Diagnosis folder (> Status messages > Reset).
Resetting the measured data does not cause
the reference graphs to be reset:
4 Drive signal diagram steady-state
4 Drive signal diagram hysteresis
4 Reference value for the end position
trend
However, the existing data set is replaced
by the new reference data when the reference graphs for steady-state and hysteresis
graphs (see section 1.5) are replotted.
The data sets from already existing measurements of steady-state and hysteresis
graphs recorded in both statistical information AUTO and tests MAN are reset when
both reference graphs are updated.
Initialization
After an initialization has been successfully
completed, new reference measurements are
automatically plotted and the existing reference data are overwritten. The new reference data and the optimized control parameters cause the following statistical information AUTO and MAN tests to be reset:
4 Drive signal diagram steady-state
4
46
(statistical information AUTO and tests
MAN)
Drive signal diagram hysteresis
(statistical information AUTO and tests
MAN)
EB 8388-5 EN
4 Setpoint deviation histogram (long-term
and short-term)
4 End position trend
4 Partial stroke test
A reference measurement needs to be
performed due to the new ramp times
(see note on page 35).
Resetting over Code 36 (EXPERT/EXPERT+)
Activate Code 36 or select Operation unit
folder (> Start with default settings) to reset
the positioner parameters to their default
settings (see code list in EB 8384-5 EN or
EB 8387-5 EN).
The following diagnostic functions of
EXPERT/EXPERT+ diagnostics are reset:
4 Settings and activated tests from statisti4
4
4
4
4
cal information AUTO and tests MAN in
EXPERT+
Operating hours counter: (> Device
switched on since initialization) and
(> Device since initialization in control
loop) (EXPERT)
Total valve travel (EXPERT)
All short-term histograms (EXPERT+)
Drive signal diagram steady-state and
diagram hysteresis
from statistical information AUTO and
tests MAN (EXPERT+)
Static characteristic and partial stroke
test (EXPERT+)
End position trend (EXPERT+)
Additionally, the status classification is reset.
If the same status classification is to be used
in future, you can upload the settings onto a
computer over, for example, TROVIS-VIEW
software.
Resetting diagnosis parameters
Mounting the positioner onto another control valve
As the EXPERT+ extended diagnostics provides statements about the entire control
valve, the data from statistical information
AUTO and tests MAN need to be reset
when the positioner is attached to a different
control valve.
After mounting the positioner on the new
control valve, perform a reset over Code 36
and re-initialize the positioner. This leads to
the most of the diagnostic functions being
reset.
We recommend additionally to manually reset the long-term travel histogram and the
long-term cycle counter histogram as well as
the logging by selecting the Diagnosis folder
(> Status messages > Reset).
EB 8388-5 EN
47
Diagnostic parameters saved in non-volatile memory
6
Diagnostic parameters saved in non-volatile memory
Data saved if a parameter change is
detected
Data logger
Travel histogram
Setpoint deviation histogram
Data logging, scan rate, start value, logging limit, trigger status
Scan rate
of short-term monitoring
Cycle counter histogram
Drive signal histogram
(hysteresis) (d5)
Minimum time between tests,
start test
End position trend
Measured values when end position
changes
Drive signal diagram (hysteresis) (d2)
Reference test,
reference time stamp
Static characteristic (d3)
Partial stroke test (d4)
Delta y-monitoring reference value, Activation delta y-monitoring, Delta y-monitoring
value, Step start, Step end, Activation of the
ramp function, Ramp time (falling), Ramp
time (rising), Settling time before test start,
Delay time after step, Scan rate, Activation
x control, x control value, Activation PST
tolerance band control, PST tolerance band,
Maximum test duration, parameters for
analysis, Number of steps, Step tolerance
limit
Actuator and valve data
Yes
Logging
Save when a new alarm is issued
Classification of status alarms
Yes
48
EB 8388-5 EN
Data for long-term
histogram
Data for short-term and
long-term histograms
Drive signal histogram
(steady-state)
Drive signal diagram
(steady-state) (d1)
Cyclic saving (24 h)
Data for long-term
monitoring
Troubleshooting
7
Troubleshooting
Fault category
Alarm
Supply pressure Possibly changed
(TEST)1)
Possibly at full capacity
(TEST)1)
Possibly insufficient
Trend conWorking range shift
cerning working CLOSED position
range of valve Working range shift
max. OPEN
Air leakage in
the pneumatics
Possibly exists (TEST)1)
Possibly too much (TEST)1)
Possibly too much
Possibly exists
Restriction of full Downwards
range of valve Upwards
No change possible (terminals)
End position
trend
Recommended action
Resetting alarm
Check supply pressure.
Reset
y-x signature measured
data
Refer to the section on
supply pressure in EB
8384-5 EN or
EB 8387-5 EN.
Reset over Code 57.
Reset y-x long-term and
short-term monitoring
Reset
Check the valve working x long-term and short-term
histograms
range.
Reset
y-x signature measured
Check pneumatic actua- data
tor and connections for Reset
y-x long-term and
leakage.
short-term monitoring
Reset over Code 57.
Check pneumatic accessories and connections
for leakage.
Check supply pressure
and increase it, if necessary.
Refer to the section on
supply pressure in
EB 8384-5 EN or
EB 8387-5 EN.
Check plug stem for
problems caused by an
external source.
Zero point shift downwards
monotonic
Check plug and seat
Average value above the reference line
Reset over Code 57.
Reset
e short-term histogram
Reset
e long-term histogram
Reset
lower end position trend
EB 8388-5 EN
49
Troubleshooting
End position
trend
Zero point shift upwards
monotonic
(continued)
Average value above the reference line
Check plug and seat
Reset
lower end position trend
Zero point fluctuates
Average value above the reference line
Zero point shift downwards
monotonic
Average value below the reference line
Zero point shift upwards
monotonic
Average value below the reference line
Zero point fluctuates
Average value below the reference line
Mechanical
connection
linking
positioner/
control valve
Full range of
valve
Possible restriction of the full
range of valve
Mainly near to CLOSED
position
Mainly near to max. OPEN
Mainly CLOSED position
Check attachment
Reset
e short-term histogram
Reconsider whether the
working range is suitable
Reset
x long-term histogram
Check packing
Reset
hysteresis long-term and
short-term monitoring
Mainly max. OPEN
Friction
Much higher over the full
range of valve
Much lower over the full
range of valve
Much higher over part of the
range
Much lower over part of the
range
50
EB 8388-5 EN
Troubleshooting
Friction
(continued)
Much higher/lower over the
full range of valve (TEST)1)
Much higher/lower over part
1)
of the range (TEST)
Check packing
Reset
hysteresis measured data
Actuator springs Spring rigidness possible reduced (spring failure)
Reset
Check springs in the ac(TEST)1)
y-x signature measured
tuator
data
Compression possible reduced (TEST)1)
Seat leakage
Possibly different
Check plug and seat
Leakage to the
atmosphere
Reset
y-x signature measured
data
Reset
e short-term histogram
Reset hysteresis long-term
and short-term monitoring
Maybe to be expected soon
Check packing
Reset
hysteresis measured data
Reset
z long-term histogram
Dynamic stress
factor 2)
Partial stroke
test
1)
2)
Percentage as information on
packing load
Leakage to the atmosphere
Check packing
alarm active when greater
than 90 %
PST status set
Check cancelation
conditions (p. 35) and
measured data analysis
(p. 37)
Check valve for
malfunction (e.g.
blockage).
Reset
z long-term histogram
Restart test after correcting
Generated by tests MAN
This value is included in the Cycle counter histogram in statistical information AUTO
EB 8388-5 EN
51
Starting partial stroke test manually
8
Starting partial stroke test manually
Operating mode
(on-site display)
(AO Transducer
Block in Local
Override mode)
and
(AO Transducer
Block in MAN
mode)
52
EB 8388-5 EN
PST testing
mode
Partial stroke test start manually
(see page 36)
PST configuration
possible
AO Transducer Block
DI2 Function Block
PST Man
Yes
Yes
Yes
PST Auto
No
Yes
PST testing mode
and Auto test time
only
PST Man
No
Yes
Yes
PST Auto
No
Yes
PST testing mode
and Auto test time
only
PST Man
Yes
Yes
Yes
PST Auto
No
Yes
PST testing mode
and Auto test time
only
Code 49 in parameter list
9
Code 49 in parameter list
Supplement to code list in section 15.1 of EB 8384-5 EN or EB 8387-5 EN
Code Parameters – display,
no. Values [default settings]
Note!
49
Description
Code 49 must be enabled for configuration first over Code 3. Refer to EB 8384-5 EN or
EB 8387-5 EN. The PST parameters (except for A2 and A3) can only be changed in the
PST Man testing mode.
PST parameters
A0 d4 - Start test
A1 Time until the next automatic
PST test
Display only
Time remaining until the next partial stroke test is started
(only applies in manual mode).
A2 Activation of auto test time
Auto - Man, [Man]
Activates or deactivates the automatic partial stroke test according to time
A3 Auto test time
1 to 56280 h, [1 h]
Required time for repeating a partial stroke test
A4 Status classification of Partial
Stroke Test - Status active
The following status classification are possible for a partial
stroke test that has not been completed successfully:
OK No message
C Maintenance required
CR Maintenance requested
b Maintenance alarm
OK · C · CR · b, [C]
A5 Recommended minimum scan
rate
Display only
The scan rate parameter (d9) should be configured to this
value at least.
A6 y_Min
Display of minimum y value from the last performed partial
stroke test.
Display only
A7 delta y-monitoring reference
value
Display only
Predetermined limit for y cancelation.
Automatically determined during the test.
A8 Activation of delta y-monitor.
Yes - No, [Yes]
Activates or deactivates the delta y-monitoring.
A9 delta y-monitoring value
0.0 to 100 % [10 %]
Safety factor added to the reference value.
EB 8388-5 EN
53
Code Parameters – display,
no. Values [default settings]
49
Description
d0 – Unassigned –
d1 – Unassigned –
d2 Step start
0.0 to 100.0 %, [100.0 %]
Start value for step response test
d3 Step end
0.0 to 100.0 %, [90.0 %]
End value for step response test
d4 Activation of the ramp function Activates or deactivates the ramp function.
Yes – No, [Yes]
d5 Ramp time (rising)
0 to 9999 s, [value determined during initialization,
minimum value: 15 s]
Ramp time for 0 to 100 % (rising) of the ramp function. A
suitable value is determined during initialization; if possible, make sure the ramp time does not fall below this
value.
d6 Ramp time (falling)
0 to 9999 s, [value determined during initialization,
minimum value: 15 s]
Ramp time for 100 to 0 % (falling) of the ramp function. A
suitable value is determined during initialization; if possible, make sure the ramp time does not fall below this
value.
d7 Settling time before test start
1 to 240 s, [10 s]
Delay time before test is started to ensure that the valve can
be moved to the step start position safely (t1, Fig. 14).
d8 Delay time after step
2.0 to 240 s, [2.0 s]
Delay time between the first and the second step change
(t2, Fig. 14).
d9 Scan rate
0.2 to 250 s, [0.2 s]
Scan rate of step response measurement
E0 Activation x control
Yes – No, [No]
Activates or deactivates x monitoring
E1 x control value
–10.0 to 110.0 %, [0.0 %]
The test is canceled when the valve position falls below this
value.
E2 – Unassigned –
E3 – Unassigned –
E4 – Unassigned –
E5 Activation PST tolerance band Activates or deactivates PST tolerance band monitoring
control
Yes – No, [Yes]
54
EB 8388-5 EN
Code 49 in parameter list
Code Parameters – display,
no. Values [default settings]
Description
49
E6 PST tolerance band
0.1 to 100.0 %, [5.0 %]
The test is canceled when the deviation of the valve position
exceeds this percentage.
49
E7 Max. test duration
30.0 to 25000.0 s, [30.0 s]
Maximum test duration; the test is canceled in any case
when this period has elapsed.
E8 – Unassigned –
E9 Reset PST
All PST parameters are reset to their default values. All
measured data are deleted.
PST error codes (display only)
F0 No test available
No test available or test canceled manually
F1 Test OK
F2 x cancelation
Test canceled by the x cancelation function
F3 y cancelation
Test canceled by the y cancelation function
F4 Tolerance band exceeded
The test has been canceled. x values outside the tolerance
band occurred
F5 Max. test time exceeded
Test not completed within the maximum test duration and
therefore canceled
F6 Test manually canceled
Test canceled by the user
F7 Measured data storage out of Storage for measured values out of memory. After 100
memory
measured values per measured variable, the logging is
stopped. However, the test is still continued.
F8 Int. solenoid valve/forced
venting
Type 3730-5: Test canceled because the solenoid valve has
been triggered
Type 3731-5: Test canceled because the forced venting has
been activated
F9 Supply pressure/ friction
Test canceled due to insufficient supply pressure or
excessive friction
EB 8388-5 EN
55
EB 8388-5 EN
S/Z 2008-08
SAMSON AG · MESS- UND REGELTECHNIK
Weismüllerstraße 3 · 60314 Frankfurt am Main · Germany
Phone: +49 69 4009-0 · Fax: +49 69 4009-1507
Internet: http://www.samson.de