1
Common Tasks
For details on the interface, see the Toaster Manual [https://www.yoctoproject.org/documentation/
toaster-manual].
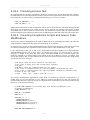
5.22.4. Stopping Toaster
Stop the Toaster service with the following command from with the Build Directory [14]:
$ source toaster stop
The service stops but the Toaster database remains persistent.
5.23. Profiling with OProfile
OProfile [http://oprofile.sourceforge.net/] is a statistical profiler well suited for finding performance
bottlenecks in both user-space software and in the kernel. This profiler provides answers to questions
like "Which functions does my application spend the most time in when doing X?" Because the
OpenEmbedded build system is well integrated with OProfile, it makes profiling applications on target
hardware straight forward.
Note
For
more
information
on
how
to
set
up
and
run
OProfile,
see
the
"oprofile
[http://www.yoctoproject.org/docs/1.7.1/profile-manual/profilemanual.html#profile-manual-oprofile]" section in the Yocto Project Profiling and Tracing
Manual.
To use OProfile, you need an image that has OProfile installed. The easiest way to do this is with
"tools-profile" in the IMAGE_FEATURES [http://www.yoctoproject.org/docs/1.7.1/ref-manual/
ref-manual.html#var-IMAGE_FEATURES] variable. You also need debugging symbols to be available
on the system where the analysis takes place. You can gain access to the symbols by using "dbgpkgs" in the IMAGE_FEATURES variable or by installing the appropriate debug (-dbg) packages.
For successful call graph analysis, the binaries must preserve the frame pointer register and
should also be compiled with the -fno-omit-framepointer flag. You can achieve this by
setting the SELECTED_OPTIMIZATION [http://www.yoctoproject.org/docs/1.7.1/ref-manual/
ref-manual.html#var-SELECTED_OPTIMIZATION] variable with the following options:
-fexpensive-optimizations
-fno-omit-framepointer
-frename-registers
-O2
You can also achieve it by setting the DEBUG_BUILD [http://www.yoctoproject.org/docs/1.7.1/
ref-manual/ref-manual.html#var-DEBUG_BUILD] variable to "1" in the local.conf configuration
file. If you use the DEBUG_BUILD variable, you also add extra debugging information that can make
the debug packages large.
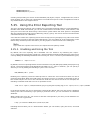
5.23.1. Profiling on the Target
Using OProfile, you can perform all the profiling work on the target device. A simple OProfile session
might look like the following:
# opcontrol ##reset
# opcontrol ##start ##separate=lib ##no-vmlinux -c 5
.
.
[do whatever is being profiled]
.
.
# opcontrol ##stop
138