1
TIBCO Spotfire DecisionSite 9.1.1 Statistics - User's Manual
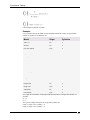
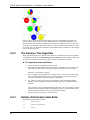
Group 3: Origin = USA; Cylinders = 4
Group 4: Origin = USA; Cylinders = 6
Group 5: Origin = USA; Cylinders = 8
Furthermore, for group 1 (Origin = EU; Cylinders = 4), we find that:
K1 = 6 (VW 1131, Sabb 99, Audi 100, Renault 12, Peugeot 504, VW Rabbit)
M1 = 8 (number of rows where Origin = EU, regardless of Cylinders)
N1 = 7 (number of rows where Cylinders = 4, regardless of Origin)
The p-value for this group of cars can be calculated as follows:
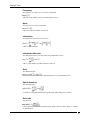
P1 = P(X ≥ 6 | 18, 7, 8) = 0.009049…
To find the most over represented groups of cars in the data set, we calculate the p-values for all
groups and sort the groups by ascending p-value:
P1 = 0.009049…
P5 = 0.011312…
P4 = 0.617647…
P2 = 0.774509…
P3 = 0.999748…
It should be noted that the largest groups are not necessarily the most over represented ones.
However, the low p-values for groups 1 and 5 show that, from a statistical point of view,
European cars with 4 cylinders and American cars with 8 cylinders are strongly over
represented in the data set. This information could perhaps be used to draw further conclusions
about the relationship between Origin and Cylinders.
8.4.3
Coincidence Testing References
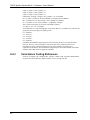
Tavazoie, S., Hughes, J.D., Campbell, M.J., Cho, R.J., Church, G.M., Systematic determination
of genetic network architecture, Nature Genetics, 22 (3), 1999, pp 281-285
64