1
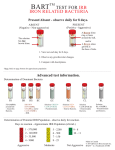
BART-SOFT v.5 Instructions
1. Introduction
BART-SOFT allows users of BART test kits to record, interpret and archive the
results of their BART tests.
Interpretations include predicted population
estimates, health, corrosion and plugging risk estimates, and a brief verbal
description of the composition of the microbial communities in samples being
tested. Data can be stored on disk or printed as a report. BART-SOFT provides
these services for the five most commonly used BART tester types: IRB, SRB,
SLYM, HAB and DN.
2. Compatibility
The following minimum system requirements must be met to install and use
BART-SOFT:
OS:
Processor:
RAM:
Hard Drive Space:
Windows XP, 2000, Me, 98 or 95
Pentium or higher
128 MB or higher
4 MB
Though it is not required to run BART-SOFT, it is recommended that all users of
BART products obtain the BART Manual, a guide to using BARTs. The BART
Manual is available for download from the Droycon website, www.dbi.ca, at no
charge.
3. Using BART-SOFT
The following instructions explain how to operate BART-SOFT.
3.1 Installing BART-SOFT
1. If you receive BART-SOFT as a compressed zip file, unzip it into a new
folder.
2. Run the setup.exe file. The setup program will begin.
3. From the first window of the setup program, select the folder you want to
install the program into. It is recommended that you do not install BARTSOFT into a folder where an earlier version was located. This will prevent
possible loss of data.
4. Click the button with the computer graphic on it to continue installation.
Follow the onscreen prompts.
5. If the install program asks you if you want to overwrite a file, click “No”.
6. When the install program is finished, BART-SOFT is now installed. You
can run BART-SOFT by clicking its icon in the program folder in the
Windows Start menu.
1
3.2 Setting up a sample
After starting BART-SOFT, you will be directed to the main screen. There are
four tabs at the top left of the screen, and three at the top right. Each one has a
different function which will be addressed later in this manual. We will deal with
setting up a sample first.
1. If you are not already on the “Set Up Sample” tab, click it now (you can set
up a sample at any time during a session; however, none of the other tabs
will be available until you have set up at least one sample).
2. Choose a sample name. Each sample name in a file must be unique, so if
you accidentally enter a sample name that is already used in the current
file, BART-SOFT will ask you to change it.
3. Now, enter general and specific locations. They pinpoint where the water
sample being tested was retrieved, with the specific location being located
within the general location. For example, the general location might be
“Clear Lake” and the specific location might be “public beach pier”. If you
are using a location that was previously entered in the file, it will appear in
the list below the location entry box; click it and it will appear in the entry
box.
4. Enter the start date and time, which are the date and time that the sample
was taken. Click on the start date and select the appropriate day from the
calendar that appears; click start time and select the sampling time (to the
closest fifteen minutes) from the list. BART-SOFT uses a 24-hour clock.
5. Select the incubation temperature. The temperature at which the BARTs
are incubated affects the interpretation, so you should incubate and
monitor them at one of the four temperatures listed. The most common
temperature selected is room temperature, normally 22o C
6. There are two buttons that will create a sample. Click either the button
labeled “Click to Create a Normal (non-ZIP) Sample” or the one labeled
“Click to Create a ZIP Sample”. For most users, the former button is the
one to use, as it will create a single sample. A description of ZIP samples,
which include multiple water sources, will be provided later in this
document.
3.3 Entering Data
To enter data for a sample, select the “Enter Sample Data” tab. The current
sample name and description will appear at the top left of the tab.
Remember that all BARTs entered here are to have come from the same water
source (if you are not using a ZIP sample). If you are entering some BARTs that
come from a different location, or for which a different sample from the same
location was the source, you should create a separate sample file as described in
2
the preceding section.
incubation temperature.
Double-check that you have selected the correct
To create a BART: Click the button with the name of the BART tester type you
want to include. If you did three IRB BART tests on the sample, click the IRB
button three times. You can enter up to ten instances for each BART type for a
single sample. The BART name will appear in the “ID” column and the number
of the replication will appear in the “ID#” column.
To enter a reaction code: Reactions can commonly occur from one up to ten
days after the BART tester has begun incubation. Days one to ten correspond to
the columns labeled one to ten. If you have a reaction occur on day four for the
BART listed in row two, right-click the column labeled “4” in row two. A list will
appear showing the possible reaction codes (see the BART Manual for a
description of reaction codes). Select the appropriate code from the list by
clicking it.
The quicker the first reaction occurs during incubation, the more aggressive the
microbial community. BART-SOFT will colour the days leading up to the first
displayed reaction code red if the interpretation indicates high aggressivity,
yellow for medium aggressivity, and green for low aggressivity. See the BART
manual for a description of aggressivity (activity).
You can enter up to two reaction codes per day. Each BART type has a limit on
how many reaction codes can be entered; for example, IRB and SLYM limit you
to a maximum of six reaction codes. You can only enter each specific reaction
code once per BART, so enter it on the day when it first appears. If you need to
erase a reaction code, right click it and select “Remove Reaction Code”. The
reaction codes on that day will be erased and you can re-enter as required.
To make notes on your tests: There are two places to do this. You can type
comments for the whole sample in the “Comment” box (top right of the tab). You
can also enter comments pertaining to each individual BART in the “Notes”
column to the right of every BARTs data row. You cannot use the characters “;”,
“~”, “<” or “>”, as these are reserved by BART-SOFT for internal use.
To select or delete a BART: You will notice a circle to the left of each individual
BARTs row. Click the circle to select it (it will fill in), and that BART tester is
selected. You can delete the selected BART by clicking “Delete Current”. Note
that this particular action cannot be undone.
3.4 Navigating the File
If you have created multiple samples, you can switch between them. Click the
“Navigate Tab”, found in the right three tabs at the top of the window.
3
How to find a sample: Samples are presented as a list. For each sample, you
will see (from left to right) the Sample Name, Specific Location, General Location
and Start Date. Start Date is initially invisible; either scroll to the left of the list to
see it or click the button labeled “<<” at the bottom of the tab. Clicking this button
will expand the list to show the date (you can set it back to normal by clicking the
same button, now labeled “>>”.
Scroll through the samples until you find the one you want. Just click the Sample
Name to select and view that sample’s data.
You can sort any of the four columns in the list alphabetically by clicking the
column header. This can, for example, allow you to find all BARTs from the
same specific location (click “Spec. Loc.”), or arrange your list by sampling date
(click “Start Date”).
How to delete a sample: Click on the Sample Name (so it is highlighted) and
then click “Delete Selected Sample” at the bottom of the Navigate tab. This
action cannot be undone.
3.5 Interpreting a BART
To interpret the results of a BART or group of BARTs from the same sample,
select the “Interpret” tab found in the right three tabs.
To interpret a single BART: Select the BART you want to interpret on the “Enter
Sample Data” tab (click the circle to its left). Click the Interpret button on the
“Interpret” tab. The top half of the Interpret tab will display a population estimate,
and aggressivity (activity) value and a verbal description.
Population estimates are presented in p.a.c. / ml (or predicted active cells per
milliliter of sample). This estimate applies to the sample at the time it was taken
from the water source. Aggressivity represents how active the microbial
community is. For more detailed descriptions, consult the BART Manual.
The “Interpretation of Reaction Pattern Sequence” box will contain a description
of the possible bacterial contents of your sample for that test. The text is based
on the reaction codes entered.
To calculate Plugging, Corrosion and Health risks: The values of these risk
factors are based on the results of every BART in the currently-displayed sample.
Therefore, the risk values will shift until all of the data has been collected.
To calculate risk factors, select the check box above the risk factor names on the
Interpret tab, and then click the “Interpret” button. Values that appear will range
from 0 (low risk) to 9 (high risk).
4
3.6 Saving and Opening Files
The “File” menu (at the top left of the window) contains controls for saving the
data entered. When selecting “Save” or “Save As”, BART-SOFT will save a file
(extension “.bt5”) which contains all sample data in the current file. When the file
is opened at a later time, all data will be loaded and the user can edit or view
them as before. Use the “Navigate” tab to find specific samples.
BART-SOFT can be shut down by selecting “Exit” from the file menu.
program can also be exited by closing the main window.
The
3.7 ZIP (Zone of Interrogation Prediction) Samples
The ZIP function in BART-SOFT can determine where biofouling is occurring.
ZIP Samples are created in association with sequenced pump tests at well sites.
A pump test is a procedure that involves pumping water out of a well and taking
samples of the water at predefined times (called “pump times”) measured from
the moment that pumping begins. Samples taken at earlier pump times originate
from water that is closer to the well shaft, and samples taken at later pump times
come from further out. BART-Soft can graphically present these zones around
the well, showing the degree of microbial infestation in each of the zones.
To create a ZIP Chart: Create the sample in the “Set Up Sample” tab in the
manner described in 3.2, but do not select “Click to Create a Normal (non-ZIP)
sample”. Instead, enter up to six pump times, in minutes, below the button “Click
to Create a ZIP Sample”. For example, if three samples were taken during the
pump test, one at five minutes after pumping began, one at ten minutes, and one
at twenty minutes, enter the numeric characters “5”, “10”, and “20” in the boxes.
Use only integer numeric values. It is now possible to create the sample record
by clicking “Click to Create a ZIP Sample”. Here the ZIP file would have three
sets of samples, one set for each pump time.
To add BARTs to a ZIP Chart: The same BART types must appear for all pump
samples. In the “Enter Sample Data” tab, click each BART type that is being
used. Multiple instances of each type will appear, one for each pump time.
Reaction codes can be added as described above; however, notes cannot be
added to individual BART rows since the notes already contain the pump time in
a ZIP sample.
Viewing a ZIP Chart: When all BART data has been collected, then the ZIP chart
can be viewed. Click “ZIP Chart” from the tabs to the left. Each BART type used
in the pump test will have a corresponding ZIP chart graphic.
On each chart, a vertical black rectangle represents the well shaft. There will be
a series of concentric ovals around the shaft, the same as the number of pump
times. The innermost oval represents the earliest pump time and the closest
5
proximity to the well shaft, the next closest represents the next earliest pump
time and so forth until the widest circle represents the longest pump time and
furthest distance from the borehole.
The colour of an oval indicates the aggressivity of the corresponding BART. This
colour suggests the degree of infestation around the well. For example, if the
inner rings of your SLYM ZIP chart are red, and the outer are green, then there
are more active slime-forming bacteria close to the well than away from it. If the
IRB ZIP chart is green on the outermost ring and white further in, then iron
bacteria are not present close to the well shaft but are present some distance
away (white rings correspond to BARTs where no reactions were observed).
Viewing a legend: Click the ZIP Legend tab to the right on the screen to see the
pump times and other descriptive data pertaining to the ZIP sample.
Printing a ZIP Chart: Print by clicking the “Print ZIP Chart” button on the “ZIP
Chart” tab. When printing to a black and white printer, select the option “Print to a
black and white printer” so that higher aggressivities are displayed as darker
colours. Click “Save Chart as Image File” to create a JPEG graphics file of the
ZIP Charts.
3.8 Outputting Data
To print a summary of the data, or to save the printout as a text file, go to the
“Save Report” tab.
Selecting what to print: Users can select some or all of your samples to print.
Click “Show checkboxes on Navigate panel sample list” and check boxes will
appear to the left of each sample in your list. Check the ones corresponding to
samples to be printed, or click “Select All Samples” to print all of them.
Printing: Clicking “Print Report” will print the selected samples to the selected
printer. Clicking “Save Report as a Text File”, allows the user to save the report
as a text file.
Select the “Add interpretations to report” option to include the interpretation of
each BART in the text of the report. This may considerably extend the report
length.
Importing into a spreadsheet: Click the button labeled “Save Report as a Text
File (Excel-compatible)”, to create a specially-formatted text file that can be
opened in a spreadsheet such as Microsoft Excel.
To open the file in a spreadsheet program, import the text file created in your
spreadsheet. The conversion program of the spreadsheet will ask what
delimiters to use. The delimiter that BART-SOFT uses is the semicolon, “;”.
6
Select this and only this as the delimiter and the spreadsheet will arrange the
BART-SOFT data into rows and columns correctly. The BART-SOFT file can
now be read in spreadsheet format.
For more information about BART-SOFT and other products and services
provided by Droycon Bioconcepts Inc, please contact:
Droycon Bioconcepts, Inc.
315 Dewdney Avenue
Regina, SK
Canada S4N 0E7
Tel:
Fax:
(306) 585-1762
(306) 585-3000
Web:
Email:
www.dbi.ca
[email protected]
7