1
Electric Vehicle Telemetry
John Pearce
Supervisor: Professor Thomas Bräunl
Thesis submitted as part of the B.E. degree
in the School of Electrical, Electronic and Computer Engineering,
University of Western Australia
Date of submission: 29/10/10
John Pearce
24B Doney St
ALFRED COVE WA 6154
10/23/10
Winthrop Professor John Dell
Dean
Faculty of Engineering, Computing and Mathematics
The University of Western Australia
35 Stirling Highway
CRAWLEY WA 6009
Dear Winthrop Professor John Dell,
I submit to you this dissertation entitled “Electric Vehicle Telemetry” in partial
fulfillment of the requirement of the award of Bachelor of Engineering component
of the Bachelor of Computer Science / Bachelor of Engineering combined degree at
the University of Western Australia.
Yours faithfully,
John Pearce
10504036
Abstract
In early March the Western Australian electric vehicle state trial was launched and
will comprise of ten converted electric cars. These cars will be used as regular fleet
vehicles in various companies and government departments over a period of two
years. To be able to effectively research the impact these cars have within a fleet
and upon their drivers a system to remotely monitor the cars has been developed.
Based upon GSM and GPRS technologies the system is able to monitor the car’s
status, from whether the headlights are being used to when, where and how much
power is being used to charge the car. Detailed and summary statistical information
is then able to be made instantly available to researchers. The first of these cars is
currently in the final stages of completion.
Acknowledgments
I would like to formally acknowledge the following people, who have made this thesis
and project possible.
Professor Thomas Bräunl, for the opportunity by providing this project and his
guidance throughout the year.
The current and past members of the REV Team, for their support and dedication to the renewable energy vehicle project, with special mention to Ian Hooper
and Jonathan Wan for their assistance and knowledge.
Tom Hallam, the EECE Information Systems Manager, for his input and support
with deploying components of this project to the EECE department’s servers.
Rob Mason of EV Works Pty Ltd, for help integrating this project with a WA
State EV Trial vehicle.
Phil Vella of Astra Telematics Limited, for detailed unpublished information on
the implementation of the features in the AT100.
Contents
1 Introduction
1.1
1.2
1
Background . . . . . . . . . . . . . . . . . . . . . . . . . . . . . . . .
1
1.1.1
Overview . . . . . . . . . . . . . . . . . . . . . . . . . . . . .
1
1.1.2
Technology . . . . . . . . . . . . . . . . . . . . . . . . . . . .
1
1.1.3
Vehicles . . . . . . . . . . . . . . . . . . . . . . . . . . . . . .
2
1.1.3.1
REV Lotus Elise . . . . . . . . . . . . . . . . . . . .
2
1.1.3.2
REV Hyundai Getz
. . . . . . . . . . . . . . . . . .
2
1.1.3.3
WA State Trial Ford Focus . . . . . . . . . . . . . .
2
Engineering Problem . . . . . . . . . . . . . . . . . . . . . . . . . . .
3
2 Vehicle Hardware
2.1
2.2
2.3
Background . . . . . . . . . . . . . . . . . . . . . . . . . . . . . . . .
4
2.1.1
Commercial Tracking Hardware . . . . . . . . . . . . . . . . .
4
2.1.2
GPS Distance Accuracy . . . . . . . . . . . . . . . . . . . . .
4
Astra Telematics AT100 . . . . . . . . . . . . . . . . . . . . . . . . .
6
2.2.1
Specifications . . . . . . . . . . . . . . . . . . . . . . . . . . .
6
2.2.2
Vehicle Interfacing . . . . . . . . . . . . . . . . . . . . . . . .
6
Janus-RC Terminus . . . . . . . . . . . . . . . . . . . . . . . . . . . .
9
2.3.1
Specifications . . . . . . . . . . . . . . . . . . . . . . . . . . .
9
2.3.2
Design . . . . . . . . . . . . . . . . . . . . . . . . . . . . . . .
9
2.3.3
Vehicle Interfacing . . . . . . . . . . . . . . . . . . . . . . . . 10
2.3.3.1
2.4
4
Charge Current Monitoring . . . . . . . . . . . . . . 11
On-board Vehicle Computers . . . . . . . . . . . . . . . . . . . . . . . 12
3 Telemetry Back-end
3.1
3.2
13
Background . . . . . . . . . . . . . . . . . . . . . . . . . . . . . . . . 13
3.1.1
Goals . . . . . . . . . . . . . . . . . . . . . . . . . . . . . . . . 13
3.1.2
Requirements . . . . . . . . . . . . . . . . . . . . . . . . . . . 13
Design . . . . . . . . . . . . . . . . . . . . . . . . . . . . . . . . . . . 14
i
ii
3.2.1
3.2.2
TCP Server . . . . . . . . . . . . . . . . . . . . . . . . . . . . 14
3.2.1.1
Programming Language . . . . . . . . . . . . . . . . 14
3.2.1.2
Implementation . . . . . . . . . . . . . . . . . . . . . 15
Database
. . . . . . . . . . . . . . . . . . . . . . . . . . . . . 17
3.2.2.1
Structure . . . . . . . . . . . . . . . . . . . . . . . . 18
3.2.2.2
Batch Processing . . . . . . . . . . . . . . . . . . . . 18
4 Telemetry Front-end
20
4.1
Background . . . . . . . . . . . . . . . . . . . . . . . . . . . . . . . . 20
4.2
Design . . . . . . . . . . . . . . . . . . . . . . . . . . . . . . . . . . . 20
4.2.1
SproutCore . . . . . . . . . . . . . . . . . . . . . . . . . . . . 20
4.2.2
Google Maps . . . . . . . . . . . . . . . . . . . . . . . . . . . 21
4.2.3
Telemetry Desktop . . . . . . . . . . . . . . . . . . . . . . . . 21
4.2.4
Telemetry Mobile . . . . . . . . . . . . . . . . . . . . . . . . . 22
5 Conclusions
5.1
24
Future Work . . . . . . . . . . . . . . . . . . . . . . . . . . . . . . . . 24
References
26
A Schematics
29
B AT100 Settings
32
C Telemetry Protocol
33
D Database Schema
37
E Source Code
39
E.1 Python TCP Server . . . . . . . . . . . . . . . . . . . . . . . . . . . . 39
E.2 PHP Desktop Web Service . . . . . . . . . . . . . . . . . . . . . . . . 42
E.3 PHP Mobile Debug Web Service . . . . . . . . . . . . . . . . . . . . . 43
List of Figures
1.1
The REV Project Road Vehicles . . . . . . . . . . . . . . . . . . . . .
2
2.1
GPS Undersampling . . . . . . . . . . . . . . . . . . . . . . . . . . .
5
2.2
EV Works Fuel Gauge Driver . . . . . . . . . . . . . . . . . . . . . .
7
2.3
PWM Low Pass Filter . . . . . . . . . . . . . . . . . . . . . . . . . .
7
2.4
PWM Low Pass Filter Response . . . . . . . . . . . . . . . . . . . . .
8
2.5
Terminus Software Flow Diagram . . . . . . . . . . . . . . . . . . . . 10
2.6
i-Snail Current Transducer . . . . . . . . . . . . . . . . . . . . . . . . 11
3.1
TCP Server Flow Diagram . . . . . . . . . . . . . . . . . . . . . . . . 15
3.2
Telemetry Database Table Structure . . . . . . . . . . . . . . . . . . 17
4.1
Smart-phone Market Share 2Q2010 [1] . . . . . . . . . . . . . . . . . 21
4.2
Telemetry Desktop Web-page . . . . . . . . . . . . . . . . . . . . . . 22
4.3
Telemetry Mobile Web-page . . . . . . . . . . . . . . . . . . . . . . . 23
A.1 Terminus Interface Board Schematic
. . . . . . . . . . . . . . . . . . 30
A.2 Terminus Interface Board Strip Board Layout . . . . . . . . . . . . . 31
B.1 AT100 Application Parameters . . . . . . . . . . . . . . . . . . . . . 32
D.1 PostgreSQL Telemetry Database Schema . . . . . . . . . . . . . . . . 38
iii
List of Tables
2.1
AT100 Specifications [4] . . . . . . . . . . . . . . . . . . . . . . . . .
6
2.2
AT100 Digital Input Connections . . . . . . . . . . . . . . . . . . . .
6
2.3
Terminus Specifications [2] . . . . . . . . . . . . . . . . . . . . . . . .
9
C.1 Telemetry Protocol Data . . . . . . . . . . . . . . . . . . . . . . . . . 34
iv
Nomenclature
3G
Third generation telecommunications standard
3NF Third Normal Form
AC
Alternating Current
ADC Analog to Digital Converter
API
Application Programming Interface
AT
Command set for modem communication
CMOS Complementary Metal Oxide Semiconductor
CRC Cyclic Redundancy Check
Cron A time-based job scheduler
CSV Comma Seperated Values
Daemon Disk and Execution Monitor, a program that runs as a background process
DBMS Database Management System
DC
Direct Current
DIO Digital Input/Output
EECE School of Electrical, Electronic and Computer Engineering at the University
of Western Australia
EV
Electric Vehicle
GPRS General packet radio service, second generation packet mobile data standard
GPS Global Positioning System
v
LIST OF TABLES
vi
GSM Global System for Mobile Communications, the most common standard for
mobile telephone systems worldwide
GUI
Graphical User Interface
IANA Internet Assigned Numbers Authority
IMEI International Mobile Equipment Identity, a unique number for every GSM
mobile device
JSON JavaScript Object Notation
MVC Model View Controller
PostgreSQL An object-relational database management system
PWM Pulse Width Modulation
Python A computer scripting language
REV Renewable Energy Vehicle
RMS Root Mean Squared
RS232 Standard for serial communication
Schema A database structure defined in a formal language understood by a DBMS
SMS Short Message Service
SQL Structured Query Language
TCP Transmission Control Protocol
Telemetry Automatic transmission and measurement of data from remote sources
Traction Pack Battery pack of an electric vehicle
Chapter 1
Introduction
1.1
1.1.1
Background
Overview
The REV Project at the University of Western Australia is an ongoing set of student
projects focused on creating a vehicle running entirely on renewable energy. From
the REV Project’s vehicles this project will focus on data from the electric Hyundai
Getz and Lotus Elise. In early March the Western Australian EV state trial was
launched and will comprise of around 10 converted electric cars. Later in the year
around 10 EV charging bays will be installed around the city. Collecting usage data
from the cars and charging stations will be vital to the research being carried out
as part of this trial.
1.1.2
Technology
As the cars and charging stations will be spread over the city and in the case of
the cars, mobile, a wireless data collection method with be required. A number
of GPS/GSM telemetry units are commercially available, mostly being targeted at
fleet location and delivery monitoring. These units generally support a range of
digital and analog inputs that can be monitored. The majority of these units are
tied to the manufacturers back-end system and are only offered with a subscription.
1
1 Introduction
2
Figure 1.1: The REV Project Road Vehicles
1.1.3
Vehicles
1.1.3.1
REV Lotus Elise
The 2002 Lotus Elise, known as the REV Racer, was a new addition to the REV
Project in 2009. The project was an electric conversion of a sports car aimed proving
electric vehicles are not just all about efficiency. The 116kW internal combustion
engine was replaced with a UQM Power Phase 75 electric motor. The UQM motor
is able to produce a maximum of 75kW of power with a constant torque band from
0 - 4500rpm. The vehicle is fitted with a dual core Intel Atom car PC running
Microsoft Windows XP with 3G wireless connectivity.
1.1.3.2
REV Hyundai Getz
In 2008 the REV Team converted a Hyundai Getz to an electric vehicle, now known
as the REV Eco. The internal combustion engine was replaced with an Advanced
DC FB1-4001A DC electric motor, producing a maximum power of 39kW. The Getz
has an EyeBot Mk6 built into the dash for data acquisition, instrumentation and
display. The EyeBot is also connected to the 3G wireless network.
1.1.3.3
WA State Trial Ford Focus
As part of the WA State EV Trial a number of Ford Focuses will be converted to
electric vehicles. Unlike the vehicles that are part of the REV Project the Focuses
will not have advanced on-board computers. The only additional EV instrumentation will be an EV Works Fuel Gauge Driver to show the battery charge level on the
vehicle’s fuel gauge. The first of the converted Ford Focuses has been range tested
to a distance of 131km of combined urban and highway driving on a single charge.
Once the electric Ford Focuses are deployed to the various fleets that are part of the
1 Introduction
3
trial, it is expected that there will be significantly more daily driving data generated
than from the REV Project vehicles.
1.2
Engineering Problem
To research the performance of electric vehicles and the behavior of their drivers
a logging system is needed. Any logging performed manually by drivers or other
agents would be considered an inconvenience and likely not be comprehensive. To
solve this a telemetry system will be implemented to log data including, journeys
taken, location of the car, battery charge, driving aggressiveness, energy and time
used to charge the car, usage of EV charging stations. This data will then be made
available in some minimally processed format for use in research as well as processed
to be easily accessible online by the general public to help promote both the REV
Project and WA State EV Trial.
Chapter 2
Vehicle Hardware
2.1
2.1.1
Background
Commercial Tracking Hardware
A number of vehicle tracking hardware solutions exist on the marketplace ranging in
price from $150 to almost $1000, with many supplied only as part of a subscription
service. The cheaper models tend not to support any inputs or outputs and only
report their position over SMS when polled. Whereas the most expensive models
often have touch-screen displays and are targeted at advanced telemetry applications, such as taxi fleets. In the middle of the range fall the appropriate tracking
units for this application. These units have a variety of digital and analog inputs,
communicate via GPRS, support either a simple scripting language or implement
a specific protocol. The Astra Telematics AT100 was evaluated to be the most appropriate unit, primarily due to its excellent documentation and quick availability.
After the AT100 implementation was completed work began on a second tracker,
the Janus-RC Terminus, which would take longer to implement but ultimately prove
more flexible.
2.1.2
GPS Distance Accuracy
A 2004 trial of a GPS based vehicle distance measurement system for the Oregon
Department of Transportation found a 6% discrepancy between the distance traveled
reported by a GPS device and the vehicle’s odometer, the GPS device reporting a
lower value [3]. This was attributed to two main issues
1. GPS Signal Blockage
4
2 Vehicle Hardware
5
Figure 2.1: GPS Undersampling
2. GPS Position Undersampling
The issue of signal blockage can be reduced by using better antennas, placed with a
clear view of the sky. Newer GPS receivers are able to handle a lower signal-to-noise
ratio and make use of multi-path reflections to improve signal strength.
Position undersampling is a harder issue to solve, while GPS receivers are available with up to 10Hz sampling frequencies such a high rate is not suitable for telemetry applications due to the large amount of data produced. For long range telemetry
applications rates of between 0.1 - 0.01Hz are generally the highest sampling frequencies possible. The effects of position undersampling can be seen in figure 2.1,
which shows the actual path on the left compared to the path generated from the
GPS positions recorded. The undersamping has the effect of cutting corners from
the actual path, thus always reporting a traveled distance lower than the actual
distance. The distance error is inversely proportional to the position sampling frequency. This effect was confirmed during a range test of the EV State Trial Ford
Focus, over a distance of 131km as reported by the vehicles odometer the GPS total
distance was measured at the server to be 126km, a decrease of 4% as calculated by
the telemetry back-end. The range test was carried out with the AT100 configured
as listed in figure B.1.
2 Vehicle Hardware
2.2
6
Astra Telematics AT100
2.2.1
Specifications
Input Voltage
6-30VDC
Inputs
6 digital (opto-coupled), 1 ADC (10 bit resolution)
Outputs
1 load switch (max 0.5A, 30V)
RS232
Yes
GSM
Quad band, 2G, GPRS
GPS
12 channels
Power Consumption
308mW (avg)
Scripting
None
Cost
~$340AUD
Table 2.1: AT100 Specifications [4]
2.2.2
Vehicle Interfacing
The AT100 is designed for direct connection to the power supply of a vehicle and
can tolerate input voltages between 6 - 30VDC. Due to its low power consumption
the AT100 can be wired to a power circuit that is powered even when the vehicle’s
ignition is off without significant drain on the batteries.
Digital Input
1
2
3
4
5
6
Connection
Ignition sense
Alarm/Panic button (if included)
Air-conditioner power
Heater power
Headlights power
Charging status
Table 2.2: AT100 Digital Input Connections
The connections for the digital inputs of the AT100 are show in table 2.2. The
AT100’s digital inputs are optically isolated and de-bounced internally. The maximum input voltage is 30V, with a turn-on voltage of 1.5V and input impedance
> 100kΩ. As the EV State Trial Ford Focus has a power system of 13.5V and the
AT100 has a high input impedance the digital inputs can be connected directly to
the power lines for the devices being monitored.
2 Vehicle Hardware
7
Figure 2.2: EV Works Fuel Gauge Driver
It has been determined that the EV State Trial Ford Focus will use the EV
Works Fuel Gauge Driver to measure and display the immediate battery level via
the vehicles fuel gauge. The FGD (Fuel Gauge Driver) generates a 500Hz 13.5V
PWM signal to drive the fuel gauge between 0 - 100%. As the digital input sampling
frequency of the AT100 is only equivalent to the GPS reporting frequency it is far
too low to measure the PWM signal directly. Instead the AT100’s ADC input is
driven by the fuel gauge driver through a low-pass RC filter.
fc =
1
=⇒ fc =< 1Hz
2πRC
R1
To ADC
V1
2000
C1
0.00022
R2
430
0
Figure 2.3: PWM Low Pass Filter
Figure 2.3 shows the low-pass filter designed for the FGD, R1 and C1 form
the RC low-pass filter. As the battery percentage will only change slowly and the
2 Vehicle Hardware
8
sampling frequency is very low, the priorities become minimising overshoot and
passband ripple. So the filter is designed such that fP W M = K × fc =⇒ K 1 [5].
As the AT100’s ADC input is rated for 0 - 2.6V the output of the low-pass filter
must be scaled to this range with a voltage divider. The low-pass filter outputs a
value between 0 - 13.5V so a scaling factor of ~0.1926 is required.
Vout
R2
=
Vin
R1 + R2
Since R1 is already known to be 2kΩ from the low-pass filter, R2 is calculated
to be ~477Ω, which is rounded down to the nearest readily available resistor size of
430Ω. The Pspice plot for a 50% duty-cycle PWM input can be seen in figure 2.4.
From the plot the rise time is < 1 second and the pass-band ripple <0.5%, both
values better than the accuracy of AT100.
V
o
l
t
a
g
e
1.5V
1.0V
0.5V
0V
0s
0.5s
V(R2:2)
1.0s
1.5s
2.0s
2.5s
3.0s
3.5s
4.0s
Time
Figure 2.4: PWM Low Pass Filter Response
4.5s
5.0s
2 Vehicle Hardware
2.3
9
Janus-RC Terminus
2.3.1
Specifications
Input Voltage
7.5-35VDC
Inputs
9 digital (bi-directional), 1 ADC (11 bit resolution)
Outputs
9 CMOS level (bi-directional)
RS232
Yes
GSM
Quad band, 2G, GPRS
GPS
16 channels
Power Consumption
300mW (avg)
Scripting
Yes, Python
Cost
$318.95
Table 2.3: Terminus Specifications [2]
2.3.2
Design
Instead of being fixed to a particular protocol the Terminus has an on-board Python
interpreter to handle its operation. A Python script to implement a protocol ’R’
client was developed for the Terminus following the basic program flow shown in
figure 2.5. The Terminus program is based around the vehicle’s ignition and charging states. The program loops checking if the ignition has been turned on or if a
charging current is flowing. If a charging current is flowing reports detailing the
charge are sent every minute. Otherwise, if the ignition has been turned on the
program waits for the appropriate reporting interval to elapse, generates a report
then queues it for transmission. Smart reporting intervals have been implemented,
rather than just a fixed time interval report, reports can be sent upon certain heading or distance changes. This allows for efficient use of the data allowance while
also reducing the error caused by undersampling. Reports sent based upon distance
and heading change intervals are able to more accurately capture the path of the
vehicle, especially when it is moving a varying speeds, or turning often.
So as to ensure reports are sent from the tracker and successfully stored in a
database the program implements a queue with a 1MB circular buffer of reports,
enough to store >10,000 reports. After reports are generated they are added to the
queue for sequential transmission. If the tracker is unable to connect to the server
the report will be re-queued and tried again later until either it is successfully sent
or the circular buffer causes it to be erased. Alternatively if the tracker is able to
connect to the server and send a report it will receive either an ACK or NAK in
response. If the server was able to correctly decode the report and store it into the
2 Vehicle Hardware
10
database the tracker will receive an ACK and can the remove the report from the
queue. However, if the server was unable to decode the report or store it in the
database it would send a NAK and the tracker would re-queue the report to try
again later. If a single report receives a NAK three times it will be assumed to have
been corrupted on the tracker and removed from the queue so that newer reports
may begin being sent. This system ensures data integrity in that the server will only
allow the tracker to remove a valid report from its memory after it is successfully
stored in the database.
Ignition on?
No
Wait 1 minutes
Yes
Wait for distance/heading/
time interval to elapse
Read charging current
Read sensor values
Generate report packet
Add packet to transmit
queue
Transmit packet from
queue
NAK
Requeue packet
ACK
Remove packet from
queue
Yes
Queue empty?
No
Figure 2.5: Terminus Software Flow Diagram
2.3.3
Vehicle Interfacing
Unlike the AT100 the Terminus is not ready out of the box to integrate directly into a
vehicle and requires more than just voltage scaling. Another issue with most tracking
products, the AT100 and Terminus included, is that they only include a single ADC
input so an interface board for the Terminus was designed to multiplex the ADC
input and handle the voltage comparisons to drive the CMOS level inputs. The
complete schematic for the interface board is included as figure D.1. The Terminus
has 9 bi-directional digital input/outputs operating at CMOS level, 8 of the DIOs
2 Vehicle Hardware
11
will be designated as inputs, while the remaining one will be used as an output to
drive the select line of a CD4051BC 8-channel analog multiplexer. The CD4051BC
is composed of digitally controlled analog switches with low ON impedance and very
low OFF leakage currents [6]. All signals passing through the CD4051BC will be
DC so the frequency response characteristics of the device are irrelevant. The two
signals going through the multiplexer will be a low-pass filtered PWM FGD signal
as above in the AT100 interface, and a 0 - 5V voltage level generated by a current
transducer. Both signals will be scaled with voltage dividers down to the range of 0
- 2.8V before entering the multiplexer. The multiplexer can handle up to 8 analog
inputs and only simple modifications to the circuit are required to connect extra
DIOs configured as outputs to the select lines of the multiplexer.
The 8 DIOs configured as inputs are connected to the power lines of the various
devices in the vehicle to be monitored via two LM339 low power low offset voltage
quad comparators. The voltage comparators are implemented as basic comparators
driving CMOS logic as per [7]. The way the comparators are biased sets their turnon voltages to
Vcc
2
and allows a maximum voltage of Vcc . This setup affords for a high
level of electromagnetic noise immunity and allows for the inputs to be connected
directly to the power lines for the devices they are monitoring.
2.3.3.1
Charge Current Monitoring
Figure 2.6: i-Snail Current Transducer
To determine how much energy the electric vehicle uses when charging, and to
confirm the charging status, an i-Snail VC-25 is connected to the interface board.
The i-Snail VC-25 is a self powered AC current transducer that provides a 0 - 5V
DC analog signal proportional to the AC current flowing through the device [8].
2 Vehicle Hardware
12
AC Amps (RM S) = SensorV oltage × 5
One conductor from the power input to the battery charger is wired through the
hole in the center of the i-Snail, from this we can measure the AC Amperes (RMS)
being used by the battery charger. ProTech, the makers of the battery charger used
in the electric Ford Focus have confirmed the power factor of the battery charger
as ~0.999 and that if in the future the charger is setup for 3-phase charging all
three phases will draw the same amount of current. As the mains voltage is a
known value of 230VAC power consumption can be accurately estimated using the
following formula. Recorded values for each minute of charger can then be integrated
over at the server-side to calculate the amount of energy consumed by the electric
vehicle.
P =V ×I
2.4
On-board Vehicle Computers
For the vehicles with on-board computers such as the REV Project’s Hyundai Getz
and Lotus Elise a dedicated tracking unit is not required. The on-board computers
in each vehicle are able to interface with the telemetry back-end using protocol ’R’
as given in figure C.1. By design these computers are already interfaced with the
various sensors in the vehicle and have both GPS receivers and GSM connectivity.
As each vehicle has a different number of sensors the telemetry protocol supports
reporting with a variable number of digital and analog values, when needed scaling
is applied on the server-side.
The downside to using the on-board computers for telemetry is that they consume considerably more power than dedicated tracker units. The EyeBot in the
Hyundai Getz averages 4.8W when active [9], compared to the 308mW average
consumption of the AT100. Due to the high power consumption the on-board computers are not left on when parked and not always turned on when driving, resulting
in sporadic telemetry data. The system has been designed to identify trackers by
their IMEI number rather than vehicle, allowing a vehicle to use both the on-board
computer and a dedicated hardware tracker simultaneously. This approach allows
the extended sensor data from the on-board computer to be recorded along with the
more stable telemetry data from the hardware tracker.
Chapter 3
Telemetry Back-end
3.1
Background
3.1.1
Goals
The primary purpose of the telemetry back-end is to be able to collect and minimally process telemetry data for storage. Telemetry data could be generated by any
number of electric vehicles or infrastructure components with varying packet sizes
and reporting intervals.
3.1.2
Requirements
The telemetry back-end design was restricted by a number of requirements as listed
below.
1. Support the AT100 tracker
2. Support advanced tracker clients, including the Getz and Lotus
3. Be extensible to support telemetry data from EV infrastructure components,
for example charging stations
4. Designed to support at least 25 simultaneous clients
5. Keep data transfer to a minimum, under 12GB per year per tracker
6. Hosted at either therevproject.com or EECE servers
13
3 Telemetry Back-end
3.2
14
Design
The design of the telemetry back-end can be broken into two major components; the
TCP server and database. This separation between the data processing logic of the
TCP server and storage facilities of the database make the telemetry back-end more
flexible. From the TCP server’s point of view minimal modifications are required
to change to a different database technology or location. A separate standards
compliant database allows other researchers direct access to the raw tracking data,
using readily available tools, for any advanced processing outside of the scope of this
project.
3.2.1
TCP Server
As one of the requirements was to support the AT100 a dedicated TCP server was
needed, this limited the platforms the server could reside on. The hosting provided
by therevproject.com supports only PHP and CGI scripts that are initiated by a
client over HTTP, thus could not be left listening on a arbitrary TCP port with a
specialised protocol. Due to this hosting the server software at therevproject.com
was ruled out as an option, leaving only the EECE server. The EECE server that
we were provided access with to use for this project was a Xen Linux 2.6.26 i686
virtual server. Installed on the EECE server are interpreters for Perl, PHP and
Python each with the required database abstraction libraries. The option to use
x86 compiled binaries was also available.
3.2.1.1
Programming Language
The decision was made to use Python as the language to implement the TCP server.
Firstly the choice to use an interpreted language over a compiled language was made
primarily to increase the ability for others to easily modify the server as needed.
With a compiled language developers must all have access to a similar development
environment with all the required libraries, which can take some time to correctly
set up. By using an interpreted language any changes to the script’s code can be
made in place on the EECE server. Out of the three interpreted languages available
on the EECE server Python was chosen due to its much cleaner syntax and strong
support for packed binary data. A clean syntax allows for others not familiar with
either the language or project to easily understand the source code, which increases
maintainability [10]. The built in support for handling C type structures of packed
binary data allows good support for implementing efficient protocols.
3 Telemetry Back-end
15
Listen on port 2001
Wait for client connection
Receive packet
Unpack data
Check CRC
Invalid
Send NACK
Valid
Store in database
Unsuccessful
Successful
Send ACK
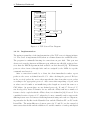
Figure 3.1: TCP Server Flow Diagram
3.2.1.2
Implementation
The main program flow of the implementation of the TCP server is shown in figure
3.1. The server is implemented in Python as a Linux daemon for an EECE server.
The program is continually listening for connections on port 2001. This port was
chosen as it was the first non well-known port without any officially registered services that the EECE department had available on their firewall [11]. Well-known
ports are those from 0 through 1023 and are assigned by the IANA for specific
commonly used services.
After a connection is made by a client, the client immediately sends a report
packet to the server as defined in table C.1. After checking the protocol ID byte
in the received packet the server then unpacks the data from that report packet
according to the appropriate protocol. Any errors when unpacking a report, such
as values out of bounds or an insufficient packet length are treated the same as a
CRC failure. At present there are two defined protocols, ’R’ and ’C’. Protocol ’C’
was developed by Astra Telematics for use with the AT100 and has a number of
features closely coupled with the AT100 client, it is defined in [12]. Protocol ’R’ is
a modified version of protocol ’C’ adapted to be more extensible and to support the
differing feature sets of telemetry clients implemented using on-board car computers,
in particular the EyeBot in the Hyundai Getz and the Windows XP car PC in the
Lotus Elise. The main differences between protocols ’C’ and ’R’ are the removal of
unnecessary data fields and the addition of a variable number of analog and digital
3 Telemetry Back-end
16
input values.
Once the packet has been unpacked the CRC value is calculated and compared
to the CRC value sent within the report packet. “A CRC is a technique for detecting
errors in digital data, but not for making corrections when errors are detected” [13].
If the CRC values do not match it is assumed there was an error in transmission,
the server then sends a NAK in response to the client, the client then re-queues the
packet for later transmission. If instead the CRC values match, the server proceeds
to store the report in the database, if this is successful the server sends an ACK in
response to the client and then the client may remove that report packet from its
queue. Protocol ’C’ uses CRC-16-Modbus, which is the ANSI standard for 16bit
CRC, so the decision was made to reuse the already existing implementation for
protocol ’R’. CRC-16-Modbus is easily calculated using the algorithm C.1, it is also
generally included in most CRC libraries including the Qt Toolkit, which was used
for the Lotus Elise GUI application. While it is possible to confirm the CRC on
the server using just the modulus of the data and CRC polynomial, the decision to
calculate the actual CRC value was made as it can be used to assist in developing
client implementations and the extra overhead in doing so is minimal for the typically
small report sizes.
After the CRC value has been validated the program then stores the report
data in the database. Before the report is stored in the database the server does
a small amount of processing. The server unpacks the status and reason bit-fields
into individual boolean values, applies the appropriate scaling as per figure C.1 and
converts the GPS time into an SQL timestamp. These changes make the data in
the database more accessible to standards compliant tools and ensure the data is
properly normalised. With the addition of a small amount of processing on the
client-side, a significant saving in processing on the server-side can be made, while
also improving the usability of the data stored. By sending specific reason codes
based upon the state of the vehicle’s ignition in a report packet, reports can easily
be grouped into journeys. The client sends a single report with the reason code
’Journey Start’ as the vehicles ignition is turned on and another with the reason
code ’Journey Stop’ when the ignition is turned off. Dependent on the reason code,
either a new journey is created in the database, or the current journey for that
vehicle is queried from the database and then added to the report. Without this
information the server must store the state of each vehicle or make unnecessary
queries to the database to determine the state whenever a report is received.
3 Telemetry Back-end
3.2.2
17
Database
The decision to host the TCP server on an EECE server restricted the choice of
databases to either a flat-file database, an embedded database or a database hosted
on the already existing EECE PostgreSQL server. Put simply a database is just an
organised collection of data. A database can be as basic as a file containing a list of
values with a single record on each line, such as the CSV format. At the other end
of the scale an advanced database could be part of a DBMS with data stored as a
set of related objects supporting multiple simultaneous users over a network [14].
When considering flat-file and embedded databases the major drawback is data
access is only provided to a single local process. As data access is needed for both
multiple front-end applications and potentially direct access to the database this
alone rules out flat-file and embedded databases as suitable choices.
“PostgreSQL is a powerful, open source object-relational database system” [15].
PostgreSQL is an enterprise class database, which is both standards compliant and
highly scalable. The PostgreSQL database server provided by EECE is running
PostgreSQL server 8.1.19. In the implementation of this system both front-end
and back-end components all use database abstraction frameworks, allowing the
database server to be easily switched to any major SQL compliant DBMS. This
ensures that the system is not tightly coupled with its data storage allowing greater
flexibility for future modifications.
Reports
Trackers
ReportID
IMEI
Latitude
Longitude
ServerTime
GPSTime
Speed
Heading
Altitude
BatteryLevel
ReasonCode
StatusCode
ChargeCurrent
JourneyID
IMEI
Name
Description
Type
Journeys
AnalogInputs
DigitalInputs
JourneyID
TotalDistance
ChargeUsed
AnalogInputID
ReportID
InputID
Value
DigitalInputID
ReportID
InputID
Value
Figure 3.2: Telemetry Database Table Structure
3 Telemetry Back-end
3.2.2.1
18
Structure
When using a relational DBMS the structure of the database and the tables within
affect both the database’s suitability for querying and data integrity [14]. The
database relational table structure can be see in figure 3.2 and a detailed copy of
the schema in figure D.1. When designing relational databases normalisation is
a method of ensuring the database structure is suitable for general SQL querying
without any abnormalities and free of any undesirable qualities that may affect
data integrity [14]. The telemetry database was first systematically normalised
to 3NF and then denormalised to better suit the batch processing aspect of the
system. The denormalisation is evident in figure 3.2 in the Journeys table where
data for TotalDistance and ChargeUsed are summarised from Reports through batch
processing. These values will typically be used as the basis for a number of common
queries and calculating them for each journey is one of the most time complex
operations that will likely be carried out on the database, hence offloading that
work to batch processing.
3.2.2.2
Batch Processing
Batch processing is the automatic periodic execution of a series of tasks, in the case
of the telemetry back-end this would be the nightly process of summarising journeys.
As journeys will form the basis on which most queries are filtered it will greatly improve processing times if summary data for each completed journey is only processed
once rather than every time a query is executed. Every night a cron job executes a
Python script that performs the batch processing on the telemetry database. The
Python script calculates the total distance traveled and charge percentage used for
every finished unprocessed journey in the database following the algorithms 3.1 and
3.2, the results are then stored in the journeys table for the appropriate JourneyID.
Algorithm 3.1 Distance Traveled In A Journey
For each set of longitude and latitude in a journey sorted by time
Distance =
n−1
X
arccos{sin(latitudek ) × sin(latitudek+1 )+
k=1
cos(latitudek ) × cos(latitudek+1 ) ∗ cos(longitudek − longitudek+1 )}
3 Telemetry Back-end
Algorithm 3.2 Charge Used In A Journey
For BatteryLevel values in a journey sorted by time
Charge U sed = BatteryLeveln − BatteryLevel1
19
Chapter 4
Telemetry Front-end
4.1
Background
While it is anticipated the majority of research based on data from the telemetry
system will use data queried directly from the database a simple GUI would still be
required. The main purpose of the GUI would be to confirm the ongoing correct
operation of the telemetry system, along with providing simple summary statistics
on the electric vehicles’ performance.
4.2
4.2.1
Design
SproutCore
“SproutCore is an HTML5 application framework for building responsive, desktopcaliber apps in any modern web browser, without plugins.” [16] The motivation
behind using SproutCore to build the telemetry front-end was that the framework
allows rich web applications to be built in which most of the processing takes place
on the client side, reducing server load and delivering data quickly. SproutCore
supports AJAX and is able to make web pages that update automatically without
the need to reload, allowing live telemetry data to be streamed to a viewer of the
web page. SproutCore is completely server agnostic so there were no concerns about
compatibility with the EECE servers. The framework is extremely robust and is used
by Apple for their MobileMe web application suite [17]. SproutCore implements
Model-View-Controller as its software architecture, which is a development pattern
isolating the application logic from the user interface. This allows greater growth
for web applications designed with SproutCore as different parties can separately
20
4 Telemetry Front-end
21
work on each component.
Figure 4.1: Smart-phone Market Share 2Q2010 [1]
SproutCore states compatibility with Apple’s Safari 4, Microsoft’s Internet Explorer 7 and Mozilla’s Firefox 3.5 or higher. Mobile web browser compatibility was
tested with iPhone 4.1, Android 2.2, Blackberry 4.5 and Symbian 9.2. According to
data from [1] seen in figure 4.1 this covers ~90% of the smart-phone market.
4.2.2
Google Maps
The core component of the front-end is mapping vehicle locations so a fast and
reliable mapping provider was needed. Google maps was chosen to provide the
mapping framework to the front-end as it provides an extremely fast and powerful
API for use with its map data. Another contender was Open Street Map, an open
source alternative to Google Maps, however the quality of both its maps and API
were inferior to Google’s and the speed at which maps were generated was noticeably
slower. Google provides it mapping service free for non-commercial use [18].
4.2.3
Telemetry Desktop
The telemetry desktop web application can be considered as two separate components; a PHP web service and a SproutCore front-end. The PHP web service is
responsible for querying the telemetry back-end database and returning results to
the SproutCore front-end in the JSON format. The SproutCore component requests
any new data from the PHP web service every 60 seconds and updates with web page
4 Telemetry Front-end
22
Figure 4.2: Telemetry Desktop Web-page
with any changes. To minimise the amount of data being transferred the SproutCore
front-end has been developed to request data only for the vehicles selected by the
user. After receiving data the SproutCore front-end generates graphs and summary
statistics for the most recent journey of the selected vehicle.
The telemetry desktop application is available online at
http://robotics.ee.uwa.edu.au/telemetry/desktop/.
4.2.4
Telemetry Mobile
The telemetry mobile application was designed to be both a promotional tool for
demonstration at public events and a useful application for the REV team and
anyone driving one of the WA State Trial electric vehicles. The choice was made
to make the telemetry mobile application a web application, rather than a native
application to a particular smart-phone, to give greater coverage of the smart-phone
market. As the desktop web application was already implemented using SproutCore
the same PHP web service and front-end application logic was able to be re-used with
only a change to the view MVC component. The ease as which this application could
be generated from the desktop version is a testament to the SproutCore framework
and proves it as a good choice as varying interfaces could be created easily by others.
This web application focuses only on a single electric vehicle at a time, as most
participants in the WA EV State Trial will have access to only a single vehicle. The
application can be book-marked and loads quickly. Just like its desktop counterpart once loaded only telemetry data is transferred from the server. Once loaded
4 Telemetry Front-end
23
Figure 4.3: Telemetry Mobile Web-page
telemetry mobile shows the current location of the electric vehicle, battery level and
charging status. It is anticipated that this is the kind of application drivers would
use as they plug their vehicles in to charge at a shopping centre. It would then be
loaded periodically to check if anything had interrupted the charging process and if
their vehicle had charged to an appropriate level for the next leg of their journey.
As the telemetry system passes data in only one direction, from tracker to telemetry back-end, further advanced features like remote unlocking or alarm sounding are
not currently possible.
The telemetry mobile application is available online at
http://robotics.ee.uwa.edu.au/telemetry/mobile/.
Chapter 5
Conclusions
The main aim of this project was to develop a telemetry system capable of reliably
collecting data from a variety of different electric vehicles. As tested the system’s
back-end is highly reliable and has been operating continuously for almost 5 months.
The extensible nature of protocol ’R’ and the modularity for the SproutCore frontend will allow for easy extension with future REV Projects.
In out-of-vehicle testing the AT100 has performed well and verified the successful
implementation of the back-end. Unfortunately the Terminus did not arrive until
the end of this project and the program developed for that platform remains largely
untested. The Terminus vehicle interface board has been built on strip board and
bench-tested in the lab. It was found to meet all the parameters it was developed
for by producing the correct voltage output levels required by the Terminus.
Prototype implementations of tracker clients using protocol ’R’ and running on
the on-board computers in the Lotus and Getz have been successfully tested with
the telemetry back-end. The students working on those projects are still finishing
the final implementations of their software.
5.1
Future Work
This project has created a successful prototype of a telemetry system for electric
vehicles, however in-vehicle testing of both tracker units still needs to be completed.
The program for the Terminus will need to be throughly tested and likely modified slightly to suit the switching delays of the interface board.
As different interfaces and views for the front-end of the system are easily developed with SproutCore others could extend the web applications with further
projects.
24
5 Conclusions
25
A stronger layer of security between the tracker unit and server could be added
to protocol ’R’, currently the only security on that path is that only reports with
registered IMEI numbers are accepted by the server.
Finally once the tracker units are properly integrated into the EV State Trial
Vehicles there will be considerably more telemetry data available to the REV Project
than in the past. Giving way to future projects researching the characteristics of
electric vehicle use and their suitability for wide-spread uptake.
References
[1] Gartner. (2010, August) Gartner says worldwide mobile device sales grew
13.8 percent in second quarter of 2010, but competition drove prices down.
[Online]. Available: http://www.gartner.com/it/page.jsp?id=1421013
[2] Janus, “Terminus gsm864q hardware user manual,” Janus Remote Communications, Tech. Rep. R02, 2009.
[3] D. S. Kim and J. D. Porter, “Technology development and system integration
for a vehicle miles traveled based revenue collection system prototype,” Oregon
State University, Tech. Rep., 2004.
[4] P. Vella, “At100 vehicle tracker integration guide,” Astra Telematics Limited,
Tech. Rep. Issue 3.4, 2010.
[5] A. Palacherla, “An538 - using pwm to generate analog output,” Microchip Technology Inc., Tech. Rep., 2002.
[6] “Cd4051bc, cd4052bc, cd4053bc,” Fairchild Semiconductor Corporation, Tech.
Rep. DS005662, April 2002.
[7] “Lm139/lm239/lm339/lm2901/lm3302 low power low offset voltage quad comparators,” National Semiconductor Corporation, Tech. Rep. DS005706, March
2004.
[8] Phidgets. (2010) Phidgets - i-snail vc-25. [Online]. Available:
http:
//www.phidgets.com/products.php?category=8&product_id=3501
[9] D. Kingdom, “Rev management and on-board embedded systems,” Undergraduate Thesis, The University of Western Australia, 2009.
[10] M. Foord. (2010) Python vs. php. [Online]. Available: http://wiki.python.org/
moin/PythonVsPhp
[11] IANA, “Port numbers,” October 2010.
26
REFERENCES
27
[12] P. Vella, “At100 protocol ‘c’,” Astra Telematics Limited, Tech. Rep. Issue 15,
2010.
[13] H. S. Warren, Hacker’s Delight. Addison-Wesley, 2003.
[14] L. Liu, Encyclopedia of Database Systems. Springer Reference, 2009.
[15] PostgreSQL. (2010) About postgresql. [Online]. Available:
http://www.
postgresql.org/about/
[16] SproutSystems. (2010) What is sproutcore?
[Online]. Available:
http:
//www.sproutcore.com/what-is-sproutcore/
[17] P.
able:
McLean.
(2008,
June)
Apple’s
open
secret.
[Online].
Avail-
http://www.appleinsider.com/articles/08/06/16/apples_open_secret_
sproutcore_is_cocoa_for_the_web.html
[18] Google. (2010) Google maps terms and conditions. [Online]. Available:
http://www.google.com/intl/en_ALL/help/terms_local.html
[19] Direct-Electronics. (2010) Viper smartstart. [Online]. Available:
http:
//www.viper.com/SmartStart/
[20] C. Dickie, “Gps tracker for a renewable energy vehicle,” Undergraduate Thesis,
The University of Western Australia, 2009.
[21] C. Brunsdon, “Path estimation from gps tracks,” University of Leicester, Tech.
Rep., 2007.
[22] V. Miliano, “A case study of gps position dither in motion,” Geographic Information Society, Tech. Rep., 2007.
[23] P. Vella, “At100 vehicle tracker app note - gps quality,” Astra Telematics Limited, Tech. Rep., 2010.
[24] ——, “At100 vehicle tracker app note - journey reporting modes,” Astra Telematics Limited, Tech. Rep., 2010.
[25] ——, “At100 vehicle tracker nmea command reference,” Astra Telematics Limited, Tech. Rep. Issue 2.2, 2009.
[26] “At commands reference guide,” Telit Communications S.p.A., Tech. Rep.
80000ST10025a Rev. 9, 2010.
REFERENCES
28
[27] “Gc864 hardware user guide,” Telit Communications S.p.A, Tech. Rep.
1vv0300733 Rev.11, 2009.
[28] B. C. Baker, “An699 - anti-aliasing, analog filters for data acquisition systems,”
Microchip Technology Inc., Tech. Rep., 1999.
[29] The rev project. [Online]. Available: http://therevproject.com/
[30] J. G. Webster, The Measurement, Instrumentation and Sensors Handbook.
CRC Press LLC, 1999.
[31] J. Chiasson and B. Vairamohan, “Estimating the state of charge of a battery,”
IEEE Transactions on Control Systems Technology, vol. 13, no. 3, pp. 465–470,
2005.
[32] R. Thomas and S. Sydenham. (2007) The black box flight recorder. [Online].
Available: http://www.kidcyber.com.au/topics/blackbox.html
[33] A. Vaughan and G. Delagrammatikas, “An onboard telemetry system for lowlevel electrical signals,” SAE 2010 World Congress, April 2010.
[34] M. Nathanson, “Vehicle intelligence and remote wireless obd,” SAE - Truck and
Bus, 2000.
[35] D.-H. Jung, G.-M. Jeong, H.-S. Ahn, M. Ryu, and M. Tomizuka, “Remote
diagnostic protocol and system for u-car,”
in Ubiquitous Convergence
Technology, ser. Lecture Notes in Computer Science, F. Stajano, H. Kim,
J.-S. Chae, and S.-D. Kim, Eds.
vol. 4412,
pp. 60–68,
Springer Berlin / Heidelberg, 2007,
10.1007/978-3-540-71789-8-7. [Online]. Available:
http://dx.doi.org/10.1007/978-3-540-71789-8-7
[36] S. GRAHAM, “Networking cities: Telematics in urban policy —a critical
review*,” International Journal of Urban and Regional Research, vol. 18, no. 3,
pp. 416–432, 1994. [Online]. Available: http://dx.doi.org/10.1111/j.1468-2427.
1994.tb00276.x
Appendix A
Schematics
29
A Schematics
30
Figure A.1: Terminus Interface Board Schematic
A Schematics
31
0 1 2 3 4 5 6 7 8 9 10 11 12 13 14 15 16 17 18 19 20 21 22 23 24 25 26 27 28 29 30 31 32 33 34 35 36 37 38
0 J2R13
R9
1
U1
R7
R2
R8R12
2
U3
U2
3
R11
R10
R6R5R4
R1
4 J3
5
6
7
8
R3
9
10
11
12
C4
C3
C2
C1
13
14 J1
15
16
17
18
19
20
21
22
23
24
25
26
27
28
Figure A.2: Terminus Interface Board Strip Board Layout
Appendix B
AT100 Settings
V e r s i o n : 5 . 0 1 AST 07/09/10
∗ APPLICATION PARAMETERS ∗
IMEI :
3 52 92 9 01 0 00 62 8 0
SERV : NONE
SMSC: NONE
IPAD :
130.95.208.7
PORT:
2001
IPAD2 : NONE
PORT2: 0
TCPM: 1
TCPT:
30
APAD:
VirginInternet
APUN:
Guest
APPW:
Guest
MODE: 4
GPST:
300
GPSL :
3000
GPSS :
1500
DIST :
10
HEAD:
15
STPD :
180
STIM : 1
JTIM : 1
ITIM : 1
IDLE :
360
OSST :
120
OSHT:
20
OSIT :
300
IGNM: 1
DBUG: 4
ROAM: 1
REPL :
65535
SMSL :
20
CLID : 0
RFSC : 0
CPOL: 0
∗∗∗∗∗∗∗∗∗∗∗∗∗∗∗∗∗∗∗∗∗∗
Figure B.1: AT100 Application Parameters
32
Appendix C
Telemetry Protocol
Server: shellsrv.ee.uwa.edu.au (130.95.208.7)
Port: 2001
Protocol: TCP - Connection closed after each report
Unless otherwise mentioned assume big endian and unsigned numbers.
Upon receipt of a report packet the server with check the CRC value of the packet
and return <ACK> if successful. The client can then remove the report from its
buffer and continue to send further reports. If the CRC value was not correct the
server will return <NAK> and the client should attempt to resend the packet and
buffer any new packets.
<ACK> = 0x06 <NAK> = 0x15
33
C Telemetry Protocol
34
Field
Protocol ID
Packet Length
Unit IMEI
Latitude
Longitude
GPS Time
Speed
Heading
Altitude
Report Reason
Status Code
DI Count
DI #x
ADC Count
ADC #x
Battery Level
Checksum
No. of bytes
1
2
7
4
4
4
1
1
1
2
1
1
1
1
2
1
2
Table C.1: Telemetry Protocol Data
Protocol ID (1 byte)
Single byte to designate protocol being used.
REV cars to use protocol ‘R’. (ASCII ‘R’ = 0x52)
Packet Length (2 bytes)
Total number of bytes in the packet, including checksum.
Unit IMEI (7 bytes)
3G/GPRS Device IMEI (15 digit code)
Latitude (4 bytes)
WGS84 latitude in decimal degrees, as a signed integer (multiplied by 1000000).
Longitude (4 bytes) WGS84 longitude in decimal degrees, as a signed integer
(multiplied by 1000000).
GPS Time (4 bytes)
Julian time. Time and date as seconds from seed date 00:00:00, January 6 1980.
Speed (1 byte)
Speed as km/h. (0-255km/h)
Heading (1 byte)
Heading divided by 2. (0-360/2)
Altitude (1 byte)
Height above sea level. Value in metres divided by 20. (0-5100/2).
Reason Code (2 bytes)
C Telemetry Protocol
35
Bit field indicating reason for sending report.
Low Byte :
LSB
b i t 0 : Time i n t e r v a l
bit 1: Distance i n t e r v a l
b i t 2 : Sent on demand
b i t 3 : Reserved
b i t 4 : Panic s w i t c h a c t i v a t e d
b i t 5 : E x t e r n a l i n p u t changed
b i t 6 : Journey S t a r t ( I g n i t i o n On)
MSB
b i t 7 : Journey Stop ( I g n i t i o n O ff )
High Byte :
LSB
b i t 0 : Heading changed
b i t 1 : Low b a t t e r y
b i t 2 : Charging s t a t u s changed
b i t 3 : Reserved
b i t 4 : Reserved
b i t 5 : Reserved
b i t 6 : Reserved
MSB
b i t 7 : Reserved
Note: Reports sent regardless of GPS fix (ie. timed, input change, low battery).
Without GPS fix GPS fields (lat, lon, heading, speed, altitude) contain zeros. Time
is sourced from system time.
Status Code (1 byte)
Bit field indicating unit status.
LSB
bit 0: Ignition status
b i t 1 : I n i t i a l power on r e p o r t
b i t 2 : GPS timeout ( 1 i f no GPS f i x )
b i t 3 : Reserved
b i t 4 : Reserved
b i t 5 : Reserved
b i t 6 : Reserved
MSB
b i t 7 : Reserved
DI Count (1 byte)
The number of digital input bit field bytes. ie 8 digital inputs per byte.
C Telemetry Protocol
36
DI (1 byte)
Bit field containing digital input status. 8 digital inputs per byte.
ADC Count (1 byte)
The number of analog input bytes. ie 2 bytes per analog input.
ADC (2 bytes) Analog input value scaled to fit in 2 byte signed integer. Will
have scaling factor reversed on server.
Battery Level (1 byte) Charge level of the electric vehicles traction pack as a
percentage. (0-100)
Checksum (2 bytes)
2 byte CRC. Modbus CRC-16 (0xA001)
Algorithm C.1 Checksum Pseudocode [12]
1. Load a 16 bit register with all 1s or 0xFFFF. Call this the CRC register.
2. Exclusive OR the first byte of the message with the low byte of the CRC
register, putting the result into the CRC register.
3. Shift the CRC register 1 bit to the right (toward the LSB), zero filling the
MSB. Extract and examine the LSB.
4. If LSB = 0, repeat step 3 (another shift), If LSB = 1, exclusive OR the CRC
register with 0xA001
5. Repeat steps 3 and 4 until 8 shifts have been performed. When this is done,
one byte of the message will have been processed.
6. Repeat this process for each byte of the message.
Appendix D
Database Schema
37
D Database Schema
38
CREATE TABLE " r e p o r t s " (
" i d " i n t 4 NOT NULL DEFAULT n e x t v a l ( ’ r e p o r t s _ i d _ s e q ’ : : r e g c l a s s ) ,
" i m e i " i n t 8 NOT NULL DEFAULT NULL,
" l a t i t u d e " f l o a t 8 NOT NULL DEFAULT NULL,
" l o n g i t u d e " f l o a t 8 NOT NULL DEFAULT NULL,
" g p s t i m e " timestamp NULL DEFAULT NULL,
" s e r v e r t i m e " timestamp NOT NULL DEFAULT NULL,
" s p e e d " i n t 2 DEFAULT NULL,
" h e a d i n g " i n t 2 DEFAULT NULL,
" a l t i t u d e " i n t 2 DEFAULT NULL,
" b a t t e r y l e v e l " i n t 2 DEFAULT NULL,
" c h a r g e c u r r e n t " f l o a t 4 DEFAULT NULL,
" r e a s o n " i n t 2 DEFAULT NULL,
" s t a t u s " i n t 2 DEFAULT NULL,
" j o u r n e y i d " i n t 4 NOT NULL DEFAULT NULL
)
WITHOUT OIDS ;
ALTER TABLE " r e p o r t s " ADD CONSTRAINT " r e p o r t s _ p k e y " PRIMARY KEY ( " i d " ) ;
CREATE TABLE " t r a c k e r s " (
" i m e i " i n t 8 NOT NULL DEFAULT NULL,
"name" v a r c h a r NOT NULL DEFAULT NULL,
" d e s c " v a r c h a r DEFAULT NULL,
" t y p e " i n t 2 NOT NULL DEFAULT NULL
)
WITHOUT OIDS ;
ALTER TABLE " t r a c k e r s " ADD CONSTRAINT " t r a c k e r s _ p k e y " PRIMARY KEY ( " i m e i " ) ;
CREATE TABLE " j o u r n e y s " (
" j o u r n e y i d " i n t 4 NOT NULL DEFAULT n e x t v a l ( ’ journeys_id_seq ’ : : r e g c l a s s ) ,
" t o t a l d i s t a n c e " i n t 4 DEFAULT NULL,
" c h a r g e u s e d " i n t 4 DEFAULT NULL
)
WITHOUT OIDS ;
ALTER TABLE " j o u r n e y s " ADD CONSTRAINT " journeys_pkey " PRIMARY KEY ( " j o u r n e y i d " ) ;
CREATE TABLE " a n a l o g i n p u t s " (
" a n a l o g i n p u t i d " i n t 4 NOT NULL DEFAULT n e x t v a l ( ’ a n a l o g i n p u t s _ i d _ s e q ’ : : r e g c l a s s ) ,
" r e p o r t i d " i n t 4 NOT NULL DEFAULT NULL,
" i n p u t i d " i n t 4 NOT NULL DEFAULT NULL,
" v a l u e " i n t 4 NOT NULL DEFAULT NULL
)
WITHOUT OIDS ;
ALTER TABLE " a n a l o g i n p u t s " ADD CONSTRAINT " a n a l o g i n p u t s _ p k e y " PRIMARY KEY ( " a n a l o g i n p u t s " ) ;
CREATE TABLE " d i g i t a l i n p u t s " (
" d i g i t a l i n p u t i d " i n t 4 NOT NULL DEFAULT n e x t v a l ( ’ d i g i t a l i n p u t s _ i d _ s e q ’ : : r e g c l a s s ) ,
" r e p o r t i d " i n t 4 NOT NULL DEFAULT NULL,
" i n p u t i d " i n t 4 NOT NULL DEFAULT NULL,
" v a l u e " b o o l NOT NULL DEFAULT NULL
)
WITHOUT OIDS ;
ALTER TABLE " d i g i t a l i n p u t s " ADD CONSTRAINT " d i g i t a l i n p u t s _ p k e y " PRIMARY KEY ( " d i g i t a l i n p u t s " ) ;
Figure D.1: PostgreSQL Telemetry Database Schema
Appendix E
Source Code
E.1
Python TCP Server
im por t S o c k e t S e r v e r
im por t psycopg2
from s t r u c t i mpo rt ∗
from d a t e t i m e imp ort ∗
from time imp ort s t r f t i m e , l o c a l t i m e
c l a s s TCPRequestHandler ( S o c k e t S e r v e r . B a s e R e q u e s t H a n d l e r ) :
crcmodbus = ( 0 x0000 , 0xC0C1 , 0xC181 , 0 x0140 , 0xC301 , 0x03C0 , 0 x0280 , 0xC241
, 0xC601 , 0x06C0 , 0 x0780 , 0xC741 , 0 x0500 ,
0xC5C1 , 0xC481 , 0 x0440 , 0xCC01 , 0x0CC0 , 0x0D80 , 0xCD41 , 0 x0F00 , 0xCFC1 , 0
xCE81 , 0x0E40 , 0x0A00 , 0xCAC1 ,
0xCB81 , 0x0B40 , 0xC901 , 0x09C0 , 0 x0880 , 0xC841 , 0xD801 , 0x18C0 , 0 x1980 , 0
xD941 , 0x1B00 , 0xDBC1 , 0xDA81 ,
0x1A40 , 0x1E00 , 0xDEC1 , 0xDF81 , 0 x1F40 , 0xDD01 , 0x1DC0 , 0x1C80 , 0xDC41 , 0
x1400 , 0xD4C1 , 0xD581 , 0 x1540 ,
0xD701 , 0x17C0 , 0 x1680 , 0xD641 , 0xD201 , 0x12C0 , 0 x1380 , 0xD341 , 0 x1100 , 0
xD1C1 , 0xD081 , 0 x1040 , 0 xF001 ,
0x30C0 , 0 x3180 , 0 xF141 , 0 x3300 , 0xF3C1 , 0 xF281 , 0 x3240 , 0 x3600 , 0xF6C1 , 0
xF781 , 0 x3740 , 0 xF501 , 0x35C0 ,
0 x3480 , 0 xF441 , 0x3C00 , 0xFCC1 , 0xFD81 , 0x3D40 , 0xFF01 , 0x3FC0 , 0x3E80 , 0
xFE41 , 0xFA01 , 0x3AC0 , 0x3B80 ,
0xFB41 , 0 x3900 , 0xF9C1 , 0 xF881 , 0 x3840 , 0 x2800 , 0xE8C1 , 0xE981 , 0 x2940 , 0
xEB01 , 0x2BC0 , 0x2A80 , 0xEA41 ,
0xEE01 , 0x2EC0 , 0 x2F80 , 0xEF41 , 0x2D00 , 0xEDC1 , 0xEC81 , 0x2C40 , 0xE401 , 0
x24C0 , 0 x2580 , 0xE541 , 0 x2700 ,
0xE7C1 , 0xE681 , 0 x2640 , 0 x2200 , 0xE2C1 , 0xE381 , 0 x2340 , 0xE101 , 0x21C0 , 0
x2080 , 0xE041 , 0xA001 , 0x60C0 ,
0 x6180 , 0xA141 , 0 x6300 , 0xA3C1 , 0xA281 , 0 x6240 , 0 x6600 , 0xA6C1 , 0xA781 , 0
x6740 , 0xA501 , 0x65C0 , 0 x6480 ,
0xA441 , 0x6C00 , 0xACC1 , 0xAD81 , 0x6D40 , 0xAF01 , 0x6FC0 , 0x6E80 , 0xAE41 , 0
xAA01 , 0x6AC0 , 0x6B80 , 0xAB41 ,
0 x6900 , 0xA9C1 , 0xA881 , 0 x6840 , 0 x7800 , 0xB8C1 , 0xB981 , 0 x7940 , 0xBB01 , 0
x7BC0 , 0x7A80 , 0xBA41 , 0xBE01 ,
0x7EC0 , 0 x7F80 , 0xBF41 , 0x7D00 , 0xBDC1 , 0xBC81 , 0x7C40 , 0xB401 , 0x74C0 , 0
x7580 , 0xB541 , 0 x7700 , 0xB7C1 ,
39
E Source Code
40
0xB681 , 0 x7640 , 0 x7200 , 0xB2C1 , 0xB381 , 0 x7340 , 0xB101 , 0x71C0 , 0 x7080 , 0
xB041 , 0 x5000 , 0x90C1 , 0 x9181 ,
0 x5140 , 0 x9301 , 0x53C0 , 0 x5280 , 0 x9241 , 0 x9601 , 0x56C0 , 0 x5780 , 0 x9741 , 0
x5500 , 0x95C1 , 0 x9481 , 0 x5440 ,
0x9C01 , 0x5CC0 , 0x5D80 , 0x9D41 , 0 x5F00 , 0x9FC1 , 0x9E81 , 0x5E40 , 0x5A00 , 0
x9AC1 , 0x9B81 , 0x5B40 , 0 x9901 ,
0x59C0 , 0 x5880 , 0 x9841 , 0 x8801 , 0x48C0 , 0 x4980 , 0 x8941 , 0x4B00 , 0x8BC1 , 0
x8A81 , 0x4A40 , 0x4E00 , 0x8EC1 ,
0 x8F81 , 0 x4F40 , 0x8D01 , 0x4DC0 , 0x4C80 , 0x8C41 , 0 x4400 , 0x84C1 , 0 x8581 , 0
x4540 , 0 x8701 , 0x47C0 , 0 x4680 ,
0 x8641 , 0 x8201 , 0x42C0 , 0 x4380 , 0 x8341 , 0 x4100 , 0x81C1 , 0 x8081 , 0 x4040 )
def setup ( s e l f ) :
print s e l f . client_address ,
’ connected ! ’
def handle ( s e l f ) :
#I n i t data b u f f e r
data = ’ ’
w h i l e data :
data = s e l f . r e q u e s t . r e c v ( 1 )
i f data == ’C ’ :
#Connect t o DB
conn = psycopg2 . c o n n e c t ( " h o s t=m a r g i n a t a . e e . uwa . edu .
au dbname=p o w e r l o g g i n g u s e r=p o w e r l o g g i n g
password =∗∗∗∗∗∗∗∗∗")
c u r = conn . c u r s o r ( )
#I n i t v a r i a b l e s f o r m u l t i p l e r e p o r t s
r e p o r t s r e m a i n i n g = True
offset = 0
#R e t r i e v e p a c k e t l e n g t h
data += s e l f . r e q u e s t . r e c v ( 2 )
p a c k e t l e n g t h = unpack ( ’ ! H’ , data [ 1 : 3 ] ) [ 0 ]
data += s e l f . r e q u e s t . r e c v ( p a c k e t l e n g t h −3)
i m e i = unpack ( ’ ! Q’ , ’ \ x00 ’+ data [ 3 : 1 0 ] ) [ 0 ]
#P r o c e s s m u l i t p l e r e p o r t s from a p a c k e t
reportnum=0
while ( reportsremaining ) :
reportnum += 1
reportsremaining = False
l a t = unpack ( ’ ! i ’ , data [11+ o f f s e t :15+ o f f s e t
]) [0]
l o n = unpack ( ’ ! i ’ , data [15+ o f f s e t :19+ o f f s e t
]) [0]
j t i m e = unpack ( ’ ! i ’ , data [19+ o f f s e t :23+
offset ]) [0]
h e a d i n g = unpack ( ’ ! B’ , data [24+ o f f s e t ] ) [ 0 ]
a l t i t u d e = unpack ( ’ ! B’ , data [25+ o f f s e t ] ) [ 0 ]
r l = unpack ( ’ ! B’ , data [27+ o f f s e t ] ) [ 0 ]
s c = unpack ( ’ ! B’ , data [28+ o f f s e t ] ) [ 0 ]
f e n c e = unpack ( ’ ! B’ , data [29+ o f f s e t ] ) [ 0 ]
d i o = unpack ( ’ ! B’ , data [30+ o f f s e t ] ) [ 0 ]
E Source Code
41
adc1 = unpack ( ’ ! B’ , data [33+ o f f s e t ] ) [ 0 ]
b a t t = unpack ( ’ ! B’ , data [34+ o f f s e t ] ) [ 0 ]
maxspeed = unpack ( ’ ! B’ , data [36+ o f f s e t ] ) [ 0 ]
maxaccel = unpack ( ’ ! B’ , data [37+ o f f s e t ] ) [ 0 ]
maxdecel = unpack ( ’ ! B’ , data [38+ o f f s e t ] ) [ 0 ]
d i s t a n c e = unpack ( ’ ! H’ , data [39+ o f f s e t :41+
offset ]) [0]
i d l e t i m e = unpack ( ’ ! H’ , data [41+ o f f s e t :43+
offset ]) [0]
#Check s t a t u s f l a g s f o r r e p o r t s r e m a i n i n g
i f ( reportnum >= 8 ) :
break
i f ( s c & 0 x10 == 0 x10 ) :
r e p o r t s r e m a i n i n g = True
o f f s e t += 33
g p s t i m e = d a t e t i m e . fromtimestamp ( j t i m e ) +
t i m e d e l t a ( days =3657)
timed = r l & 0 x01 == 0 x01
g e o f e n c e = f e n c e & 0x7F
g f s t a t u s = f e n c e & 0 x80 == 0 x80
#I n s e r t DB
#r e p o r t = ( i m e i , l a t , lon , j t i m e , speed ,
heading , a l t i t u d e , f e n c e , adc1 , b a t t ,
maxspeed , maxaccel , maxdecel , d i s t a n c e ,
idletime )
c u r . e x e c u t e ( "INSERT INTO t e l e m e t r y ( i m e i ,
lattitude , longitude , servertime ,
gpstime , speed , heading , a l t i t u d e ,
timed , u n i t b a t t e r y , maxspeed , maxaccel ,
maxdecel , d i s t a n c e , i d l e t i m e ,
geofencenumber , g e o f e n c e s t a t u s ) VALUES
(%s , %s , %s , %s , %s , %s , %s , %s , %s , %s
, %s , %s , %s , %s , %s , %s , %s ) " , ( i m e i ,
l a t /1000000.0 , lon /1000000.0 , datetime .
now ( ) , gpstime , s p e e d ∗ 2 , h e a d i n g ∗ 2 ,
a l t i t u d e ∗ 2 0 , timed , b a t t , maxspeed ∗ 2 ,
maxaccel , maxdecel , d i s t a n c e / 1 0 . 0 ,
i d l e t i m e /60 , geofence , g f s t a t u s ) )
#Get checksum from p a c k e t
chksum = unpack ( ’ ! H’ , data [43+ o f f s e t :45+ o f f s e t ] ) [ 0 ]
#C a l c u l a t e CRC−Modbus checksum on data r e c e i v e d
c r c = 0xFFFF
f o r c i n data [ 0 : − 2 ] :
crctemp = ( ord ( c ) ^ c r c ) & 0x00FF
crctemp = TCPRequestHandler . crcmodbus [
crctemp ]
c r c = ( c r c >> 8 ) ^ crctemp
#Acknowlege r e c e i p t o f p a c k e t
i f ( chksum==c r c ) :
E Source Code
42
#Save R e p o r t s i n t o DB
conn . commit ( )
#Send any commands h e r e
s e l f . r e q u e s t . send ( ’ \ x06 ’ )
else :
conn . r o l l b a c k ( )
s e l f . r e q u e s t . send ( ’ \ x15 ’ )
cur . c l o s e ( )
conn . c l o s e ( )
def f i n i s h ( s e l f ) :
print s e l f . client_address ,
’ disconnected ! ’
s e r v e r = S o c k e t S e r v e r . ThreadingTCPServer ( ( ’ ’ , 2 0 0 1 ) , TCPRequestHandler )
server . serve_forever ()
E.2
PHP Desktop Web Service
<?php
f u n c t i o n dbConnect ( )
{
$host = " l o c a l h o s t ";
$user = " powerlogging ";
$pass = "∗∗∗∗∗∗∗∗∗";
$dbname = " p o w e r l o g g i n g " ;
try {
$dbh = new PDO( " p g s q l : dbname=$dbname ; h o s t=$ h o s t " , $ u s e r , $ p a s s ) ;
r e t u r n $dbh ;
$ s q l = "SELECT ∗ FROM t e l e m e t r y " ;
f o r e a c h ( $dbh−>query ( $ s q l ) a s $row )
{
p r i n t $row [ 1 ]
. ’ − ’ . $row [ 2 ]
}
/∗∗∗ c l o s e t h e d a t a b a s e c o n n e c t i o n ∗∗∗/
$dbh = n u l l ;
}
c a t c h ( PDOException $e )
{
echo $e−>g e t M e s s a g e ( ) ;
}
}
function getCurrentLocation ( $rego ) {
. ’< br / > ’;
E Source Code
43
$ s q l = "SELECT ∗ FROM t e l e m e t r y INNER JOIN c a r s ON t e l e m e t r y . i m e i=c a r s . i m e i
WHERE c a r s . r e g o = ’ $ r e g o ’ ORDER BY g p s t i m e DESC LIMIT 1 " ;
getJSON ( $ s q l ) ;
}
f u n c t i o n getJSON ( $ s q l ) {
$dbh = dbConnect ( ) ;
$ s t h = $dbh−>p r e p a r e ( $ s q l ) ;
$s th −>e x e c u t e ( ) ;
$rows = $s th −>f e t c h A l l (PDO : : FETCH_ASSOC) ;
echo js on_ enc od e ( $rows ) ;
}
function getCars ( ) {
$ s q l = "SELECT ∗ FROM c a r s " ;
getJSON ( $ s q l ) ;
}
?>
E.3
PHP Mobile Debug Web Service
<?php
$ d a t e = d a t e ( " d/m/y H: i " ) ;
$ c h a r g e l e v e l = 60 + c e i l ( d a t e ( " s " ) / 2 ) ;
$ l a t = −31.9+( d a t e ( "H" ) / 5 0 0 ) ;
$ l o n = 1 1 5 . 8 + ( d a t e ( "H" ) / 5 0 0 ) ;
$ a r r = a r r a y ( " i d " => 1 , " l a t " => $ l a t , " l o n " => $ l o n , " r e g " => "1AAA−123" , "
c h a r g e L e v e l " => $ c h a r g e l e v e l , " l a s t U p d a t e " => $ d a t e ) ;
// ou tp ut t h e JSON encoded o ut pu t
echo s t r i p s l a s h e s ( jso n_e nc ode ( $ a r r ) ) ;
?>