1
Real time processing of environmental
gamma ray spectrometry data
Jie Zhou
September 2012
Dissertation submitted in partial fulfillment for the degree of
Master of Science in Information Technology
Computing Science and Mathematics
University of Stirling
Abstract
Nowadays radioactively contaminated land is a pressing issue. Scottish Environment
Protection Agency (SEPA) pays attention to monitor radioactivity. There are several detector
manufacturers in the world. Such as ORTEC, Radiation Detection Company (RDC) and
CANBERRA company. But they all pay more attentions to the detector and lost sight of the
usability of the software. The functions design is not satisfy with users demand.
This project developed a JAVA application to implement function extension of software
“ORTEC MAESTRO-32”. It is a software based on MAESTRO-32 and implements some
functions more.
What I want to achieve: The software uses dynamic rainbow graph to represent the data
information. When the graph displaying there is a geographical position value with it. The
software should allow users to see designated range of rainbow graph.
How to address problem: Using .JOB function in MAESTRO-32 to gain data, then utilize
data to display graph on the basis of users’ professional requirements.
The main part of the project is to collect the data from detector and display method. The
application uses .JOB function in MAESTRO-32 to run a JOB task. The task asks
MAESTEO-32 to automatically save data file in users’ designated folder. Then application
uses the data to represent as dynamic rainbow graph.
The objective of the project is achieved. Most Functions are achieved. The software can gain
the data correctly then use the data to display dynamic rainbow graph. The graph can real
time represent the correct data information. The software provides a warning record function
and GPS position function. It has great practical significance and can be used in the
radioactivity detection.
Attestation
I understand the nature of plagiarism, and I am aware of the University’s policy on this
I certify that this dissertation reports original work by me during my University project except
for the following:
The component used to collect data of the Garmin GPS 72 is referenced with
SerialPortExample.java[15].
Signature
Date
Acknowledgements
I want to thank all the lecturers of my MSc IT course.
I would like to give my special thanks to my supervisor Dr Simon Jones for his great help
and powerful support during the project.
I would like to thank Dr Andrew Tyler who comes from Biological & Environmental Sciences
department of University of Stirling to give me a Environmental Sciences technology support.
Thanks Biological & Environmental Sciences department lends the Garmin GPS 72, the
radiation detector, a laptop and the software “ORTEC MAESTRO-32” to me for testing.
Thanks to my family for understanding and support in my daily life.
Table of Contents
Abstract………………………………………………………………………………………ⅰ
Attestation……………………………………………………………………………………ⅱ
Acknowledgements…………………………………………………………………………..ⅲ
Table of Contents……………………………………………………………………………..ⅳ
List of Figures………………………………………………………………………………..ⅶ
1. Introduction……………………………………………………………………………….1
1.1 Background……………………………………………………………………………1
1.2 Scope and Objectives…………………………………………………………………2
1.3 Achievement…………………………………………………………………………..2
1.3.1 Dynamic rainbow graph………………………………………………………...2
1.3.2 Range display………………………………………………………………….. 2
1.3.3 GPS position……………………………………………………………………3
1.3.4 Warning recorder……………………………………………………………….3
1.4 Overview of Dissertation………………………………………………………………3
2.
State-of-The-Art…………………………………………………………………………...4
2.1 ORTEC MAESTRO-32………………………………………………………………4
2.2 Genie™ 2000 Basic Spectroscopy Software ………………………………………...4
3.
Analyze requirements..........................................................................................................6
3.1 Analysis of “Using rainbow graph to display data”……………………………………7
3.2 Analysis of “range display”……………………………………………………………8
3.3 Analyze requirement “GPS position”………………………………………………….8
3.4 Analyze requirement “Display detects indexes”……………………………………….9
3.5 One additional function I want to implement………………………………………….9
4.
Software design…………………………………………………………………………..11
4.1 Design of “how to collect detector data”……………………………………………..12
4.2 Design of real time processing data…………………………………………………..12
4.3 Design of dynamic rainbow graph……………………………………………………13
4.4 Design of range display……………………………………………………………16
4.5 Warning recorder…………………………………………………………………..16
4.6 Design of GPS position……………………………………………………………17
5. Implementation…………………………………………………………………………….18
5.1 How to collect data from detector………………………………………………….18
5.2 How to utilize data file……………………………………………………………..19
5.3 Understanding of rainbow graph…………………………………………………..23
5.3.1 Meaning of data in graph…………………………………………………….23
5.3.2 Gain changing rate…………………………………………………………...23
5.4 Set color……………………………………………………………………………25
5.5 Draw dynamic rainbow graph……………………………………………………..25
5.6 Range display………………………………………………………………………27
5.7 Warning record……………………………………………………………………..28
5.8 GPS function……………………………………………………………………….30
6. Testing and Users feedback………………………………………………………………...32
6.1 Testing the .JOB function………………………………………………………….32
6.2 Testing display dynamic rainbow graph…………………………………………...32
6.3 Testing Threads…………………………………………………………………….33
6.4 Testing warning record function…………………………………………………...34
7. Conclusion…………………………………………………………………………………35
7.1 Summary…………………………………………………………………………...35
7.2 Evaluation………………………………………………………………………….36
7.3 Future Work………………………………………………………………………..37
7.3.1. Optimize function…………………………………………………………...37
7.3.2 Increase new functions………………………………………………………38
References…………………………………………………………………………………….40
Appendix 1 – Operation system requirement and JRE requirement …………………………42
Appendix 2 – User guide……………………………………………………………………..43
List of figures
Figure 1. Radioactivity pollution……………………………………………………………...1
Figure 2. Display mode of MAESTRO-32……………………………………………………4
Figure 3. Display mode of Genie™ 2000 Basic Spectroscopy Software……………………..5
Figure 4. Diagram of software development procedure………………………………………6
Figure 5. An example of rainbow graph………………………………………………………8
Figure 6: Operational principle diagram of software…………………………………………11
Figure 7. Principle of collecting data…………………………………………………………12
Figure 8. Coordinate system………………………………………………………………….13
Figure 9. Display of the 1st second……………………………………………………………14
Figure 10. Display of the 2nd second………………………………………………………...15
Figure 11. Basic display panel and area display panel run respective rainbow
graph. ……………………………………………………………….....................16
Figure 12. Screenshot of rang display interface……………………………………………...16
Figure 13. Sample of .JOB file……………………………………………………………….18
Figure 14. Open the data file”TEST000.SPE” withWinPlots………………………………...20
Figure 15. Open the data file”TEST000.SPE” with notepad…………………………………20
Figure 16. Sample of data file………………………………………………………………..22
Figure 17. Two continuous data files…………………………………………………………24
Figure 18. A series screenshot of dynamic rainbow graph…………………………………..27
Figure 19. sample of range display…………………………………………………………..28
Figure 20. Warning record……………………………………………………………………29
Figure 21. USB port setting…………………………………………………………………..30
Figure 22. Sample of output of sentenceRead………………………………………………..31
Figure 23. Thread testing…………………………………………………………….33
Figure 24. Result of warning record…………………………………………………34
Figure 25. Some information of data file……………………………………………………38
Chapter 1. Introduction
1.1
Background
Everything in the world is made up of atoms. Some atoms are stable but some are not.
Radioactivity is the process whereby unstable atomic nuclei release energetic subatomic
particles. Radioactivity was first discovered in 1896 by the French scientist Henri Becquerel,
and then radioactive materials are used widely in industry, military, medicine and research.
In the past 100 years, people extensive used radioactive materials without long-term plan.
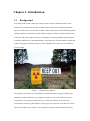
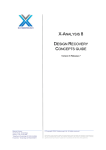
Nowadays radioactively contaminated land is a pressing issue. It harms human’s health and
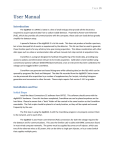
reduces living space of human. Figure 1 shows a Polluted area, this area is not suitable to
live for human.
Figure 1.
Radioactivity pollution.
Now people notice that issue and Scottish Environment Protection Agency (SEPA) pays
attention to monitor radioactivity [1]. ORTEC Company is one of the world's best-known
manufacturers who produces radiation detector to detect the radioactivity and develops
corresponding software [2]. But ORTEC Company pays more attention to the detector and lost
sight of the usability of the software. For example the Biological & Environmental Sciences
department of University of Stirling uses software named “ORTEC MAESTRO-32 version 6.08”
[3] to detect radioactivity. This software uses lines and points to show the radioactivity values.
Users feel that is not use-friendly enough and they want more useful functions. There is a sample
graph of display mode in chapter 2.
1.2
Scope and Objectives
Because ORTEC MAESTRO-32 has some defects, the objective of this project is to develop a
Java application which is based on ORTEC MAESTRO-32 and has some extra functions to satisfy
users’ demands. ORTEC MAESTRO-32 uses lines and points to show index values, but we need
to show values with dynamic rainbow graph. A rainbow graph can directly show three indexes and
it is easy to distinguish the increase rate of the counter. ORTEC MAESTRO-32 does not have a
GPS position with data. Any data without GPS position is not meaningful, we do not know the
data stands for where the data providers information about. A GPS function is necessary.
1.3
Achievement
Some main functions had been achieved.
1.3.1
Dynamic rainbow graph
A dynamic rainbow graph: the application will use the data that comes from the detector to
show a real time moving colorful graph. The graph can reflect three monitoring indexes. X
axis stands for channels, Y axis stands for time and color stands for counts. User can control
start display rainbow graph, stop displaying and the dynamic frequency of the graph. I will
amply introduce the dynamic rainbow graph in Chapter 3.1.
1.3.2
Range display.
Base on display dynamic rainbow graph, user can choose display range by typing number,
application allows users to choose different range to display part of dynamic rainbow graph
and control its proceeding.
1.3.3
GPS position
Give a GPS position to let user know this rainbow graph shows the data detected in this
position. The GPS position data is from a Garmin GPS instrument named “GPS 72” [4]. The
GPS position consists of a longitude value and a latitude value. It can locate any position
accurately. The degree of accuracy is 15.3 m.
1.3.4
Warning recorder
Warning record feature allows users to set a warning level and then the recorder will check
data all the time. If some data exceeds the warning level, it will record this data information in
a record note. Users can gain the warning information in a time interval.
1.4
Overview of Dissertation
In the dissertation, there are 7 chapters. They are introduction, state-of-the-art, analyze
requirements, software design, implementation, testing and conclusion. The introduction part
introduces the background of the project and what functions the project already achieved.
State-of-the-Art will expound the existed software in detecting radioactivity and its defect.
Chapter 3 to chapter 6 is divided by software development procedure. The first is analyzing
clients’ requirements. In this step, clients’ requirements will be analyzed from rationality point
of view and technical difficulties. Predict problems may meet in software developing. The
second is design software. Design software includes structure design and detail design. In this
step the design thinking will be expounded and answers of predicted problems will be given.
The third is implementation part. This part will amply expound how to achieve requirements
by coding and some core methods. The fourth is testing and user experience. This part shows
some functionality tests. Conclusion has three parts. They are summary, evaluation and future
work. Summary will review the achievement of the project. Evaluation is a performance
evaluation of the software. Future work part will plan some additional functions and optimize
program.
Chapter 2.State-of-The-Art
2.1ORTEC MAESTRO-32
“For 50 years, ORTEC has been an industry leader in the design and manufacture of precision
detectors, signal processing electronics, software, and systems for industry, academia, and
government requirements. [5]” ORTEC MAESTRO-32 is widely used in radiation detector.
Operation system required: Microsoft Windows 98, 2000, NT and XP. The software can
accurately display lots of environmental indexes such as counts [6], energy [7].
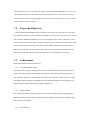
MAESTRO-32 has functions of calculating sum, gross area and net area [8] but
MARSTRO-32 does not satisfy all users’ requirements. Its display way is not perfect. Users
only can see points and lines in screen and this cannot show the detection information
directly. It increases using difficulty of users.
Figure 2. Display mode of MAESTRO-32
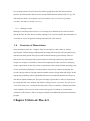
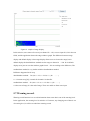
2.2 Genie™ 2000 Basic Spectroscopy Software.
Genie 2000 Basic Spectroscopy Software is radiation detection software designed by
CANBERRA company. It is a comprehensive environment for data acquisition, display and
analysis of gamma and alpha spectrometry data. It also uses lines and points to display data
information. It independent supports for over 250 detector inputs, Compatible with
Windows® 7 (32-bit), Windows XP Professional, SP2, Windows Vista® Enterprise and
Business Editions, Windows 2003 Server R2 and Windows 2008 Server (32-bit).[9]
Figure 3. Display mode of Genie™ 2000 Basic Spectroscopy Software
Chapter 3.Analyze requirements.
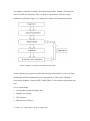
According to principle of software development procedure .Software development
can be divided into four parts. They are analyze requirements, software design,
implement and testing. Figure 2 is a diagram of software development procedure.
Figure 4. Diagram of software development procedure
At the beginning, my supervisor and I had a meeting with software users come from
the Biological & Environmental Sciences department of University of Stirling. I
received the feedback of using ORTEC MAESTRO-32. Record the requirements they
give.
Users’ requirements.
1. Using rainbow graph to display data.
2. Support area display.
3. GPS position.
4. Display detect indexes.
3.1 Analysis of “Using rainbow graph to display data”
According to the feedback of using ORTEC MAESTRO-32 and their requirement, I
analyze the requirement. Because of ORTEC MAESTRO-32 using line and point to
show data. It is not easy to read and predict. It is not helpful for monitoring. Color is
easy to understand the meaning than number. For example people do not know if
1000 is high or low in radioactivity detection. But we know red stands for dangerous
in common sense. So a rainbow graph is better than lines in showing data. The
detector is sending data to laptop continually, so the rainbow graph should be
dynamic. If the graph is changing and it should have a change frequency. Users
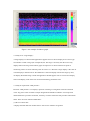
should have right to choose the changing frequency by themselves. Figure 3 is an
sample of rainbow graph. A dynamic rainbow graph sample can be seen in chapter
5.5. To achieve this function, it involves some technical points:
(1).Data connection.
How to receive data sending by detector.
(2).Real time process data.
How to control data process frequency.
(3).Draw rainbow graph.
How to make the graph be dynamic.
(4).Set rainbow colors
Set a standard to use different colors to express different data range.
(5).Set changing frequency of rainbow graph.
Users can set the changing frequency of rainbow graph. It means users can control the
movement speed of rainbow graph.
(6). Threads.
The application needs to have the ability to run several functions simultaneously. And
users should be allowed to control “start”,”stop” and “start again”.
Figure 5. An example of rainbow graph
3.2 Analysis of “range display”
A range display is a function that application supports users to choose display area. If users type
two number to make a range (for example 50,100. The range is 50-100), then the screen only
displays data in the range with rainbow graph. It helps users to find out their focal point of
monitoring. There are some technical points as same as 3.1. Because a range display is the same as
overall display in technical level. The difference is that area display chooses the range by users,
not display the default range. I think the application should support users to execute area display
and overall display in the same time. So thread technology should be used.
3.3 Analyze requirement “GPS position”.
Function “GPS position” is to display a position consisting of a longitude value and a latitude
value. Any place in the world has a unique longitude and latitude coordinate .Users hope each
detected data has a position coordinate , then they can know where the data providers information
about. There are some technical difficulties:
(1).How to collect data.
A laptop collected data from another device will involve interface recognition.
(2).How to choose data.
If I can collect data from GPS 72, I am not sure the data type is valid for my application. If the
data type is invalid, how can I change the data type to satisfy my application. When the data type
is valid, find out the useful information from all data. The application only needs longitude and
latitude coordinate. So it can ignore any other information just focus on longitude and latitude
values.
3.4 Analyze requirement “Display detects indexes”.
Display some detect index to let users know the detection report. It involves lots of environmental
science technology and some formulae. I am not sure if the value that collected from the data file
can be directly used or it needs to use formulae to gain the result. I do not have background of
Biological & Environmental Sciences. So I do not know meaning of these indexes and how to
output values of these indexes. In order to do this part, I need support of Biological &
Environmental Sciences department of University of Stirling. No professional background and
setting formulae are the difficulties in this requirement. I cannot give a prediction for this
requirement. In another word, I am not sure I can achieve this requirement perfectly. Because my
dissertation only has three months, I make an achievement order. I will try to achieve other
requirements prior.
3.5 One additional function I want to implement.
I think about the utility of the application. And I want to add a “warning recorder”. This function
is to support users to set a warning level when the application and the detector are running. If
sometime the detection index is out of warning level, the warning recorder will record that data
information. I hope it can help users to implement time interval monitor or daily check. It means
users just need turn on detector and run program then they check once end of the day, they can see
the warning data information of the whole day. Some technical key point I consider:
(1).Problem of data.
The data is sent by detector. How to collect data and choose the useful value in data.
(2).Update warning record.
In common way I will write the information out of warning level into a file. And each
time, I just display the warning information from start application to the end. So there
is a key point in how to update warning record. It mean when the application run the
second time, warning record should delete information happen in application running
in first time.
(3). Synchronization
Warning recorder should be synchronous with display of rainbow graph. Rainbow
graph is changing all the time. If stop the function, the rainbow graph will stop. In the
same time, the warning recorder should check all data information from starting
displaying rainbow graph to the stopping time point. Do not be early or late.
Chapter 4.Software design.
In this chapter, the theoretical methods will be given to achieve requirements and
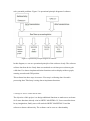
solve potential problems. Figure 5 is operational principle diagram of software.
Figure 6: Operational principle diagram of software
In this diagram, we can see operational principle of the software clearly. The software
collects data from device firstly then uses methods to real time process data to gain
valid data. Use data to implement distinct functions such as display rainbow graph,
warning recorder and GPS position.
This software has three steps in essence. First step is collecting data. Second is
processing data. Third step is using data to implement functions.
4.1 Design of “how to collect detector data”.
The objective of this project is to design additional functions to make users use better.
So if some functions already exist in ORTEC MAESTRO-32, Users can utilize them.
In my imagination, finally users will run both ORTEC MAESTRO-32 and the
software to detect radioactivity. The software can be seen as a functionality
supplement. The software cannot collect data from detector directly, because it has
high level technical difficulty. This project uses ORTEC MAESTRO-32 as an
interface to solve this problem.
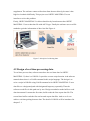
Firstly, ORTEC MAESTRO-32 collects data directly from detector then ORTEC
MAESTRO-32 saves that data file with ASCII type. Finally the software uses read file
method to gain the information of data. Just like Figure 6.
Figure 7. Principle of collecting data.
4.2 Design of real time processing data.
To real time process data, software must have the real time data. In ORTEC
MAESTRO-32, there is a JOB file .It provides execute script function. And software
manual shows there is a LOOP command in this script language. The design is to
write a script in JOB file using LOOP command to let ORTEC MAESTRO-32 save
data files to a designated path with designated frequency repeatedly. Then the
software reads files in this path one by one. Design a method to make buffer to read
data incremental. It means the first time; buffer reads the first export data file. The
second time buffer reads the first and second export data files. And so on. It can
achieve real time gaining detector data. The detail of .JOB file will be introduced in
chapter 5.1.
4.3 Design of dynamic rainbow graph.
A rainbow graph uses color to express index. So the software uses RGB color system
to set different colors. Using green to stand for the lowest count level. It means safe.
Using yellow to stand for the medium level of value. The software has 6 different
kinds of colors from blue to red. Red means dangerous. Because the software reads
data file with incremental order. It is good for displaying dynamic rainbow graph.
Imagine this, when users open the software without pressing start display button, the
window just shows a coordinate system (figure 7).
Figure 8. Coordinate system
Assume that the read data frequency is set in one second. In another word, software
reads data file once per second. When users start displaying rainbow graph, the first
second, there is only one line in the screen (figure 8). This line stands for one second’s
data information.
Figure 9. Display of the 1st second.
Then in 2nd second, the first line move one unit up and there is a new line appears
(figure 9).
Figure 10. Display of the 2nd second.
So the method is designed to read file from last one to first one. This can satisfy the
rainbow display requirement. In this function, the thread is used to control the
proceeding. It supports to run several threads simultaneously. For example, in the
same time, basic display panel and area display panel run respective rainbow graph.
(figure 10)
Basic Display:
Area Display:
Figure 11. Basic display panel and area display panel run respective rainbow graph
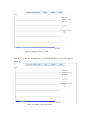
4.4 Design of range display.
The method is almost the same as 4.3. A range display can be seen as a plus function of”display
rainbow graph”. Difference is that display rainbow graph has a default display range. But range
display allows users to set the display range (figure 11). It just needs to do some modification in
draw rainbow method to let users input a range.
Figure 12, Screenshot of rang display interface.
4.5 Warning recorder
Add command in the read file method to check each value if it exceeds the warning level. If any
data exceeds warning level, the application will write the data in a record file. Then when users
want to read the record information, the application will read the record file and display the
information. In the design, record only displays the warning information from software starts
detection to stop. When “Display rainbow graph” button is pressed, software will empty the record
file, and then if any data exceeds warning level, the software will write it into this record file.
When “show warning record” button is pressed, software read data from this record file to display
on screen. The detail will be explained in chapter 5.7.
4.6 Design of GPS position
The GPS device is Garmin GPS 72. That GPS 72 conforms to the NMEA 0183
specification [10] through its RS232 interface. Maybe it is possible to connect its RS232 interface
to laptop’s USB socket. Java Marine API is an NMEA 0183 parser library for Java 1.5 and
newer [11]. In the library there some useful command such as getSentence(), getPosition(),
getLatitude() and getLongitude(); With this command, the application can gain the
geographical position with latitude and longitude values. The detail will be explained in chapter
5.8.
Chapter 5. Implementation
5.1 How to collect data from detector
In design stage, this function is designed to use the detector to save data files with a
designated frequency. How can the detector save data files automatically? MAESTRO-32
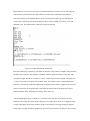
provides a JOB function with running .JOB file [12]. The .JOB file is a file to allow users to write
what they want to do in it. Then the software will run the .JOB file and execute the instruction in
it. .JOB file is very similar as a script. A MAESTRO .JOB file consists of one or more lines of
ASCII text representing a series of commands that can automate most of the functions.
a .JOB example (figure 12):
Here is
Figure 13 Sample of .JOB file
SET_DETECTOR 1: MAESTRO-32 selects detector 1 to be the execution detector. Because
there might be more than one detector connect MAESTRO-32.
SET_PRESET_LIVE 100: this instruction set the run time of this job. That is 100 seconds.
LOOP 10 ………END_LOOP: This command means do commands between “LOOP 10” and
“END_LOOP” for 10 repetitions.
CLEAR and START: It clears the data in active detector and starts it.
WAIT 8: delay for 8 seconds.
FILL_BUFFER: Display the data information sent by detector to the buffer.
SAVE "D:\Workspaces\MyEclipse 8.5\KKK\TEST???.SPE": this one is the most important
command. It tells MAESTRO-32 to save the data in the buffer to a data file to a designated
path with a designated format. The JAVA application only can read the .SPE file efficiently.
So the .JOB file handles MAESTRO-32 to save data file with SPE format.
QUIT: when all the commands are finished and the live time is over. Then terminate this copy
of MAESTRO-32.
In order to handle another program in the Java application, the application called a method
“exec()”. Using an instruction to implement this:
try {
process
=
Runtime.getRuntime().exec("C:\\Program
(x86)\\Maestro\\
Files
Mca32.exe F:\\123\\1.job");
} catch (Exception e) {
System.out.println("Not exist");
}
What the application really wants to do is to run the JOB file named “1.job”, but the script
function of .JOB file is in MAESTRO-32, so the application must run MAESTRO-32 first.
“Mca32.exe” is the execution file of MAESTRO-32, “C:\\Program Files (x86)\\Maestro\\” is the
path of Mcs32.exe. With the path, the program can find mca32.exe correctly then run it. After
running it, execute the “1.job” file in fold 123 in disk F. After using “exec()” to run a .JOB file,
MAESTRO automatically saves data files in the designated path, then the application can find the
right data file with right format in the right place.
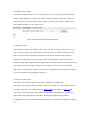
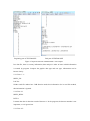
5.2 How to utilize data file.
When the data files are collected, data analysis is the first step. The read file method must be
designed accord with data type. Double click the data file “TEST000.SPE”, it is a graph:
Figure 14. Open the data file”TEST000.SPE” with WinPlots
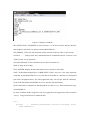
Open the data file”TEST000.SPE” with notepad, the data detail can be seen:
Beginning part of TEST000.SPE
End part of TEST000.SPE
Figure 15 Open the data file”TEST000.SPE” with notepad
In a data file, there is so many information, data analysis is order to know which information
is wanted by program. Compare the graphic data type and text type, information can be
known clearly:
5.2.1 Line 0 – 1:
$SPEC_ID:
Lab Test
Neither read file method nor .JOB function needs this information. So in read file method,
this information is ignored.
5.2.2 Line 2-3
$SPEC_REM:
DET# 1
It means that data is detection result of detector 1. In the program, the detector number is not
important, so it is ignored too.
5.2.3 Line 4-5:
DETDESC# MCB 129
AP# Maestro Version 6.08
This gives the information of software version.
5.2.4 Line 6-7:
$DATE_MEA:
08/28/2012 05:14:25
It is the start time of this mission. That’s necessary. Any mission needs to give a start time to
let users know, when it starts.
5.2.5 Line 8-9:
$MEAS_TIM:
22
This means how many seconds past after mission starting. The first 2 stands for real time. The
second 2 stands for live time. Every detection mission may have a live time limit. This limit is
handled by users. In this mission, the Live time limit is 100 seconds. (This information will be
shown later). It means this mission just run for 100 seconds and it will stop. This 2, means the
2nd second in the live time limit.
5.2.6 Line 10-11:
$DATA:
0 1023
Show that, there is 1024 data in this data file from 0 – 1023.
5.2.7 Line 12-1035:
This is 1024 data lines. The detector detects different object can get different values. These
values react in these lines with integer type. For example when the detector is detecting a
banana, all value in channels is increase very slowly. But when the detector is detecting a
radioactivity metal, the values of most channels are increasing fast. This is the most important
part which the read file method wants.
5.2.8 Line 1042 – 1045
$PRESETS:
Live Time
100
0
This is the mission live time limit. From 0 -100.
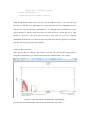
5.2.9 Line others
Figure 16. Sample of data file.
From line 1036 to line 1053 except line 1042-1045, there is lots of information. Such as ROI,
ENER_FIT, MCA_CAL and SHAPE_CAL. They involve some result of formulae calculation
and professional technology of environmental science. If these data can be used, it makes the
application more powerful. It may be done in future.
5.3 Understanding of rainbow graph.
5.3.1 Meaning of data in graph.
The rainbow graph uses color to show the different changing rate in different energy channel.
According to the data files come from detector, each data file stands for total counts in a
moment. For example” $DATE_MEA: 08/29/2012 16:38:39 $MEAS_TIM: 5 5”, this stands
for the data which when the mission run at the 5th second and record the total counts in
different 1024 channels. The counts in different channels are static or increasing all the time.
The objective of rainbow graph is to show the increasing rate in each channel.
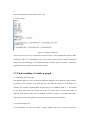
5.3.2 Gain changing rate
In the beginning, the data store folder is empty. When users press “Connect to detector”
button, it will run .JOB function in Maestro-32. Then Maestro-32 will save data file in data
store folder with a given frequency. When there are two data files in data store folder, The
application start to read data file. Because the display meaning is changing rate. The method
is designed to read two continuous data files. Then use the data in the late one to subtract the
data in the early one. Finally it will gain 1024 values in 1024 different channels. Those values
are the change in 1024 channels. Then divide by interval time. Give a brief example:
Data File A
Data File B
Figure 17. Two continuous data files.
A is the data file of the 5th second. B is the data file of the 7th second. The interval time is 7 –
5 = 2 seconds. In channel 1, both A and B are 0. So the change is 0 – 0 = 0. The changing rate
is 0 / 2 = 0. An in channel 14 is 6 and B in channel 14 is 8. So the change is 2 – 0 = 2, the
changing rate is 2 / 2 = 1. User can use the different changing rate in different channel to
predict what is the detected object.
public void drawRainbow(int count, BufferedWriter output){
File
file
=
new
File( "data");
File[]
listfile
=
file.listFiles();
for (int j = 0; j <count-1;j++)
{
readData1(listfile[count-j-2]);
readData2(listfile[count-j-1]);
for (int n = 12; n < 212;n++)
{
z = array[n].substring(0, 8);
x = z.lastIndexOf (" ");
y = z.substring(x+1,8);
double a = Integer.parseInt(y);
d = data[n].substring(0, 8);
e = d.lastIndexOf (" ");
c = d.substring(e+1,8);
double b = Integer.parseInt(c);
double f ;
f = (b-a)/timeInterval;
...................
}
}
}
This is the method to gain changing rate if the frequency is set as 2. Putting data of two data
files into array [] and data []. Then using value in data[n] to subtract
array[n]. Different n
stands for different channels. f is changing rate, in order to be accurate; the type of f is double.
In this method, the application only focuses on channel 0 – 200.
5.4 Set color
According to some standard of environmental science and users’ willing, this program
basically sets 6 colors to stand for 6 different changing rate levels. They are blue,
green, yellow, orange, deep pink and red. The order is from low counts to high counts.
In the view of environmental science, the order is from safe to dangerous.
Blue: changing rate smaller than 3.
Green: changing rate is larger or equals to 3 and smaller than 6.
Yellow: changing rate is larger or equals to 6 and smaller than 9.
Orange: changing rate is larger or equals to 9 and smaller than 12.
Deep pink: changing rate is larger or equals to 12 and smaller than 15.
Red: changing rate is larger than or equals to 15.
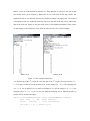
5.5 Draw dynamic rainbow graph.
The coordinate system includes channel axis, time axis and color. A time value and
channel value can position a point. But in this graph, a time value and channel value
position a small rectangle with size 2 x 5. So in one second, the application draws 200
rectangles horizontally. In next second, these 200 horizontal rectangles move to
upward. And new 200 horizontal rectangles are drawn in the bottom. The rest is
deduced by analogy. This makes the graph movable.
for (int j = 0; j <count-1;j++)
{
for (int n = 12; n < 212;n++)
{
................
main.bufferG.setColor(chooseColor(f));
main.bufferG.fillRect(30+2*(n-12),525-5*j,2,5);
}
}
This code is in loops. f is the changing rate gain by calculating.
Application uses
chooseColor(float f) method to find the corresponding color to draw the unit rectangle. (n-12)
stands for the channel number. n is a number from 12 to 211.For example if n = 12, then fill a
rectangle in position (30,525-5*j) with size 2x5. This j is a count to record the movement
times. Variable n can make the rectangle horizontal movement and j can make the rectangle
vertically. Below is a series of dynamic rainbow graph:
The 1st second:
The 2nd second:
The 3rd second:
The 4th second:
The 5th second:
Figure 18. A series screenshot of dynamic rainbow graph
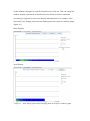
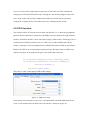
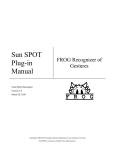
5.6 Range display.
This function allows users to input two numbers to make up a range. Then application only
displays rainbow graph in the given channel range.
Figure 19. sample of range display.
In this mission, users want to focus on just channel 50 – 150, so users input 50, 150 in the text
fields, and the application drawn the range rainbow graph. The difference between range
display and default display is that range display allows users to choose the range, but in
default display the drawRainbow method sets the range to channel 0
- 200. So in default
display users just can saw the rainbow graph from 0 – 200. According to the difference, The
areaRainbow method is very similar with the drawRainbow method.
Difference happened in for loop.
drawRainbow method:
for (int n = 12; n < 212;n++) { do
……}
n = 12 means array[12], it stands for channel 0 in data file.
areaRainbow method:
for (int n = 12+a; n < 12+b;n++) {do ……..}
a is the start of range, b is the end of range. These are and b are from users input.
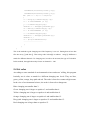
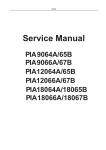
5.7 Warning record.
Warning record function is to record information when some data is out of the warning level.
In the application ,the warning level is settled to 15. It means, any changing rate of data is out
of warning level, it will be recorded into warning record.
Figure 20. Warning record.
As the figure shows, this detect mission started at 16:38:39 08/29/2012. When it was running
at real time the 27th second. It detects data in lots of channels exceed warning level. This can
give a reference to users to detect and analyze object. This checks data if it is out of warning
level function is inside the for loop in drawRainbow method. When drawRainbow method
draws each unit rectangle, it will check the changing rate of that unit rectangle if it is out of
warning level. But drawRainbow method often read same data several time. For example in
the 1st second ,channel 1 is in the bottom, but in the next second , it needs to be read again,
because this data will be drawn to move up. In the 3rd second it still needs to be read. To
optimize application, in this record method, application only reads the data when the first time
it is read.
if(data file is first time to be read in each rainbow graph
movement.)
{
get the start time, real time and live time
if (changing rate > 15)
{write data in record file.}
}
This j == 0 means when first time to read this data. f is changing rate, The method sets the
level to 15. If any data is higher than 15, then show its start time, real time, channel and
changing rate. Write this information into a warning file. This function happens when users
press “Stop” button. Then using a readRecord() method to read warning record in that
warning file to display in the screen when users press “Warning Record” button.
5.8 GPS function.
The software utilizes an external device named “Garmin GPS 72” to detect the geographical
position. Because that GPS 72 conforms to the NMEA 0183 specification through its RS232
interface, the RS232 interface can be connected to laptop’s USB sockets. Then using a JAVA
communication API library named “rxtx-2.1-7-bins-r2”[13] and an NMEA 0183 library
named ” marineapi-0.4”[14] to implement the communication between GPS 72 and software.
Because the GPS 72 has a required data transmission type, the laptop must set USB socket
with the same type. In the program, the type is also settled with same type.
sp.setFlowControlMode(SerialPort.FLOWCONTROL_NONE);
sp.setSerialPortParams(4800, SerialPort.DATABITS_8,
SerialPort.STOPBITS_1,
SerialPort.PARITY_NONE);
This code is same as the laptop USB socket setting:
Figure 21. USB port setting.
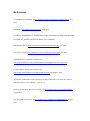
In the library class marineapi-0.4, there is a command named sentenceRead(SentenceEvent
event). It will read the data sent from GPS 72 and show by sentences (figure 21).
Figure 22.
Sample of output of sentenceRead
There are 5 lines, each line stand for one kind of data type. The aim of this GPS function is
gaining a useful geographical position to let users know where the display rainbow graph
stands for is. So the sentenceRead(SentenceEvent event) method is written to just output the
geographical position with latitude and longitude. According to the requirement, type GPGLL
is OK.
if (sentence.getSentenceId().equals("GLL")){
Position position =
((PositionSentence)sentence).getPosition();
lat = position.getLatHemisphere();
lon = position.getLonHemisphere();
latitude = position.getLatitude();
longtitude = position.getLongitude();
}
This code means just outputs the GLL sentence and gain the latitude value and longitude
value in sentence. Lat is direction of latitude and lon is direction of longitude. For example:
A geographical position is consist with (latitude direction) (latitude value), (longitude
direction) (longitude value). The geographical position of University of Stirling is N 56.08, W
03.55. The degree of accuracy of GPS 72 is 15.3 m .
Chapter 6. Testing and Users feedback
Software testing is using appropriate methods to test validity, integrity, security and
quality of software. It is executing the program in required condition to find out error
of program and measure quality of software. There are lots of tests, I choose some of
them to explain why and how I do it. And users feedback should be expounded in7.2.
6.1 Testing the .JOB function
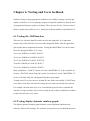
This test is to check the data file can be saved in the right place. It is important,
because only if the data files are saved in the designated folder, then the application
can read the data to implement functions. Testing the MAESTRO if it can save data
file to the designated folder. Try 5 tests.
Test 1 Set .JOB file to LOOP 5, WAIT 5.
Test 2 Set .JOB file to LOOP 50, WAIT 5
Test 3 Set .JOB file to LOOP 5, WAIT 50
Test4 Set .JOB file to LOOP 50, WAIT 3.
Test 5 Set .JOB file to LOOP 50, WAIT 1.
Brief explanation: “LOOP N” means set to ask “MAESTRO-32” to do repetition for
N times. “WAIT M” means delay M seconds. So each test is to ask “MAESTRO-32”
to save a file then delay for a designated time then repeat again.
Testing result: Every test can save all data file into folder successfully. If WAIT time
is too short. Some time, the data file saving does not catch up with the time interval.
For example, the time interval is set to 1second and repeat 50 times, sometime the
data files saving procedure will exceed 1second. So the software should be avoided to
set the time interval to very short.
6.2 Testing display dynamic rainbow graph.
The display dynamic rainbow graph function is most important function in the
software. It has a real meaning. The software is expected to use in radiation detection.
So this quality of this function must be tested. The test had been done by Dr. Andrew
Tyler who is the client of this software. He used several kinds of radioactivity materials to test
if the software can correctly display the change of rainbow graph. Some material can let the
channel 0- 50 become red, some can let the channel 0 -200 become red. So users can measure
the unknown detected object.
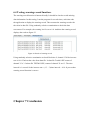
6.3 Testing Threads.
To ensure the software can provide executing multi-task simultaneously. This test is to check
if the software can respectively run basic display and range display simultaneously. First
press “Display rainbow graph”, after 15 seconds press “display” button in Area Display panel.
Figure shows two display functions respectively run simultaneously.
Basic Display panel.
Area Display panel
Figure 23. Thread testing
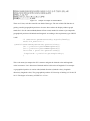
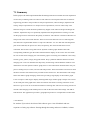
6.4 Testing warning record function.
The warning record function is human-friendly. It should be check to avoid missing
data information. In this testing, I run the program for several times, each time asks
the application to display the warning record. Then contrast the warning record with
the value in data file. Using randomly selective examination to check the data
correctness. For example, the warning level is set to 9.0. And then the warning record
displays the result as figure 23.
Figure 24. Result of warning record
Using randomly selective examination to check Real time 2, channel 35 if the increase
rate is 10.0. Find out the value from data file. In data file Test001.SPE counts of
channel 35 is 3. In data file TEST002.SPE, counts of channel 35 are 13. The time
interval is 1 second. So the increase rate = (13 – 3)/time interval = 10.0. It proves that
warning record function is correct.
Chapter 7 Conclusion
7.1 Summary
In this project, the main requirements that the Biological & Environmental Sciences department
of University of Stirling wants are achieved. The software is developed on the basis of software
engineering procedure. The procedure is analyze requirements, software design, implement and
testing. Analyze requirements is to analyze client’s requirements, to know what is they want.
Software design is to think about the problem may happen in the software design and design the
solutions. Implement step is to specifically implement the designed functions. Testing is to find
out the program error and measure the quality of software. The software is based on “Maestro-32”
and provider some more useful function. There are four main functions. First is collecting data.
This function is implemented utilizes a script to let “Maestro- 32” save data file with designated
path. In the .JOB file, the process live time, file quantity, file name and file format can be
controlled. The second is using data to draw dynamic rainbow graph. Read the data with
corresponding method to gain the useful information then display on the screen. One line stands
for one second counts changing rate. The rainbow graph is consisting of six different colors. They
are blue, green, yellow, orange, deep pink and red. They symbolize different situation of counts
changing rate. Users can determine the object they are detecting with the different rainbow color
distribution. Near the dynamic rainbow graph, there is some information about the data. They are
process starting time, live time, real time and GPS position. These information can tell users when
the detect mission start and how many seconds has the mission run. This information will change
follow the rainbow graph changing. The third is providing range display of the rainbow graph.
Users can input a valid range to display the designated range rainbow graph. It helps user to focus
on the small part of the graph and to show more detail. The fourth is warning automatic record
function. It gives a note to record the information of warning data. The aim of warning record is to
remind a data changing trend and help users to find out the rules of the data change. The fifth is
GPS function. The application providers a geographical position to correspond the real time data.
7.2 Evaluation
Dr. Andrew Tyler who is the client of this software gave a lots of feedback and user
experience of using my software. Passing through the testing and users’ feedback, it shows
that the software meets the main requirements the Biological & Environmental Sciences
department of University of Stirling proposed.
The gain data method is very simple and low technicality .It must base on .JOB function of
“Maestro-32”. It is the limit of software. There is a fatal condition limit of gaining data method.
Because “Maestro-32” saves data file automatically with a given time interval. It means display
frequency of software must be faster or equal to that time interval or the speed of reading data is
faster than the data creates. And if the speed of reading data is faster than the data creates, then
there is an error, because there is no data file to read. This fatal condition limit will be solved in
future.
In Dr Andrew Tyler’s opinion the rainbow graph display is achieved the effect he wants. The
rainbow graph can correctly show the data information. He tested this function with different
radioactivity material and the software can display the difference. But with many times of testing,
there is a potential problem. If the move frequency of rainbow graph is too fast, the movement of
graph may delay. This will be optimized in future. Dr Andrew Tyler thought six kinds of colors is
a little insufficient, 10 colors may be better. This will be modified later.
According to Dr Andrew Tyler’s requirement “want to focus on detail part of graph”, a range
display is added. And it achieved functionality of the design requirements. The range display just
support to display one range in the screen, but Dr Andrew Tyler wants to display more ranges.
This function should be considered in future.
Dr Andrew Tyler is very satisfied with the warning record function design. Because this is not in
his requirements at first. But it is very useful and intelligent for users. With many times testing,
this warning record can efficiently record the data information which accord with condition.
GPS function is the requirement Dr Andrew Tyler pay more attention to. He mentioned this
function many times. With testing, the application can display the correct geographical position in
the screen and the numerical reading will change following the position changing. Because the
degree of accuracy of GPS 72 is 15.3m, the application has the same accuracy.
7.3 Future Work
Future work should be divided into two parts. They are optimizing function and increase
new functions. In 7.2 evaluations, it involves some defects. In future work, they should be
optimized. Because of time limit, lack of technology and environmental background, some of
Dr Andrew Tyler’s requirements are not achieved in this project. For example implement
display more environmental indexes. Multi-range display. In future they will be achieved.
7.3.1. Optimize function.
There is a fatal condition limit of gaining data method. The method should be design to
avoid the speed of reading data is faster than the data creates. There is a solution. Design a
method to control the saving time interval in.JOB file to be the same as the frequency of the
rainbow graph movement. If do that, speed of reading data is equal to speed of the data
creates. It can avoid this problem.
The read data file method is valid when there are at least two data files in the folder. So if
users set the saving time interval in.JOB file to 5 second, press the “Connect to detector
“button, and press “real time rainbow graph” button in 10 second, it should be an error.
Because when the “Connect to detector” button is pressed, the .JOB file starts. Every 5
seconds it will save a data file. It needs 10 seconds to create two data files. If there is not two
data files exist, the read data file method will read data failed. There is a plan to solve this
problem. Using files.length() to real time check quantity of the data files in folder. Then give
a condition to control the different situation.
if(files.length() >= 2)
{do read data method}
else
{ wait and do decision again.}
Because display dynamic rainbow graph is read data files and draw many rectangles in
essence. When the program is running for a lot time ,and the screen display 40 seconds
information, it means the application will draw 40 seconds graph. It will be a delay. The delay
is caused by two reasons. One is arithmetic speed of PC,
the other one is method design of
program. Optimizing methods is necessary. There is a plan to focus on optimizing the read
data method and draw rainbow method.
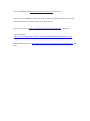
7.3.2 Increase new functions
Because the dissertation has a time limit, some requirement cannot be achieved in a short time.
But in future it is necessary. Add some environmental indexes in the screen. It can make the
software more powerful, because the software provider more information about detect
radioactivity. But environmental indexes need a professional technology required. Maybe
some index can directly gain from the data file.Such as ROI, ENER_FIT, MCA_CAL and
SHARP_CAL. This information is directly showed in data file.
Figure 25. Some information of data file
But some index may not directly gain from the data file. They need to compute with particular
formulae. The software only displays a dynamic rainbow graph and shows every data with
colorful rectangle. But there are only six colors, it means not accurate enough. Changing rate
3.1 and 5.9 are both color green. So in future work, the software needs a detail information
function. In my design. When the application is displaying the rainbow graph, users can move
mouse to anywhere in the graph, and it will show the detail indexes in that point. Such as
channel number, time, changing rate, energy value and so on.
The default display range is channel 0 – 200. But in fact the detector monitors in 1024
channels. Next stage, the panel maybe change to a movable panel. Such as scrollpanel.Using
a panel can display entire range rainbow graph. The window is not large enough to display
entire range. So part of rainbow graph may conceal. If users want to see that part, it just needs
to move scroll. Because it can show the entire range of rainbow graph, it also satisfied the
multi-range display.
References.
[1]. Radioactive Substances, http://www.sepa.org.uk/radioactive_substances.aspx , July
2012.
[2] ORTEC, http://www.ortec-online.com/ , July 2012.
[3] ORTEC MAESTRO-32, MAESTRO-32 MCA Emulator for Microsoft Windows
98, 2000, NT, and XP A65-B32 Software User’s Manual
[4]Garmin GPS 72, https://buy.garmin.com/shop/shop.do?pID=214, July 2012.
[5] Company Profile, http://www.ortec-online.com/aboutus/index.aspx , July 2012
[6] RADIATION COUNTING STATISTICS,
http://holbert.faculty.asu.edu/eee460/RadiationCountingStatistics.pdf August 2012
[7] Suhas Kumar, Energy from Radioactivity,
http://large.stanford.edu/courses/2011/ph240/kumar2/, December 5, 2011.
[8]Calculate, MAESTRO-32 MCA Emulator for Microsoft Windows 98, 2000, NT, and XP
A65-B32 Software User’s Manual,
page 71 -78.
[9] Genie™ 2000 Basic Spectroscopy Software, http://www.canberra.com/products/834.asp,
August 2012.
[10]. The NMEA 0183 Protocol, http://www.tronico.fi/OH6NT/docs/NMEA0183.pdf, August
2012.
[11]. Java Marine API. http://marineapi.sourceforge.net/, August 2012.
[12]Job Control, MAESTRO-32 MCA Emulator for Microsoft Windows 98, 2000, NT, and XP
A65-B32 Software User’s Manual, page 78-79, page 105-129.
[13] rxtx-2.1-7-bins-r2, http://rxtx.qbang.org/wiki/index.php/Download , August 2012.
[14]marineapi-0.4,
http://en.sourceforge.jp/projects/sfnet_marineapi/downloads/Releases/marineapi-0.4.zip/,
August 2012.
[15]SerialPortExample.java,http://www.java-samples.com/showtutorial.php?tutorialid=214, July
2012.
Appendix 1 – Operation system requirement and JRE requirement
Because the “ORTEC MAESTRO -32” has a limit of operation system.
The system required:
Microsoft Windows 2000 Professional
Microsoft Windows XP Professional SP2
Microsoft Windows Vista.
This is a JAVA application. It can be run with Java 1.5 or newer.
If user wants to use GPS function, please follow this guidance:
First, identify your Java Runtime Environment's folder. For version 1.6.0,
Copy rxtxSerial.dll to c:\Program Files\Java\jre1.6.0_01\bin\.
Copy RXTXcomm.jar to c:\Program Files\Java\jre1.6.0_01\lib\ext\
Add RXTXcomm.jar and marineapi.jar into JAVA library.
For detail, you can find the information:
http://rxtx.qbang.org/wiki/index.php/Installation_for_Windows
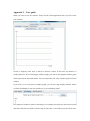
Appendix 2 – User guide
When you want to use the software, firstly run the JAVA application, then you will see the
user interface.
Choose a frequency, then click “Connect to detector” button. In this time, the detector is
starting detection. Then click Display rainbow graph, you will see the dynamic rainbow graph
which represent the data information. You can control the start, stop, continue again and clean
window.
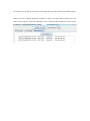
If you want t o see some part of rainbow graph, you can use range display function .Please
click the AreaDisplay in the user interface to go to AreaDisplay panel.
First input two number to make a valid range. For example you input 50 in the front text field
and 100 in the back text field, it means range 50-100, that is valid. But if you put 100 in front,
50 in black, it is invalid. If you enter a valid range, then you can see the range rainbow graph.
When you start to display graph, the software is check every data with warning level. You
need to click stop first, then click “Warning record” in Warning Record panel to see the result.