1
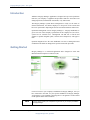
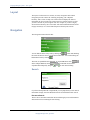
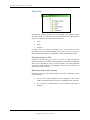
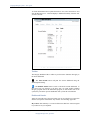
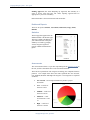
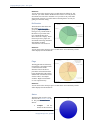
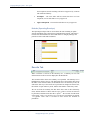
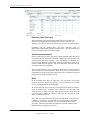
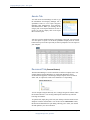
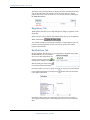
Alfadata Technologies Corporation Integrity Manager User Guide Integrity Objects.NET 2/25/2011 12:48:00 PM Copyright 2008 Alfadata Technologies Corporation. All Rights Reserved. Page 1 Integrity Manager system – User guide Overview This document is to provide new users of Alfadata’s Integrity Manager Application with a basic understanding of the purpose of the Integrity Manager Application and steps guiding its use. Integrity Manager is primarily targeted for the Operations Management team within an organization. Contents OVERVIEW .................................................................................................. 2 INTRODUCTION ............................................................................................ 3 GETTING STARTED ...................................................................................... 3 LAYOUT ...................................................................................................... 4 NAVIGATION ................................................................................................ 4 Search.......................................................................................................... 4 Hierarchy .................................................................................................... 5 Expanding an Area or Field ............................................................................... 5 Selecting an Area, Field or etwork .................................................................. 5 Help ............................................................................................................. 6 CONTENT WINDOW ...................................................................................... 6 Overview Tab .............................................................................................. 6 Toolbar ............................................................................................................... 7 Dashboard Header .............................................................................................. 7 Dashboard Reports ............................................................................................. 8 Statistics ............................................................................................................. 8 Assessments ....................................................................................................... 8 Deficiencies ........................................................................................................ 9 Flags ................................................................................................................... 9 Status .................................................................................................................. 9 Defaults (Operating Envelope) ......................................................................... 10 Results Tab ................................................................................................ 10 Deficiency Items (item type) ............................................................................ 11 Actions (recommendation) ............................................................................... 11 Risks ................................................................................................................. 11 Document Tab (licensed feature) .............................................................. 12 Regulatory Tab .......................................................................................... 13 otifications Tab ....................................................................................... 13 Schematics Tab.......................................................................................... 14 Maps Tab ................................................................................................... 14 TERMINOLOGY...........................................................................................14 Deficient Articles ............................................................................................. 14 Deficiency Items .............................................................................................. 14 2/25/2011 12:48:00 PM Copyright 2007 Alfadata Technologies Corporation. All Rights Reserved. Integrity Manager User guide.doc Page 2 Integrity Manager system – User guide Introduction Alfadata’s Integrity Manager Application is designed to keep track of problems related to your company’s equipment and procedures that have been uncovered during inspection, automated risk assessments, or by other means. The Integrity Manager system allows management to easily see the status of detected deficiencies, and allows employees to keep track of the actions that have been performed to help mitigate the risk associated with these deficiencies. Operations Management can use Integrity Manager’s - Integrity Dashboards to get an overview of the company’s performance at the company level, area level, system level or network level. Management can drill into a network and examine or update mitigation plans, concerns and consequences, and approve risks. Operation Engineers have the same dashboard overviews as management and can drill into the details to manage their specific actions and open items. Getting Started Integrity Manager is a web-based application and is designed to work with Microsoft Internet Explorer web browser (IE). Use IE to browse to your company’s installation of Integrity Manager, once you have connected to the URL for your specific installation of Integrity Manager you should see a screen similar to the image above. Navigation is on the left and on the right the main content windows. NOTE 2/25/2011 12:48:00 PM You may need to contact your IT department to get a URL to your company’s installation of Integrity Manager. Copyright 2007 Alfadata Technologies Corporation. All Rights Reserved. Integrity Manager User guide.doc Page 3 Integrity Manager system – User guide Layout The layout is broken into two sections (or sides): Navigation and Content. Navigation provides a menu for searching, navigating your companies hierarchy, and a section for help. The Content section displays the desired information in various forms. The Content section is context sensitive to what you have selected on your navigation side. For example: if you have Calgary selected in the hierarchy, the Content side will contain information based on the Calgary location(s). Let’s look a little deeper into these layout sections. Navigation The Navigation menu looks like this: button and shrinking You can hide the menu at any time by clicking the the menu and increase the size of the main content area. You can then bring the hidden menu back by clicking . The menu is expandable and collapsible. To expand all menus click . The individual menus can be and to collapse all menus click and on each menu heading. expanded and collapsed by using the Search If you know the Pipeline ID or Segment ID you can jump directly to the desired information. Simply enter the ID number into the search field and click search. Document Search: There is also a document search that will search through your stored documents and search for files containing the search string. 2/25/2011 12:48:00 PM Copyright 2007 Alfadata Technologies Corporation. All Rights Reserved. Integrity Manager User guide.doc Page 4 Integrity Manager system – User guide Hierarchy The Hierarchy window contains a tree for navigating your company’s logical divisions of assets. The Hierarchy tree is broken down into three different levels (these can be customized to align with your divisions): • Areas • Fields • Networks Currently, Areas and Fields are handled in the same manner and their terminology may be used interchangeably in this guide. There are two ways to interact with the Hierarchy tree; expanding the nodes and selecting the nodes. Expanding an Area or Field Clicking on the plus-sign to the left of an Area or Field will expand it allowing navigation to a network without displaying the Area/Field dashboard. In the case of expanding an Area you will see that they can contain additional Areas and/or Fields. In the case of expanding a Field, you will see that they can contain one or more Networks. Selecting an Area, Field or Network Clicking the text of an Area, Field or Network (referred to as selecting it) will do one of two things: 2/25/2011 12:48:00 PM 1. For an Area or Field a dashboard will be displayed in the contents window summarizing the Area’s/Field’s outstanding actions and items. 2. For a Network, a summarized list of open deficiency items will be displayed. Copyright 2007 Alfadata Technologies Corporation. All Rights Reserved. Integrity Manager User guide.doc Page 5 Integrity Manager system – User guide Following is an example of an expanded Hierarchy tree. Help The help section provides information and guides to assist you with Integrity Manager • User Manual: A complete guide to all features and functionalities • QuickSheet: A compressed user manual for quick reference. • Frequently Asked Questions (FAQ): List of the most asked questions and their answers. • Administrator Guide: A guide for Administrative tasks • About: Information about the Integrity Manager system Content Window On the left side of the page is your Content Window, this is where the information and reports will be displayed. The Content window will display the Integrity Dashboard, and the Deficient Article summaries. Deficient Article summaries can be expanded to show actions and risks. The dashboards contain links for Operations Engineers to jump specifically to their actions and for Operations Management to jump specifically to items requiring their approval. The Integrity Manager system includes several management level summaries intended to provide quick and accurate information about the current status of a particular area. These are the Content Window tab’s across the top: Overview Tab 2/25/2011 12:48:00 PM Copyright 2007 Alfadata Technologies Corporation. All Rights Reserved. Integrity Manager User guide.doc Page 6 Integrity Manager system – User guide To obtain information about a particular Field or Area, select the Field or Area from the Hierarchy Tree. This will display a dashboard summary form the Area you have selected. Toolbar The Integrity Dashboard has a toolbar to perform some functions that apply to the whole dashboard. - The Print Charts button will print the current dashboard using the standard printer dialog. - The Refresh Charts button is used to refresh the current dashboard. If there have been any changes to the data, from you using another Alfadata Integrity program such as the Schematics program, or from another user in the system, they will show up in the dashboard when you hit the refresh button. Dashboard Header Along the top right side of the page header you can see which user is logged in and two user specific notifications: ‘My Actions” and “Pending Approval” My Actions: This summary is a count of all the items that have actions assigned to you that are not yet completed. 2/25/2011 12:48:00 PM Copyright 2007 Alfadata Technologies Corporation. All Rights Reserved. Integrity Manager User guide.doc Page 7 Integrity Manager system – User guide Pending Approval: (aka. Items Requiring my Approval) This summary is a count of all the items that have risk values requiring approval that are appropriate to your level of authority Below this header is the current location and current date. Dashboard Reports There are six reports: Statistics, Assessments, Deficiencies, Flags, Status, Defaults. Statistics The first page that appears after the dashboard loads is the Statistic page. This page contains a breakdown of your selected division. This quick summary is created by grouping various categories together to provide valuable information at a glance. Assessments The risk assessment chart is a pie chart representing all the deficiency items in the area you have selected that have a risk associated with them. The items are separated into risk categories according your companies business practices. The example chart shows the items separated into Not Assessed, Low, Medium, Moderate and High risk categories. The categories are separated as follows: 2/25/2011 12:48:00 PM • &ot Assessed – Not enough information to produce a proper assessment • Low – A risk level between 1 and 4 • Medium – A risk level between 5 and 10 • Moderate – A risk level between 11 and 16 • High – A risk level between 17 and 25 Copyright 2007 Alfadata Technologies Corporation. All Rights Reserved. Integrity Manager User guide.doc Page 8 Integrity Manager system – User guide Drilldown: You can click on the various pie pieces to drill down. By clicking on ‘Not Assessed’ you will be taken to the Deficiencies Chart to view why the risk assessments were not able to calculate. Or if you click on any of the other assigned risk categories you will be taken to the Flag chart to see why it’s getting its current risk rating. Deficiencies The deficiencies chart shows all the current deficiency items grouped by type. The possible item types vary, but the intent of this chart is to provide at what type of problems have been uncovered in the company. These items can prevent a proper risk assessment from being calculated and resulting in a Risk Assessment of “Not Assessed”. Drilldown: You can click on the various pie pieces to drill down. A list a deficiency articles will be displayed in the Results tab Flags The Flagged Items are deficiency items that have been flagged with a certain issue that needs attention. These items do not prevent the risk assessment from being calculated but will result in default value used instead of more accurate values. An example would be ‘High Corrosion Rate’ or ‘Low Liquid Velocity’ Drilldown: You can click on the various pie pieces to drill down. A list a deficiency articles will be displayed in the Results tab Status The Status Chart is used to show what state the deficiency items are in. The possible states are as follows: • 2/25/2011 12:48:00 PM Complete – All the actions for this item have Copyright 2007 Alfadata Technologies Corporation. All Rights Reserved. Integrity Manager User guide.doc Page 9 Integrity Manager system – User guide been completed, and the resulting risk has been approved by someone with sufficient authority. • Incomplete – The item either still has actions that have not been completed, or it has risks that are not yet approved. • Approval Required – The item has risks that are not yet approved. Defaults (Operating Envelope) The Operating Envelope Chart is used to show the time remaining to update specific information, this is based upon a predefined time interval. This chart is to ensure that all information is current and relative so Integrity Manager can provide accurate results and assessments. Results Tab When a network is selected in the hierarchy tree, a summary list for each deficient article in the network is displayed in the Results tab. The screenshot below shows one summary row expanded. The summary row is highlighted in yellow at the top. The blue header above the summary line shows the name of the deficient article, the maximum risk of its deficiency items, the earliest due date any of the actions to be performed to mitigate the articles risk, the number of open deficiency items, and the total number of deficiency items. We can see from the summary line this article has a total of three deficiency items, and that all three of those items are open. There is at least one action to be performed, and that actions due date is April 7th. We can infer from the name of the article, 12301 1 (07-24-014-17-4 To 01-04-015-16-4) that this is segment 1 of pipeline 12301 and it is licensed to flow from/to the locations in parenthesis. 2/25/2011 12:48:00 PM Copyright 2007 Alfadata Technologies Corporation. All Rights Reserved. Integrity Manager User guide.doc Page 10 Integrity Manager system – User guide Deficiency Items (item type) The first deficiency item (measurement) for this article is expanded. The deficiency item header (the second blueheader) shows the item type, the deficiency, the cause for concern, the consequence, and any safe guards in place. Continuing with the example above, the three deficiency items are Measurement, Risk Ranking, and High Liquid Velocity. The measurement item has been expanded to show its actions and risks. Actions (recommendation) In the screenshot above there is one action; Integrity Manager labels the actions as recommendations. The action is intended to mitigate one or more of the risks associated with this article (pipeline). The responsibility of completing this action has been delegated to John Smith. John has completed the action on its due date, which raises the question – why is this deficiency item still open if all of its actions have been completed? The reason this deficiency item is still open is because there are risks associated with it that have not yet been approved. When all of an items actions have been completed and risks have been approved the item will be considered closed and not appear in the Integrity Manager System. Risks In the screenshot above there are eight risks. The risk header (4th blue bar) shows the categories: hazard type, approver, severity, likelihood, risk, residual severity, residual likelihood and residual risk. We can see that none of these risks have been approved, the approver column is empty for each risk row. To approve a risk, check the box to the right of the empty approver, to approve all of the risks for this deficiency item, check the box in the header. When you approve a risk, your name will appear in the approver column for that row. Notice that some of the checkboxes are grayed-out and cannot be checked. This is related to your authority. The authority level for the person this screenshot was taken for can approve risks up to a 4, any risks higher than a 4 will be grayed-out. That item will remain open until someone in the company with a higher authority level approves those risks. 2/25/2011 12:48:00 PM Copyright 2007 Alfadata Technologies Corporation. All Rights Reserved. Integrity Manager User guide.doc Page 11 Integrity Manager system – User guide Assets Tab You will use the Assets Manager in order to get the information from Integrity Manager into a spreadsheet. There are a few report categories, including: Data Management, Asset Integrity, and Measurement. When you clicking on the category title it will expand and show the list of reports you can run. Simply click on the report title to run the report. After the report has finished running it will display to the right. You can simply view the report or export it to an Excel spreadsheet. Simply click the ‘Excel’ button in the top left of the report and you will be prompted to save the report on your computer. Document Tab (licensed feature) The Document Manager is used to attach files to different company assets. For example Microsoft Word Documents or Adobe PDF Documents can be associated with a pipeline, or Protrend gas analysis reports can be associated with a well, or coupon test results can be attached to a coupon fitting. You can navigate using the hierarchy tree or simply navigate the folders within the document browser. You can drag and drop files much like any other file browsing environment. To upload a file, simply drag a file from your desktop to the document browser and place it into the desired folder. You can also use the ‘Select Files’ button, this button will launch the file open dialog, allowing you to select your desired file and upload to your current location. 2/25/2011 12:48:00 PM Copyright 2007 Alfadata Technologies Corporation. All Rights Reserved. Integrity Manager User guide.doc Page 12 Integrity Manager system – User guide The bottom of the Document Browser displays the status and information about your file uploads. This status includes: list of file names, file size, upload progress, list of any errors, file count, etc. You can clear the list by clicking on the ‘Clear List’ Button. Regulatory Tab The Regulatory tab allows you to align and approve changes to pipelines, wells, and facility. Select with type of items from the three buttons along the top, one for Pipelines, Wells, and Facilities. Two columns will show up with items in each list: Current and New. This will provide a list of discrepancies between your current reported state and the registered licensed state. Notifications Tab Integrity Manager also will notify you if certain flags or problems arise. Under the Notification’s tab you can setup who receives what notifications. To icon create a new user, click on the in the Resource Manager. You can also find an existing user click on the icon and select them from the list. Now that you have your user (or group of users) you need to select and add them to the Notifications dialog by pressing arrow is now under Notification. button. Notice the user name Now simply add or remove any of the items you wish to notify your user by selecting an ‘Unassigned Item’ and clicking of the arrows to move it back and forth. 2/25/2011 12:48:00 PM Copyright 2007 Alfadata Technologies Corporation. All Rights Reserved. Integrity Manager User guide.doc Page 13 Integrity Manager system – User guide Schematics Tab This tab is currently under construction. Once completed it will provide a simple schematic based on your selected division. Maps Tab This tab is currently under construction. Once completed it will provide a simple map based on your selected division. This will allow quick printing of your current area and its assets. Terminology Deficient Articles The deficient company equipment or procedures that are tracked by the Integrity Manager system will be referred to as ‘Deficient Articles’ in throughout this document. Deficiency Items The Deficiencies or problems with a particular Deficient Article that have be uncovered will be referred to as ‘Deficiency Items’ throughout this document 2/25/2011 12:48:00 PM Copyright 2007 Alfadata Technologies Corporation. All Rights Reserved. Integrity Manager User guide.doc Page 14