1
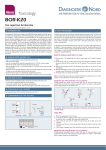
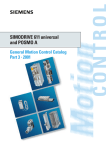
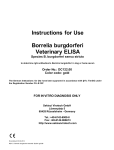
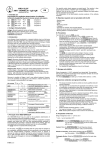
For Professional Use Only GUIDELINES to AmpliSens TBEV, B.burgdorferi sl, A.phagocytophilum, E.chaffeensis / E.muris-FRT PCR kit for qualitative detection and differentiation of tick-borne infection pathogens: RNA of TBEV – tick-borne encephalitis virus, Borrelia burgdorferi sl – Ixodes tick-borne borreliosis (ITB) pathogen, Ehrlichia chaffeensis and Ehrlichia muris – human monocytic ehrlichiosis (HME) pathogens and DNA of Anaplasma phagocytophilum – human granulocytic anaplasmosis (HGA) pathogen in biological materials by the polymerase chain reaction (PCR) with real-time hybridizationfluorescence detection Ecoli s.r.o., Studenohorska 12 841 03 Bratislava 47 Slovak Republic Tel.: +421 2 6478 9336 Fax: +421 2 6478 9040 Federal Budget Institute of Science “Central Research Institute for Epidemiology” 3A Novogireevskaya Street Moscow 111123 Russia TABLE OF CONTENTS INTENDED USE .................................................................................................................. 3 AMPLIFICATION AND DATA ANALYSIS WITH THE USE OF Rotor-Gene 3000/6000 (Corbett Research, Australia) and Rotor-Gene Q (Qiagen, Germany) INSTRUMENTS ..... 3 AMPLIFICATION AND DATA ANALYSIS WITH THE USE OF iCycler iQ and iQ5 (BioRad, USA) INSTRUMENTS............................................................................................... 10 AMPLIFICATION AND DATA ANALYSIS WITH THE USE OF Mx3000P (Stratagene, USA) INSTRUMENT ......................................................................................................... 19 REF R-V59(RG,iQ,Mx,Dt)-CE; VER 09.12.10–03.04.14/ Page 2 of 24 INTENDED USE Guidelines describe the procedure of the use of AmpliSens TBEV, B.burgdorferi sl, A.phagocytophilum, E.chaffeensis / E.muris-FRT PCR kit for qualitative detection of RNA of tick-borne encephalitis virus (TBEV), Borrelia burgdorferi sl (Ixodes tick-borne borreliosis (ITB) pathogen), Ehrlichia chaffeensis and Ehrlichia muris (human monocytic ehrlichiosis (HME) pathogens) and DNA of Anaplasma phagocytophilum (human granulocytic anaplasmosis (HGA) pathogen) in biological materials (ticks, blood, cerebrospinal fluid, and autopsy material) by using real-time hybridization-fluorescence detection with Rotor-Gene 3000 (three and more channels) (Corbett Research, Australia), Rotor-Gene 6000 (five and six channels) (Corbett Research, Australia), Rotor-Gene Q (Qiagen, Germany), iCycler iQ, iQ5 (Bio-Rad, USA), Mx3000P (Stratagene, USA). AMPLIFICATION AND DATA ANALYSIS WITH THE USE OF Rotor-Gene 3000/6000 (Corbett Research, Australia) and Rotor-Gene Q (Qiagen, Germany) INSTRUMENTS Carry out sample pretreatment and reaction mixture preparation stages according to the instruction manual. Transparent flat-cap 0.2-ml PCR tubes and 0.1-ml tubes are recommended for use. Place the tubes in the rotor so that the first tube is in well No. 1, insert the rotor in the reaction module, and secure the lid (the rotor cells are numbered and these numbers are used for the programming sample order). The tubes with PCR-mix-1-FRT TBEV, A.ph., E.ch. / E. m. should be placed into the rotor first if both PCR-mixes-1 are used in the run When working with the Rotor-Gene 3000 instrument, use the Rotor-Gene version 6 software. When working with the Rotor-Gene 6000 instrument, use the Rotor-Gene 6000 versions 1.7 (build 67) software or higher. Hereinafter, all terms corresponding to different instruments and software are indicated in the following order: for Rotor-Gene 3000 / for Rotor-Gene 6000. Programming the Rotor-Gene 3000/6000, Rotor-Gene Q instrument 1. Click the New button in the main program menu. 2. In the opened window, select Advanced and click Dual Labeled Probe/Hydrolysis probes. Activate the New button. 3. Select 36-Well Rotor (or 72-Well Rotor) and No Domed 0.2 ml Tubes/Locking ring attached for Rotor-Gene 6000 instrument. Click Next. REF R-V59(RG,iQ,Mx,Dt)-CE; VER 09.12.10–03.04.14/ Page 3 of 24 4. Reaction volume is 25 µl. Enter an operator. Tick the 15 μl oil layer volume option for Rotor-Gene 6000. Click Next. 5. In the opened window click the Edit profile button and set the temperature profile of the experiment as follows: Table 1 Amplification program for Rotor-Gene 3000/6000 and Rotor-Gene Q Step Temperature, °С Time 1 2 95 95 60 72 95 15 min 10 s 30 s 15 s 10 s 3 56 72 Fluorescent signal detection 30 s Cycles 1 5 FAM/Green, JOE/Yellow, ROX/Orange 40 15 s 6. Click OK. 7. Click the Calibrate/Gain Optimization button in the New Run Wizard window. 8. Follow the steps: perform calibration in the FAM/Green, JOE/Yellow, and ROX/Orange channels (click the Calibrate Acquiring/Optimize Acquiring button); click the Perform Calibration Before 1st Acquisition/Perform Optimization Before 1st Acquisition button; set channel calibration from 5Fl to 10Fl for all channels (the Edit button in the Auto gain calibration channel settings window). Click Close. 9. Click Next. Select the Start run button for amplification to run. 10. Name the experiment and save it to the disk (the results of the run will be automatically saved in this file). 11. Set the data in the table of samples (opens by default when run begins). Define names/numbers of clinical and control samples in the Name column. Enter None for empty wells. Samples indicated as None will not be analyzed. Data analysis The results are interpreted by the Instrument software by the crossing (or not-crossing) of the fluorescence curve with the threshold line and are shown as the presence (or absence) of Ct (cycle threshold) in the results grid. REF R-V59(RG,iQ,Mx,Dt)-CE; VER 09.12.10–03.04.14/ Page 4 of 24 Data analysis of amplification in the FAM/Green channel. 1. Select the Analysis button in the main menu, select the Quantitation mode. Activate the Cycling A FAM/Cycling A Green button. Click Show. 2. Cancel the automatic selection of the Threshold level. 3. The Dynamic tube and Slope Correct buttons should be activated in the Quantitation analysis window. 4. In the CT Calculation menu, set Threshold = 0.03. 5. Activate the More Settings/Outlier Removal button and enter NTC threshold level as 5 (5%) in the text field. 6. Ct value of each sample in the FAM/Green channel will appear in the results grid (Quant. results window). Data analysis of amplification in the JOE/Yellow channel. 1. Select the Analysis sign in the main menu, select the Quantitation mode. Activate the Cycling A JOE/Cycling A Yellow button. Click Show. 2. Cancel the automatic selection of the Threshold level. 3. The Dynamic tube and Slope Correct buttons should be activated in the Quantitation analysis window. 4. In the CT Calculation menu, set Threshold = 0.03. 5. Activate the More Settings/Outlier Removal button and enter NTC threshold level as 5 (5%) in the text field. 6. Ct value of each sample in the JOE/Yellow channel will appear in the results grid (Quant. results window). Data analysis of amplification in the ROX/Orange channel. 1. Select the Analysis sign in the main menu, select the Quantitation mode. Activate the Cycling A ROX/Cycling A Orange button. Click Show. 2. Cancel the automatic selection of the Threshold level. 3. The Dynamic tube and Slope Correct buttons should be activated in the Quantitation analysis window. 4. In the CT Calculation menu, set Threshold = 0.03. 5. Activate the More Settings/Outlier Removal button and enter NTC threshold level as 5 (5%) in the text field. 6. Ct value of each sample in the JOE/Yellow channel will appear in the results grid (Quant. results window). If fluorescence curves do not show exponential growth, set the NTC threshold as 10% REF R-V59(RG,iQ,Mx,Dt)-CE; VER 09.12.10–03.04.14/ Page 5 of 24 Result interpretation of the control samples The result of the analysis is considered reliable only if the results of Positive and Negative Controls of amplification as well as Negative Control of extraction are correct (Table 2). The results of positive and negative controls should not exceed Ct values specified in Table 2. Table 2 Results for controls obtained with Rotor-Gene 3000/6000 and Rotor-Gene Q Control Ct value Stage for control FAM/Green JOE/Yellow ROX/Orange Interpret ation PCR-mix-1-FRT TBEV, A.ph., E.ch. / E.m. Detection of TBEV Detection of A.phagocytophilum Detection of E.chaffeensis / E.muris C– RNA/DNA extraction Absent Absent Absent OK NCA Amplification Absent Absent Absent OK Amplification <27 <27 <27 OK C+TBEV, B.b. sl, A.ph., E.ch. / E.m. / STI PCR-mix-1-FRT B.b. sl / IC Detection of IC Detection of B.burgdorferi sl – C– RNA/DNA extraction <30 Absent – OK NCA Amplification Absent Absent – OK Amplification <27 <27 – OK C+TBEV, B.b. sl, A.ph., E.ch. / E.m. / STI Result interpretation for test samples TBEV cDNA is detected in a sample if its Ct value in the results grid in the FAM/Green channel (with the use of PCR-mix-1-FRT TBEV, A.ph., E.ch. / E.m.) is less than the Ct value specified in Table 3. A.phagocytophilum DNA is detected in a sample if its Ct value in the results grid in the JOE/Yellow/HEX channel (with the use of PCR-mix-1-FRT TBEV, A.ph., E.ch. / E.m.) is less than the Ct value specified in Table 3. E.chaffeensis / E.muris cDNA is detected in a sample if its Ct value in the results grid in the ROX/Orange channel (with the use of PCR-mix-1-FRT TBEV, A.ph., E.ch. / E.m.) is less than the Ct value specified in Table 3. Borrelia burgdorferi sl. cDNA is detected in a sample if its Ct value in the results grid in the JOE/Yellow/HEX channel (with the use of PCR-mix-1-FRT B.b. sl / IC) is less than REF R-V59(RG,iQ,Mx,Dt)-CE; VER 09.12.10–03.04.14/ Page 6 of 24 the Ct value specified in Table 3. Moreover, the fluorescence curve of every studied sample should cross the threshold line at the exponential growth stage. cDNA/DNA of the above-mentioned microorganisms are not detected in a sample if the Ct value in FAM channel (with the use of PCR-mix-1-FRT B.b. sl / IC) is less than the boundary Ct value specified in Table 3, while no Ct value is detected in the channel assigned for the specific pathogen. The result is invalid if the Ct value of a sample is absent in the channels for specific pathogen detection whereas Ct in the FAM/Green channel (with the use of PCR-mix-1FRT B.b. sl / IC) is also absent or greater than the specified boundary Ct value. It is necessary to repeat the PCR test for such samples. Table 3 Results for test samples obtained with Rotor-Gene 3000/6000 and Rotor-Gene Q Signal in channel (Ct) PCR-mix-1-FRT TBEV, A.ph., E.ch. / E.m. FAM/Green HEX/Yellow ROX/Orange Detection of TBEV Detection of A.phagocytophilum Detection of E.chaffeensis / E.muris <38 <38 <38 Detection of IC Detection of B.burgdorferi sl – <35 <38 – B.b. sl / IC Troubleshooting Results of analysis are not taken into account in the following cases: The samples (except for NCA) that show negative result in all channels should be analyzed once again (PCR with detection). If the same result is obtained in the second run, repeat the test starting from the extraction stage. For NCA, the Negative result detected in all channels is accepted as normal. If the Ct value of the Positive Control of amplification (C+TBEV, B.b. sl, A.ph., E.ch. / E.m. / STI) is absent or greater than the specified boundary Ct value in FAM, JOE, or ROX channels (with the use of PCR-mix-1-FRT TBEV, A.ph., E.ch. / E.m.) or in the FAM and JOE channels (with the use of PCR-mix-1-FRT B.b. sl / IC), PCR should be repeated for all samples in which specific cDNA/DNA was not found in the appropriate channel. If the Ct value of the Negative Control of extraction (C-) (in FAM, JOE, ROX channels with PCR-mix-1-FRT TBEV, A.ph., E.ch. / E.m. and in the JOE channel with PCR-mix-1REF R-V59(RG,iQ,Mx,Dt)-CE; VER 09.12.10–03.04.14/ Page 7 of 24 FRT B.b. sl / IC) and/or Negative Control of amplification (NCA) (in any channel) is detected in the results grid, PCR should be repeated for all samples in which specific cDNA/ DNA was found in the appropriate channel. Examples of obtained results FAM channel (amplification of TBEV cDNA for PCR-mix-1-FRT TBEV, A.ph., E.ch. / E.m. and amplificaton of IC cDNA for PCR-mix-1-FRT B.b. sl / IC) 0,8 0,7 Positive Control of TBEV Норм. Флуоресц. 0,6 0,5 0,4 IC 0,3 0,2 0,1 0 Порог 5 10 15 20 Цикл 25 30 35 40 REF R-V59(RG,iQ,Mx,Dt)-CE; VER 09.12.10–03.04.14/ Page 8 of 24 JOE channel (amplification of A.phagocytophilum DNA for PCR-mix-1-FRT TBEV, A.ph., E.ch. / E.m. and amplification of B.burgdorferi sl cDNA for PCR-mix-1-FRT B.b. sl / IC) 1,4 PCR-mix-1-FRT B.burgdorferi sl / IC Норм. Флуоресц. 1,2 1 Positive Control of B.burgdorferi sl 0,8 Positive Control of A.phagocytophillum 0,6 PCR-mix-1-FRT TBEV, Ap, Em / Ech 0,4 0,2 0 Порог 5 10 15 20 Цикл 25 30 35 40 ROX channel (amplification of E.chaffeensis / E.muris cDNA for PCR-mix-1-FRT TBEV, A.ph., E.ch. / E.m.) 1 Норм. Флуоресц. 0,8 0,6 Positive Control of E.chaffeensis / E.muris 0,4 0,2 0 Порог 5 10 15 20 Цикл 25 30 35 40 REF R-V59(RG,iQ,Mx,Dt)-CE; VER 09.12.10–03.04.14/ Page 9 of 24 AMPLIFICATION AND DATA ANALYSIS WITH THE USE OF iCycler iQ and iQ5 (BioRad, USA) INSTRUMENTS 1. Switch on the instrument. The lamp should be warmed up for at least 30 min before the experiment starts. 2. Start the iCycler iQ/iQ5 program. 3. Define the plate setup, that is, a tube order in the reaction chamber and fluorescence signal detection in all tubes in FAM, JOE, and ROX channels if PCR-mix-1-FRT TBEV, A.ph., E.ch. / E. m. is used or in FAM and JOE channels if PCR-mix-1-FRT B.b. sl / IC is used. iCycler iQ 5 instrument. In the Selected Plate Setup window of the Workshop module, press the Create New or Edit button. Edit the plate setup in the Whole Plate loading mode. Set Sample Volume as 25 µl, Seal Type as Domed Cap, and Vessel Type as Tubes. Press Save &Exit Plate Editing. iCycler iQ instrument. Edit the plate setup in the Edit Plate Setup window of the Workshop module. To do this, define the sample order in the Samples: Whole Plate Loading option and enter names of samples in the Sample Identifier window. In the Select and Load Fluorophores option, assign the detection of fluorescence signal in all tubes in FAM, JOE, and ROX channels if PCR-mix-1-FRT TBEV, A.ph., E.ch. / E. m. is used or in FAM and JOE channels if PCR-mix-1-FRT B.b. sl / IC is used. To save the created plate setup, name it in the Plate Setup Filename window (use .pts file extension) and click the Save this plate setup button (at the top of the display). To edit a previously created plate setup, open View Plate Setup in the Library window and select the required plate setup (.pts file) and click the Edit button on the right. Save the edited file. Press the Run with selected protocol button to activate the created plate setup. 4. Set the amplification program (see Table 4). Table 4 Amplification program for iCycler iQ and iQ5 Step Temperature, °С Time 1 95 95 60 72 95 56 72 15 min 10 s 35 s 15 s 10 s 35 s 15 s 2 3 Fluorescent signal detection Cycles 1 5 FAM, HEX, ROX 40 REF R-V59(RG,iQ,Mx,Dt)-CE; VER 09.12.10–03.04.14/ Page 10 of 24 iCycler iQ5 instrument. Click the Create New or Edit button in the Selected Protocol window of the Workshop module. Set the amplification parameters and click the Save&Exit Protocol Editing button to save the protocol. For further runs, a file with this program can be selected from the Protocol unit (all files are saved to the Users folder by default). iCycler iQ instrument. To set the amplification program, select the Edit Protocol option of the Workshop module. Enter the number of cycles, time, and temperature in the bottom window. Specify the signal acquiring in the window at the right as follows: Cycle 3 – Step. To save the protocol, name the file in the Protocol Filename window (use the .tmo file extention) and click the Save this protocol button (at the top of the display). For further runs, a file with this program can be selected from the View Protocol tab of the Library module. Press the Run with selected plate setup button to save and activate the created program. 5. Insert the prepared tubes into the reaction chamber in accordance with the specified tube order. Prior to analysis, remove drops from tube walls, because drops falling during amplification cause signal errors and complicate data analysis. Do not turn strips/plate when placing it into the PCR instrument. iCycler iQ5 instrument. Ensure that the Selected Protocol and Selected Plate Setup are set correctly before starting the program. To start the program, click the Run button. Select the Use Persistent Well Factor option (set by default) for detection of the well factor. Make sure that amplification and calibration are performed with the same type of plastic consumables. Click the Begin Run button, name the experiment (result data will be automatically saved to this file) and click OK. Select Seal Type – Domed cap, and Vessel Type – Tubes. iCycler iQ instrument. Ensure that the selected protocol and plate setup are set correctly in the Run Prep window. For determination of the well factor, select the Persistant Plate option in the Select well factor source line. Set the reaction mix volume as 25 µl in the Sample Volume window. Click the Begin Run button, name the experiment (result data will be automatically saved in this file) and click OK. Proceed to analysis of results after the end of amplification run. Analysis of results The results are interpreted by the Instrument software by the crossing (or not-crossing) of the fluorescence curve with a threshold line and are shown as the presence (or absence) of Ct (threshold cycle) in the results grid. The fluorescence curve for the sample should contain a segment of a typical exponential growth (S-shape) of fluorescence and cross the REF R-V59(RG,iQ,Mx,Dt)-CE; VER 09.12.10–03.04.14/ Page 11 of 24 threshold line once. Data processing iCycler iQ instrument. Activate the View Post-Run window in the Library module. Select the required file in the Data Files window and click the Analyze Data button. Select the desired channel in the PCR Quantification option of the Select a Reporter menu. Make sure that PCR Base Line Subtracted Curve Fit mode is activated (selected by default). In the Threshold Cycle Calculation menu indicate that the threshold is to be set manually and the base line is to be calculated automatically. To do this, select Auto Calculated in the Baseline Cycles submenu and select User Define in the Threshold Position submenu. To set the threshold line it should be move with the cursor while the left mouse button is pushed. When data obtained with PCR-mix-1-FRT TBEV, A.ph., E.ch. / E. m. are processed, disable the wells that were analyzed with PCR-mix-1-FRT B.b. sl / IC in the Display wells menu. When data obtained with PCR-mix-1-FRT B.b. sl / IC are processed, disable the wells that were analyzed with PCR-mix-1-FRT TBEV, A.ph., E.ch. / E. m.in the Display wells menu. Click the Recalculate Threshold Cycles button. Ct values will appear in the results grid. iQ5 instrument. Select the required result data file (Data File window of the Workshop module) and click the Analyze button. Select data obtained in the required channel in the window of the module. Make sure that the PCR Base Line Subtracted Curve Fit mode is activated (selected by default). Analysis of amplification results obtained with PCR-mix-1-FRT TBEV, A.ph., E.ch. / E. m: TBEV cDNA 1. Click the FAM button in the Data Analysis menu. 2. Select the Baseline Threshold option using the right mouse button on the plot of the fluorescence curves. 3. Set following parameters: select User Defined, Select all, and Edit Range in the Base Line Cycles menu and set Start Cycle=2, Ending Cycle=25; select User Defined in the Crossing Threshold menu and set Threshold Position=200. Click OK. 4. Ct values will appear in the results grid (Results window). A.phagocytophilum DNA 1. Click the JOE button in the Data Analysis menu. 2. Select the Baseline Threshold option using the right mouse button on the plot of the REF R-V59(RG,iQ,Mx,Dt)-CE; VER 09.12.10–03.04.14/ Page 12 of 24 fluorescence curves. 3. Set following parameters: select User Defined, Select all, and Edit Range in the Base Line Cycles menu and set Start Cycle=2, Ending Cycle=25; select User Defined in the Crossing Threshold menu and set Threshold Position=100. Click OK. 4. Ct values will appear in the results grid (Results window). E.muris, E.chaffensis cDNA 1. Click the ROX button in the Data Analysis menu. 2. Select the Baseline Threshold option using the right mouse button on the plot of the fluorescence curves. 3. Set following parameters: select User Defined, Select all, and Edit Range in the Base Line Cycles menu and set Start Cycle=2, Ending Cycle=25; select User Defined in the Crossing Threshold menu and set Threshold Position=100. Click OK. 4. Ct values will appear in the results grid (Results window). Analysis of amplification results obtained with PCR-mix-1-FRT B.b. sl / IC: Internal Control 1. Click the FAM button in the Data Analysis menu. 2. Select the Baseline Threshold option using the right mouse button on the plot of the fluorescence curves. 3. Set following parameters: select User Defined, Select all, and Edit Range in the Base Line Cycles menu and set Start Cycle=2, Ending Cycle=25; select User Defined in the Crossing Threshold menu and set Threshold Position=50. Click OK. 4. Ct values will appear in the results grid (Results window). B.burgdorferi sl DNA 1. Click the JOE button in the Data Analysis menu. 2. Select the Baseline Threshold option using the right mouse button on the plot of the fluorescence curves. 3. Set following parameters: select User Defined, Select all, and Edit Range in the Base Line Cycles menu and set Start Cycle=2, Ending Cycle=25; select User Defined in the Crossing Threshold menu and set Threshold Position=100. Click OK. 4. Ct values will appear in the result grid (Results window). Result interpretation of the control samples The result of the analysis is considered reliable only if the results of both Positive and Negative Controls of amplification as well as Negative Control of extraction are correct REF R-V59(RG,iQ,Mx,Dt)-CE; VER 09.12.10–03.04.14/ Page 13 of 24 (Table 5). Results of positive and negative controls should not exceed Ct values specified Table 5). Table 5 Results for controls obtained with iCycler iQ and iQ5 Control Ct value Stage for control FAM HEX ROX Interpret ation PCR-mix-1-FRT TBEV, A.ph., E.ch. / E.m. Detection of TBEV Detection of A.phagocytophilum Detection of E.chaffeensis / E.muris C– RNA/DNA extraction Absent Absent Absent OK NCA Amplification Absent Absent Absent OK Amplification <30 <31 <30 OK C+TBEV, B.b. sl, A.ph., E.ch. / E.m. / STI PCR-mix-1-FRT B.b. sl / IC Detection of IC Detection of B.burgdorferi sl – C– RNA/DNA extraction <33 Absent – OK NCA Amplification Absent Absent – OK Amplification <30 <30 – OK C+TBEV, B.b. sl, A.ph., E.ch. / E.m. / STI Result interpretation of test samples TBEV cDNA is detected in a sample if its Ct value in the results grid in the FAM channel (with the use of PCR-mix-1-FRT TBEV, A.ph., E.ch. / E.m.) is less than the Ct value specified in Table 6. A.phagocytophilum DNA is detected in a sample if its Ct value in the results grid in the HEX channel (with the use of PCR-mix-1-FRT TBEV, A.ph., E.ch. / E.m.) is less than the Ct value specified in Table 6. E.chaffeensis / E.muris cDNA is detected in a sample if its Ct value in the results grid in the ROX channel (with the use of PCR-mix-1-FRT TBEV, A.ph., E.ch. / E.m.) is less than the Ct value specified in Table 6. Borrelia burgdorferi sl. cDNA is detected in a sample if its Ct value in the results grid in the JOE/Yellow/HEX channel (with the use of PCR-mix-1-FRT B.b. sl / IC) is less than the Ct value specified in Table 6. Moreover, the fluorescence curve of each studied sample should cross the threshold line at the exponential growth stage. REF R-V59(RG,iQ,Mx,Dt)-CE; VER 09.12.10–03.04.14/ Page 14 of 24 cDNA/DNA of the above-mentioned microorganisms are not detected in a sample if the Ct value detected in FAM channel (with the use of PCR-mix-1-FRT B.b. sl / IC) is less than boundary Ct value specified in Table 6, while no Ct value is detected in the channel assigned for the specific pathogen. The result is invalid if Ct of a sample is absent in the channels for specific pathogen detection whereas in the FAM channel (with the use of PCR-mix-1-FRT B.b. sl / IC) Ct is also absent or greater than the specified boundary Ct value. Repeat the PCR test for such samples. Table 6 Results for test samples obtained with iCycler iQ and iQ5 Signal in channel (Ct) PCR-mix-1-FRT TBEV, A.ph., E.ch. / E.m. FAM HEX ROX Detection of TBEV Detection of A.phagocytophilum Detection of E.chaffeensis / E.muris <39 <39 <39 Detection of IC Detection of B.burgdorferi sl – <38 <39 – B.b. sl / IC Troubleshooting Results of analysis are not taken into account in the following cases: The samples (except for NCA) that show negative result in all channels should be analyzed once again (PCR with detection). If the same result is obtained in the second run, repeat the test starting from the extraction stage. For NCA, the Negative result detected in all channels is accepted as normal. If the Ct value of the Positive Control of amplification (C+TBEV, B.b. sl, A.ph., E.ch. / E.m. / STI) is absent or greater than the specified boundary Ct value in FAM, JOE, or ROX channels (with the use of PCR-mix-1-FRT TBEV, A.ph., E.ch. / E.m.) or in the FAM and JOE channels (with the use of PCR-mix-1-FRT B.b. sl / IC), PCR should be repeated for all samples in which specific cDNA/DNA was not found in the appropriate channel. If the Ct value of the Negative Control of extraction (C-) (in the FAM, JOE, ROX channels with PCR-mix-1-FRT TBEV, A.ph., E.ch. / E.m. and in the JOE channel with PCR-mix1-FRT B.b. sl / IC) and/or Negative Control of amplification (NCA) (in any channel) is detected in the results grid, PCR should be repeated for all samples in which specific cDNA/ DNA was found in the appropriate channel. REF R-V59(RG,iQ,Mx,Dt)-CE; VER 09.12.10–03.04.14/ Page 15 of 24 Examples of obtained results FAM channel (amplification of TBEV cDNA for PCR-mix-1-FRT TBEV, A.ph., E.ch. / E.m. and amplificaton of IC cDNA for PCR-mix-1-FRT B.b. sl / IC) IC Positive Control of TBEV REF R-V59(RG,iQ,Mx,Dt)-CE; VER 09.12.10–03.04.14/ Page 16 of 24 JOE channel (amplification of A.phagocytophilum DNA for PCR-mix-1-FRT TBEV, A.ph., E.ch. / E.m. and amplification of B.burgdorferi sl cDNA for PCR-mix-1-FRT B.b. sl / IC) Positive Control of A.phagocytophilum Positive Control of B.burgdorferi sl REF R-V59(RG,iQ,Mx,Dt)-CE; VER 09.12.10–03.04.14/ Page 17 of 24 ROX channel (amplification of E.chaffeensis / E.muris cDNA for PCR-mix-1-FRT TBEV, A.ph., E.ch. / E.m.) Positive Control of E.chaffeensis / E.muris REF R-V59(RG,iQ,Mx,Dt)-CE; VER 09.12.10–03.04.14/ Page 18 of 24 AMPLIFICATION AND DATA ANALYSIS WITH THE USE OF Mx3000P (Stratagene, USA) INSTRUMENT Carry out sample pretreatment and reaction mixture preparation stages according to the instruction manual. Program the instrument according to the user manual provided by the manufacturer. 1. Switch on the instrument. Start the Stratagene Mx3000P program. 2. Select Quantitative PCR (Multiple Standards) and check Turn lamp on for warm-up in the New Experiment Options window. The lamp should be warmed up for at least 15 min before the experiment starts. 3. Place experimental tubes into the module and lock it. 4. Select Optics Configuration in the Options menu. In the Dye Assignment window, set FAM next to the FAM filter set line, JOE next to the HEX/JOE filter set line, and ROX next to the ROX filter set line. 5. Set fluorescence detection parameters in the Plate Setup menu. To do this, select all cells with PCR-mix-1-FRT TBEV, A.ph., E.ch. / E. m. test tubes and define them as Unknown in the Well type drop-down window. Select FAM, JOE, and ROX fluorophores in the Collect fluorescence data option. Then, select all cells with PCR-mix-1-FRT B.b. sl / IC test tubes and define them as Unknown in the Well type drop-down window. Select FAM and JOE fluorophores in the Collect fluorescence data option. 6. Enter the names of the test samples in the Well Information window. 7. In the Plate Setup menu, select all cells with the test tubes and select Unknown in the Well type drop-down window. Activate FAM, JOE, and ROX fluorophores in the Collect fluorescence data option. 8. Set the amplification program (see the table below) in Thermal Profile Setup. Table 7 Amplification program for Mx3000P instrument Step Temperature, °С Time 1 95 95 60 72 95 56 72 15 min 10 s 35 s 15 s 10 s 35 s 15 s 2 3 Fluorescent signal detection Cycles 1 5 FAM, JOE, ROX 40 REF R-V59(RG,iQ,Mx,Dt)-CE; VER 09.12.10–03.04.14/ Page 19 of 24 9. Select Run in the menu. Ensure that amplification program is correct. Click Start. Tick the Turn lamp off at end of run box. Save the experiment. Analysis of results Data processing 1. Open the saved data file and shift to Analysis mode. 2. Activate the Results window in the menu. 3. Select the Amplification plots line in the Area to analyze unit. 4. In the Threshold fluorescence unit set the threshold line at a level where fluorescence curves are linear. It is recommended to set the threshold level equal to 500 for all channels. Normally, the threshold line should cross only sigmoid curves of positive samples and controls and should not cross the base line. Otherwise, raise the threshold. 5. Select the Text report line in the Area to analyze unit. Result interpretation for control samples The result of the analysis is considered reliable only if the results of both Positive and Negative Controls of amplification as well as Negative Control of extraction are correct (Table 8). Results of positive and negative controls should not exceed Ct values specified in Table 8) Table 8 Results for controls obtained with Mx3000P Control Stage for control Ct value FAM JOE ROX Interpret ation PCR-mix-1-FRT TBEV, A.ph., E.ch. / E.m. Detection of TBEV Detection of A.phagocytophilum Detection of E.chaffeensis / E.muris C– RNA/DNA extraction Absent Absent Absent OK NCA Amplification Absent Absent Absent OK Amplification <30 <31 <30 OK C+TBEV, B.b. sl, A.ph., E.ch. / E.m. / STI PCR-mix-1-FRT B.b. sl / IC Detection of IC Detection of B.burgdorferi sl – C– RNA/DNA extraction <34 Absent – OK NCA Amplification Absent Absent – OK Amplification <30 <30 – OK C+TBEV, B.b. sl, A.ph., E.ch. / E.m. / STI REF R-V59(RG,iQ,Mx,Dt)-CE; VER 09.12.10–03.04.14/ Page 20 of 24 Result interpretation for test samples TBEV cDNA is detected in a sample if its Ct value in the results grid in the FAM channel (with the use of PCR-mix-1-FRT TBEV, A.ph., E.ch. / E.m.) is less than the Ct value specified in Table 9. A.phagocytophilum DNA is detected in a sample if its Ct value in the results grid in the JOE channel (with the use of PCR-mix-1-FRT TBEV, A.ph., E.ch. / E.m.) is less than the Ct value specified in Table 9. E.chaffeensis / E.muris cDNA is detected in a sample if its Ct value in the results grid in the ROX channel (with the use of PCR-mix-1-FRT TBEV, A.ph., E.ch. / E.m.) is less than the Ct value specified in Table 9. Borrelia burgdorferi sl. cDNA is detected in a sample if its Ct value in the result grid in the JOE channel (with the use of PCR-mix-1-FRT B.b. sl / IC) is less than the Ct value specified in Table 9. Moreover, the fluorescence curve of each studied sample should cross the threshold line at the exponential growth stage. cDNA/DNA of the above-mentioned microorganisms are not detected in a sample if the Ct value detected in the FAM channel (with the use of PCR-mix-1-FRT B.b. sl / IC) is less than boundary Ct value specified in Table 9, while no Ct value is detected in the channel assigned for the specific pathogen. The result is invalid if Ct of a sample is absent in the channels for specific pathogen detection whereas in the FAM channel (with the use of PCR-mix-1-FRT B.b. sl / IC) Ct is also absent or greater than the specified boundary Ct value. Repeat the PCR test for such samples. Table 9 Results for test samples obtained with Mx3000P Signal in channel (Ct) PCR-mix-1-FRT TBEV, A.ph., E.ch. / E.m. FAM HEX ROX Detection of TBEV Detection of A.phagocytophilum Detection of E.chaffeensis / E.muris <39 <39 <39 Detection of IC Detection of B.burgdorferi sl – <38 <39 – B.b. sl / IC REF R-V59(RG,iQ,Mx,Dt)-CE; VER 09.12.10–03.04.14/ Page 21 of 24 Troubleshooting Results of analysis are not taken into account in the following cases: The samples (except for NCA) that show negative result in all channels should be analyzed once again (PCR with detection). If the same result is obtained in the second run, repeat the test starting from the extraction stage. For NCA, the negative result detected in all channels is accepted as normal. If the Ct value of the Positive Control of amplification (C+TBEV, B.b. sl, A.ph., E.ch. / E.m. / STI) is absent or greater than the specified boundary Ct value in FAM, JOE, or ROX channels (with the use of PCR-mix-1-FRT TBEV, A.ph., E.ch. / E.m.) or in FAM and JOE channels (with the use of PCR-mix-1-FRT B.b. sl / IC), PCR should be repeated for all samples in which specific cDNA/DNA was not found in the appropriate channel. If the Ct value of the Negative Control of extraction (C-) (in FAM, JOE, ROX channels with PCR-mix-1-FRT TBEV, A.ph., E.ch. / E.m. and in the JOE channel with PCR-mix-1FRT B.b. sl / IC) and/or Negative Control of amplification (NCA) (in any channel) is detected in the results grid, PCR should be repeated for all samples in which specific cDNA/ DNA was found in the appropriate channel. Examples of obtained results FAM channel (amplification of TBEV cDNA for PCR-mix-1-FRT TBEV, A.ph., E.ch. / E.m. and amplificaton of IC cDNA for PCR-mix-1-FRT B.b. sl / IC) Positive Control of TBEV IC REF R-V59(RG,iQ,Mx,Dt)-CE; VER 09.12.10–03.04.14/ Page 22 of 24 JOE channel (amplification of A.phagocytophilum DNA for PCR-mix-1-FRT TBEV, A.ph., E.ch. / E.m. and amplification of B.burgdorferi sl cDNA for PCR-mix-1-FRT B.b. sl / IC) Positive Control of B.burgdorferi sl Positive Control of A.phagocytophillum ROX channel (amplification of E.chaffeensis / E.muris cDNA for PCR-mix-1-FRT TBEV, A.ph., E.ch. / E.m.) Positive Control of E.chaffeensis / E.muris REF R-V59(RG,iQ,Mx,Dt)-CE; VER 09.12.10–03.04.14/ Page 23 of 24 List of Changes Made in the Guidelines VER Location of changes 29.06.11 LA Cover page The name of Institute was changed to Federal Budget Institute of Science “Central Research Institute for Epidemiology” 03.04.14 SA Cover page Address of European representative was added Essence of changes REF R-V59(RG,iQ,Mx,Dt)-CE; VER 09.12.10–03.04.14/ Page 24 of 24