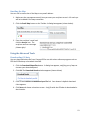
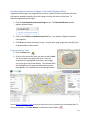
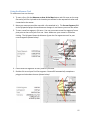
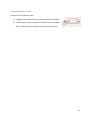
1
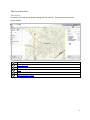
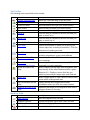
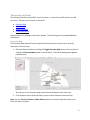
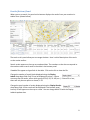
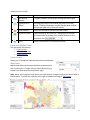
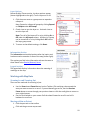
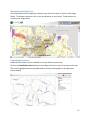
ConnectGIS User’s Manual Mobile311, LLC 2501 Jefferson Davis Hwy Sanford, NC 27332 (Main) 919.238.0444 (Fax) 888.492.4172 (Sales) [email protected] (Support) [email protected] Table of Contents Introduction .................................................................................................................................... 3 Application Versions and Requirements ........................................................................................ 3 About this Guide ............................................................................................................................. 3 Key Terms........................................................................................................................................ 3 The User Interface........................................................................................................................... 4 The Layout................................................................................................................................... 4 The Toolbar ................................................................................................................................. 5 Mark Up Tools ............................................................................................................................. 5 The Search (Left) Panel ............................................................................................................... 6 Overview Map ......................................................................................................................... 6 Quick search ............................................................................................................................ 7 Advanced Search..................................................................................................................... 7 Coordinate Search................................................................................................................... 7 Results (Bottom) Panel ............................................................................................................... 8 Layer Info (Right) Panel ............................................................................................................... 9 Layers Section ......................................................................................................................... 9 Information Section .............................................................................................................. 10 Legend section ...................................................................................................................... 10 Working with Map Data ................................................................................................................ 10 Zooming In and Zooming Out ................................................................................................... 10 Moving within an Extent ........................................................................................................... 10 Maximizing the Map View ........................................................................................................ 11 Identifying Base Data ................................................................................................................ 11 Using the Mark Up Tools........................................................................................................... 12 Printing the Map ....................................................................................................................... 12 Emailing the Map ...................................................................................................................... 13 Using the Advanced Tools ............................................................................................................. 13 Downloading GIS data............................................................................................................... 13 Downloading Georeferenced Image of Currently Displayed Data ........................................... 14 Using the Select Tool ................................................................................................................ 14 Using the Measure Tool ............................................................................................................ 15 Using the Zoom to Scale ........................................................................................................... 16 2 Introduction ConnectGIS is a web mapping interface and hosting service utilizing ESRI ArcGIS Server. It is intuitive for the non-GIS user, but provides powerful capabilities for GIS professionals. The interface is fully functional using just a web browser, without the need for the user to download any applications or plugins. Application Versions and Requirements ConnectGIS requires the following: An internet connection A web browser - Internet Explorer 7.0 or Mozilla Firefox 2.0 or higher, Chrome or Safari are recommended About this Guide In this guide, numbered steps represent actions you take to interact with ConnectGIS. Items in italics represent the expected response from ConnectGIS. Within this guide, items in blue, underlined text represent hyperlinks. In most cases, these links take you to other sections within this guide that provide additional information about a topic. Links to external websites are indicated with an HTML address. Key Terms Before reviewing this guide, you may find it helpful to understand a few key terms: Coordinates - A set of numbers used in specifying the location of a point on a line, on a surface, or in space. Extent - A view of map. An extent includes not only the geography centered on the screen, but also the level of magnification (zoom). Layer - A set of data applied to a map. Layers can be turned on or off and multiple layers can be applied to a map at once. 3 The User Interface The Layout At startup, the initial extent appears along with the controls. There are six main sections (shown below). 1 2 3 4 5 6 Toolbar Mark Up Tools Search (Left) Panel Map Layer/Info (Right) Panel Results (Bottom) Panel 4 The Toolbar The following tools are available on the toolbar: Icon Name Toggle Overview Map Initial Extent Previous Extent Next Extent Pan Zoom In Zoom Out Identify Base Data Print Map Email Map Download Shapefiles Download Georeferenced Image Buffer an Area of the Map Select tool Get Coordinates on the Map Measure an Area of the Map Description Reveal the Overview Map in the left panel. Return the map view to its default extent. Move backwards through your extent history. Move forward through your extent history. Move around the map without zooming in or out. Click and drag to create box around the area you want to zoom in to. Click and drag to create box around the area you want to zoom out of. Click to query information from the database. Open a new window to allow you to print your current map view, including annotations. Click the down arrow to select print size. Send a screenshot of your current map view, including annotations, to any email address. Create a zip file of the GIS data and download it to your computer. Create a zip file of screenshot and world file and download it to your computer. Select a feature on the map, such as a parcel, and then identify all the other features within a given distance of it. Displays a menu that lets you search by source layer, target layer, and distance. Select a single point or uses a lasso to select many points within a designated area. Display latitude and longitude and other coordinates when you click on a map location. Measures the length of line segments and area of polygons drawn on the map. Mark Up Tools Icon Name Add Graphics Description Draw line segments on the map Graphics Options Change the graphic type, style, color, and size Edit Graphics Edit an existing graphic Clear All Graphics Erase all added text and lines 5 The Search (Left) Panel The left panel contains ConnectGIS’s search functions. In most ConnectGIS sessions you will start here. There are four sections in this panel: Overview Map Quick Search Advanced Search Coordinate Search Expand a section by clicking on the section header. The following sections provide additional information. Overview Map The Overview Map shows the entire map and indicates what part of the map is currently displayed in the main map. 1. Show the Overview Map by clicking the Toggle Overview Map button on the tool bar or clicking the Overview Map header in the left panel. The Overview Map panel appears (shown below). The red box on the Overview Map shows the area displayed in the main map. 2. Click anywhere on the Overview Map to jump to that location on the main map. Note: Use the Previous Extent and Next Extent buttons to move forward and ward in your history of zooms and pans. 6 Quick search 1. If the Quick Search section isn’t already open, click on the header in the left hand column labeled “Quick Search”. The Quick Search panel appears (shown right). 2. Enter your search term into the appropriate field and click the search button next to the search field or hit enter on your keyboard. 3. The map will automatically zoom to the closest extent that allows you to see all of your results. 4. Tip: If you are unsure of the format your search term should be in, a pop-up will tell you when you click in the empty field (shown below). Advanced Search Advanced Search works the same way Quick Search does, but it adds extra fields and parameters to allow you to refine your search more (shown right). Note: Search terms will vary depending on your map theme. Coordinate Search The Coordinate Search lets you locate a point on the map by entering coordinates (shown right). 1. Select the type of map you want to use: Google or Bing. 2. Enter Lat/Lon, Local, or US National Grid coordinates. 3. Click the search button next to the coordinates you entered. The map zooms to the entered location. 7 Results (Bottom) Panel When you run a search, the panel at the bottom displays the results from your searches in tabular form (shown below). The tools on this panel allow you to manage the data. Here is a brief description of the tools on the results toolbar: Search results appear on the map as numbered dots. The numbers on the dots correspond to the numbers next to each result in the table in the bottom panel. Viewable files appear as hyperlinks in the table. Click on the link to view the file. Change the number of result labels displayed using the Display Labels drop-down field. Only 50 can be displayed at a time. If there are more than 50 results, select which group of 50 (1-50, 51-100, etc.). If there 50 or less, there will only be one option to choose, 1-50. Change the total number of results displayed using the Display Results drop-down field. All the results will be displayed in the bottom panel, but only 50 will appear on the map at a time. You can change which 50 with the Display Labels dropdown box. 8 Additional tools include: Icon Name Show/Hide Results Highlight and Zoom Clear Results Export to Excel Print Description Toggles between showing and hiding the results grid. Clicking the button in the table will zoom in to that result. Clicking the button on the Results table toolbar zooms the map out to show all results. Clears all the search results from the screen. Export results to an Excel file. Change the file format you download by picking from several formats in the dropdown list. Prints a screenshot of the selected result. Layer Info (Right) Panel The right panel has sections: • Layers Section • Information Section • Legend Section Layers Section Allows you to change the map and map elements displayed. Map Theme Map themes allow you to switch between predetermined sets of map layers. Change the map theme by selecting a theme from the drop-down box (shown right). Note: When you change the map theme, the layer options change as well as the search fields in the left panel. Consider the example to the right compared the image in The Layout: 9 Layer Options Below the Map Theme section, the layer options appear (shown highlighted to the right). To turn layers on or off: 1. Click the arrow next to a group name to expand or collapse it. Note: Expand or collapse all groups by clicking Expand or Collapse under All Groups. 2. Check a box to turn the layer on. Uncheck a box to turn the layer off. Note: Turn all of the layers off or on by clicking On or Off under the All Layers column. All layers in a group can be turned off or on by clicking On or Off next to the layer group name. 3. To return to the default settings, click Reset. Information Section The Information section displays data after the inquiry tool has been used to examine an area of the map (shown right). The options you find in the information tab are the same as those found in the Results (Bottom) Panel. Legend section The legend tab displays information about the meaning of markings on the map. Working with Map Data Zooming In and Zooming Out There are two methods for zooming in/out: Use the Zoom In and Zoom Out tool on the Toolbar. Click and drag a box around the area you want to zoom in or out of. If you accidentally go too far, use the Previous Extent button to move through your previous views or click the small globe to return to your original extent. Use the scroll wheel on your mouse. Roll the wheel forward to scroll in and roll it backward to scroll out. Moving within an Extent 1. Click the pan tool on the toolbar. 2. Click and drag to move map around. 10 Maximizing the Map View All of the panels can be collapsed to maximize your view of the map, as shown in the image below. To collapse each panel, click on the arrow button on each panel. These buttons are circled on the image below. Identifying Base Data Additional information may be available for various features on the map. Click on the Identify Base Data button on the toolbar and click on area of interest on the map. The area is highlighted and any available data for that area is displayed in the right panel (shown below). 11 Using the Mark Up Tools Using the mark up tools, you can add custom points, lines, polygons, rectangles, circles, and text to the map. To mark up a map: 1. Click the Graphics Option button on the toolbar. A menu appears (shown right). 2. Using the radio buttons, select the type of object you want to add. As you select an item, the options below the radio buttons change. For example, for a point, you can select the point symbol, but for a line, you can select the line style, width, and color. 3. Select the desired options for the selected mark up item. 4. Click the Accept (green check) button. The menu closes. 5. Click the Add Graphics button on the toolbar. A pop up window appears attached to your mouse, with instructions for the selected Mark Up item (shown right). 6. Follow the on-screen instructions to add your mark up. 7. Click another toolbar button to turn off the mark up tools. Printing the Map 1. Click the drop-down menu next to the Print button on the toolbar and select the desired print size (shown right). 2. Click the Print button next to the result. The Download Results window appears (shown below). 3. Click on the Click here to download your file link. A new window appears with the printable map and (if applicable) table of item data. The screen shot includes a large view of the result with an overview map in the top left corner (shown right). Any layers that are turned on will show up. The data from the layers is also included underneath the screenshot. 4. Use your browser's print dialogue to print your search result. 12 Emailing the Map You can mail a screen shot of the Map to any email address: 1. Make sure the map appears exactly how you want your recipient to see it. All mark ups will be included in the map screenshot. 2. Click the Email Map button on the Toolbar. A dialog box appears (shown below). 3. Enter the recipient’s email and click the Accept icon. The recipient receives a message (shown right). Using the Advanced Tools Downloading GIS data You can download a data file from ConnectGIS for use with other software programs such as ESRI ArcGIS Desktop or Autodesk AutoCAD. 1. Click the Download Shapefiles button. A dialog box appears, notifying you of ways to increase your download speed. 2. Click OK. The Download Results window appears (shown below). 3. Click on the Click here to download your file link. Your browser’s default download client appears. 4. Click Save and choose a location to save. A zip file with the GIS data is downloaded to that location. 13 Downloading Georeferenced Image of Currently Displayed Data A georeferenced image is an image file that contains a world-file with coordinates and other information needed to spatially place that image correctly with other similar data. To download a georeferenced image: 1. Click the Download Georeferenced Image button. The Download Results window appears (shown below). 2. Click on the Click here to download your file link. Your browser’s default download client appears. 3. Click Save and choose a location to save. A zip file with .jpeg image and a world file will be downloaded to that location. Using the Select Tool 1. Click the Select tool. 2. Draw a circle around the area you want to select. Note: You do not have to complete the circle. Once the selected area is highlighted (as shown in the image), you can let go of the mouse button. The selected items are highlighted on the map and information for each item appears in a numbered list in the data grid below. See the Results (Bottom) Panel section to see actions you can perform on the selected data. To clear your selection, click Clear Results in the Results Panel Toolbar. 14 Using the Measure Tool To measure an item on the map: 1. To start a line, click the Measure an Area of the Map button and click once on the map. One end of red line is pinned to the location you selected on the map and the other end is attached to the mouse. 2. Move your mouse around the map with a line attached to it. The Current Segment field in the left panel displays the measurement changes in real time as you move the mouse. 3. To start a new line segment, click once. You can now create a new line segment from a pivot point at the end of your first one. Note: Make sure your mouse is still before clicking. The left panel shows the distance of your last line segment as well as your current segment (shown below). 4. Create new line segments as many times as you need. 5. Double-click to end your final line segment. ConnectGIS automatically completes a polygon and calculates the area (shown below). 15 Using the Zoom to Scale The Zoom to Scale has two uses: It displays the current scale, no matter how you arrived there. It allows you to zoom to a specific scale by entering a number. Note: The smaller the number, the closer you will zoom in. 16