1
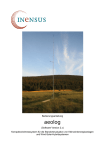
User Manual aeolog compact wind monitoring system for site evaluation of small wind turbines and wind-solar hybrid systems User manual aeolog V3.x © INENSUS GmbH, 19.09.2011 ! Please read this manual completely before operating the data logger or installing the wind mast. Non-observance may cause injuries! ! The technical features described in this manual are subject to change without notice. 0 Content 0 Content ........................................................................................................... 3 1 Survey of standard systems available .............................................................. 6 2 1.1 aeolog advanced 15 ...................................................................................... 6 1.2 aeolog pro 10................................................................................................. 6 1.3 aeolog advanced ........................................................................................... 6 Survey of data logger functions ....................................................................... 7 2.1 3 4 Recording of measured data ......................................................................... 7 Commissioning of the data logger ................................................................... 9 3.1 Activation of data logger ............................................................................... 9 3.2 Handling of the data-logger ........................................................................ 10 3.3 Display auto power off ................................................................................ 10 3.4 Setting of time and date .............................................................................. 11 3.5 Connection of sensors .................................................................................. 11 Display .......................................................................................................... 12 4.1 Survey of currently measured values ........................................................... 12 4.2 Display of wind speed .................................................................................. 12 4.2.1 Maximum wind speed .......................................................................... 13 4.2.2 Turbulence intensity............................................................................. 13 4.2.3 Standard deviation ............................................................................... 13 4.2.4 Distribution of wind speeds according to wind classes ........................ 13 4.3 Display of current wind direction ................................................................. 14 4.3.1 Distribution of wind speeds according to wind directions and time distribution of wind directions ........................................................................... 14 4.4 Display of ambient temperature ................................................................. 15 4.5 Display of solar irradiation .......................................................................... 15 4.6 Changing of settings after input of password ............................................. 15 4.6.1 Copy time series to an SD-card ............................................................ 17 4.6.2 Clear internal storage .......................................................................... 18 4.6.3 Choose language .................................................................................. 18 4.6.4 Choose interval length ......................................................................... 18 4.6.5 Configure second anemometer ........................................................... 19 4.6.6 Configure solar irradiation sensor ....................................................... 19 4.6.7 Configure auto power off time / display timeout ................................ 19 4.6.8 Enter site name .................................................................................... 20 4.7 Display of available data and battery storage ............................................ 20 4.7.1 Time within the current measurement interval .................................. 20 4.7.2 Record number and duration of measurement ................................... 21 4.7.3 Software- and Hardwareversion ......................................................... 21 4.7.4 Serial number ....................................................................................... 21 4.7.5 Internal memory address ..................................................................... 21 4.7.6 SD-storage card entered? .................................................................... 21 4.8 5 Display during periods of low battery state of charge ................................ 22 Preparation of wind mast set up ....................................................................23 5.1 Choosing a wind site ................................................................................... 23 5.2 Base plate & ground anchors ...................................................................... 23 5.3 Preparation of the mast for erection .......................................................... 25 5.3.1 Mounting of the bottom anemometer boom (with 15 m mast) ......... 26 5.3.2 Mounting of the bottom anemometer (if applicable) ......................... 27 5.3.3 Mounting the top anemometer or the combined wind sensor ........... 28 5.3.4 Mounting of the data logger ................................................................ 28 5.3.5 Fixing of the cables to the mast ........................................................... 29 6 Commissioning and handling of the data logger.............................................30 6.1 Alignment of the wind vane ........................................................................ 30 6.2 Connection of external sensors (premounted delivery) ............................... 30 6.3 Power supply and battery charging using a USB socket ............................. 31 6.4 Closing the data logger casing .................................................................... 31 6.5 Setting the clock .......................................................................................... 31 4/45 User Manual aeolog V3.x 6.6 7 8 Test of function ............................................................................................ 32 Erecting the mast .......................................................................................... 33 7.1 Documentation of the setup procedure ....................................................... 37 7.2 Transferring the data from the data logger to a computer for evaluation . 37 7.3 Evaluation of measured data ...................................................................... 38 Appendix ....................................................................................................... 39 8.1 Technical data ............................................................................................. 39 8.2 Permissible operation conditions................................................................. 40 8.3 EG-conformity declaration .......................................................................... 41 8.4 Disposal of the data logger ......................................................................... 42 8.5 Troubleshooting........................................................................................... 42 8.5.1 The display stays empty ....................................................................... 42 8.5.2 The display does not show any values although the sensors move ..... 43 8.5.3 There is water in the data-logger casing .............................................. 43 8.6 Contact ........................................................................................................ 43 8.7 Documentation of the set up procedure ...................................................... 43 8.7.1 Commissioning protocol # .................................................................... 45 © INENSUS GmbH, 19.09.2011 5/45 1 Survey of standard systems available We offer the following standard system configurations: 1.1 aeolog advanced 15 Complete wind monitoring system including 15 m mast, data logger and sensors for two measuring heights in a reusable transport box. Wind data from two measuring heights provides useful information about shading effects of surrounding obstacles and in flat terrain about the increase of wind speed with height above ground. 1.2 aeolog pro 10 Complete wind monitoring system including 10 m mast, data logger and sensors for one measuring height in a reusable transport box. The transport box is just 1.5 m long and can be shipped easily. The measurement in just one height above ground (up to 10 m) does not provide any information about the change of wind speeds with height. However, this is no disadvantage as long as the wind turbine has got a hub height which is the same as the measuring height. In terrain without any obstacles the extrapolation to other heights can be realized using estimated roughness lengths of the groud. 1.3 aeolog advanced Data logger with two sensors to measure at two different heights without mast. On demand the sensor cables can be prepared for installation of up to 30 m above ground. 6/45 User Manual aeolog V3.x 2 Survey of data logger functions The aeolog data logger was developed for the small wind power sector incorporating all functions required for cost effective wind and solar monitoring, site assessment and energy yield evaluation in a single device. Before installing a wind turbine it is important to investigate the wind regime at the desired site. This is how the energy yield of a small wind turbine and its power distribution over time can be assessed for specific sites. Stand-alone power systems based on wind and solar energy with battery storage are very sensitive especially regarding the availability of power over time. In these systems a strong negative correlation of wind and solar power can be valuable. To facilitate small wind and hybrid system design, aeolog records time series data which can be used in simulation software programs. 2.1 Recording of measured data The wind speed is measured every 10 seconds in averaging periods of 1 min and above and every 5 seconds in averaging periods of below 1 min. From this data the data logger derives average values of 10 sec, 1 min, 10 min or 15 min according to the setting of the logger and saves these as a time series. The maximum and minimum value of the respective averaging period as well as the standard deviation will be stored with each average value. Alternatively, a setting can be chosen measured value every 5 sec directly. which stores the Wind direction, temperature and solar irradiation (if applicable) are measured using the same intervals as the wind speed mentioned above. The respective values will be shown on aeolog displayed. The last value of each averaging period will be recorded. © INENSUS GmbH, 19.09.2011 7/45 All data recorded can be transferred to an SD storage card using the respective function of the aeolog menu (refer to chapter 7.2). 8/45 User Manual aeolog V3.x 3 Commissioning of the data logger The aeolog data logger is already pre-configured for the sensors delivered and only a few inputs are needed after connection of the power supply. The aeolog 3 data logger consists of a removable front panel which carries all active components of the data logger and a back casing being tightly connected to the mast and containing all sensor clamps. When being delivered the sensors are already connected to the sensor clamps. As a first step in the commissioning process the front panel needs to be removed from the back casing and using a cross recess screw driver. 3.1 Activation of data logger To activate the aeolog data logger the accumulator plug at the back of the front panel needs to be connected to its counterpart on the circuit board of the front panel. Consecutively the following displays will be shown for a few seconds: checking int. storage ... While showing this display the data logger performs a selftesting procedure. After a few seconds the following starting-screen indicates that the self-testing procedure was completed successfully: INENSUS aeolog 3 „name of site― The name of site will only be shown if it was entered in the respective menu beforehand. After activating the data logger the device starts recording the data immediately and automatically. © INENSUS GmbH, 19.09.2011 9/45 3.2 Handling of the data-logger The aeolog data logger is equipped with a button that is used to set the clock when being commissioned, to activate the display and to click through the currently measured and evaluated data. 3.3 Display auto power off To save battery power the display switches off automatically some seconds after the button was pressed last. Press the button again to reactivate the display. The duration of the display staying active after pressing the button last can be set in the Settings menu. 10/45 User Manual aeolog V3.x 3.4 Setting of time and date After pressing the button once the display changes to: Time Date 12:34:56 2010.01.02 The time is displayed in a 24h format ―hour:minute:second‖, the date is displayed in a ―year.month.day‖ format. Date and time can be set after pressing the button until a ―*‖ appears in the lower right corner of the display. The underlined digit can be incremented by pressing the button shortly. A 2-seconds-push on the button until a ―*‖ appears in the lower right corner makes the underline jump to the next digit which can be changed accordingly. Time Date 13:34:56 2010.01.02 After setting time and date, the display returns to the main menu. To quit the setting before all values are changed individually press the button for a period of 4 sec until a „#― appears. 3.5 Connection of sensors To connect the sensors from the back through to the front panel the flat ribbon cable needs to be connected to the respective socket at the back of the front panel. To complete the commissioning procedure the front panel needs to be screwed to the back casing. Please take care of the sealing being completely clean and closing thoroughly. © INENSUS GmbH, 19.09.2011 11/45 4 Display 4.1 Survey of currently measured values A1=11.3 A2=09.8 D=123 T=12.3 Depending on the sensor configuration chosen not all values are displayed. The display will be updated whenever a newly measured value is available. The following abbreviations will be used: Table 1: Abbreviations A1 (A2) V1 (V2) D T c i t TI 4.2 Measured values of Anemometer 1 (2) in m/s Velocity of Anemometer 1 (2) in m/s Wind Direction in ° Temperature in °C Current value Average value of the interval measured last Total average of all measured values since starting of the measuring campaign Turbulence Intensity Display of wind speed Measured values of anemometer 1 (A1) and after changing over to the next display, also anemometer 2 (A2) in meters per second (m/s) respectively. A1 c=11.3 i=07.3 t=04.9 Display of current (c) wind speed the average value of the last 10-min-interval (i) average value since the beginning of total measurements (t). 12/45 User Manual aeolog V3.x By pressing the button until a ―*‖ appears in the lower right corner of the display you will enter the detailed menu of this sensor as described in the following chapters. 4.2.1 Maximum wind speed Maximum V1=11.3 2007.04.01 12:23 Maximum wind speed since start of measurements with time stamp of its occurrence. 4.2.2 Turbulence intensity A1 Turb. int. TIt=12% TIi=16% Turbulence intensity throughout the total measuring campaign and turbulence intensity for the last interval. 4.2.3 Standard deviation A1 Standard dev. st=05.2 si=02.5 4.2.4 Distribution of wind speeds according to wind classes A1 0:23% 2:12% 1:15% 3:10% During measurement wind speeds are automatically assigned to wind classes e.g. from 0 to 1 m/s, from 1 to 2 m/s, etc. These wind classes usually serve as a basis for the evaluation of the energy yield of a wind turbine at the site of measurements. This data can be used to pre-design small wind turbine systems. „1:15%― means that 15 % of the measuring time the wind speed is between 1.00 and 1.99 m/s. The percentage values are rounded off. Therefore, the sum of the percentage values can differ from 100 % slightly. A closer analysis of wind-data can be © INENSUS GmbH, 19.09.2011 13/45 conducted using the time series data recorded on the storage card. All wind-speeds of v > 20 m/s are collected in the class „>20―. 4.3 Display of current wind direction Wind direction: D=123 This display option is available only if a wind-vane is installed. The ―N‖ marked direction of the wind vane has to face north. The wind directions will be shown accordingly: N : 0° E : 90° S : 180° W : 270° By pressing the button until a ―*‖ appears in the lower right corner of the display you will enter the detailed menu of this sensor as described in the following chapters. 4.3.1 Distribution of wind speeds according to wind directions and time distribution of wind directions These detailed evaluation-results of wind data from the top anemometer are only available if a wind vane is installed and the respective sensor configuration has been chosen in the settings menu. N 09%05.6/13.7 NNE 03%03.4/11.2 For each of the 16 sectors, information about the frequency, average wind speed and maximum wind speed is displayed. Example: In the second line of the display shown above the average wind speed is 3.4 m/s from north-north-eastern direction. Since every sector has an angle of 22.5°, NNE represents the sector from 11.25 to 33.75°. 3 % of the time since commencement of the measurement period the wind heads 14/45 User Manual aeolog V3.x from this direction and 11.2 m/s is the maximum value recorded in this sector. 4.4 Display of ambient temperature Temperature: T=12.4 This display option is only available if a temperature sensor is installed and a suitable setting is chosen in the settings menu. The reading is in °C. 4.5 Display of solar irradiation Solar radiation: SR=0326 W/qm This display option is only available if the accessory part solar sensor is attached to the top sensor bar. The value displayed is the power irradiated in a spectral distribution to be absorbed by a horizontal silicon solar cell. It is derived by measuring the short circuit current of the solar sensor. Utilizing trigonometric calculation and multiplying the efficiency of the solar module used in the hybrid power system the power output of solar modules can be calculated. Alternatively, different commercial software tools can be used. 4.6 Changing of settings after input of password Configure aeolog -> password area By pressing the button until a „*― appears in the lower right corner of the display the settings menu is entered. Once the password is entered it stays activated until the display turns off automatically even if the user leaves the settings menu. Depending on the password level of the user he can change the following settings: © INENSUS GmbH, 19.09.2011 15/45 16/45 User Manual aeolog V3.x User group Gets access to aeolog hirer _Copy data to SD-card The hirer’s password is equivalent to the last four digits of the data logger Software date (refer to chapter 4.7.3) aeolog owner _Clear internal storage, _Choose language, _Choose interval length, _Configure second anemometer, _Configure solar irradiation sensor, _Configure auto power off time, _Enter site name The owner’s password is shown on the delivery note when purchasing an aeolog. Each of the sub-menu items can be used to change a parameter or to enter a text. To activate the respective sub-menu item please press the button until a ―*― appears in the lower right corner of the display. Once activated, the underlined value can be changed by pressing the button shortly. The ―->‖ in front of the value to be changed indicates that the sub-menue item is activated. The parameter can be set by pressing the button until a ―*― appears in the lower right corner of the display. The display automatically changes over to the next sub-menu item or to the main menu. To jump from whatever sub-menu item back to the main menu just keep the button pressed for approx. 4 sec until a ―#‖ appears after showing the ―*‖. 4.6.1 Copy time series to an SD-card Write int. data to SD card? Using this sub-menu item the time series saved on the internal storage is copied to an SD-card. The time series saved on the internal storage stays unchanged. The internal storage is large enough to capture 3.5 years of 10-minutes averages. After that period of time the data logger starts overwriting the oldest time step stored. All newer data stays unchanged. © INENSUS GmbH, 19.09.2011 17/45 The data transfer from the internal storage to the SD-card can take up to 10 min. SD-cards of up to 2 GB can be used. The cards do not need to be prepared for the data transfer. ! Before writing data to the SD-card the aeolog formats the SD-card to become a 32 MB card independently of its actual capacity. ! All data that was stored on this card before inserting the card into the aeolog data logger is deleted during this process! 4.6.2 Clear internal storage Delete internal storage? Before setting up the aeolog wind monitoring system at a new site the internal storage of the data logger might need to be cleared. To delete the data saved on the internal storage use this sub-menu item. 4.6.3 Choose language Language: English The language of the display can be chosen in this sub-menu. The following languages can be chosen: Deutsch English 4.6.4 Choose interval length Interval length: 060s (1 min) The interval length indicates the period of time series data stored. 18/45 User Manual aeolog V3.x time step and averaging The following interval lengths can be chosen: 5 s (data points recorded are stored without averaging) 10 s 60 s (1 minute) 600 s (10 minutes) 900 s (15 minutes) 4.6.5 Configure second anemometer 2nd anemometer not installed If a second anemometer of the type Thies Kleinwindgeber is installed this needs to be set in this sub-menu item. If this sub-menu states that there is a second anemometer installed but actually there is not the time series of the second anemometer written to the storage shows „0―s only. 4.6.6 Configure solar irradiation sensor Radiation sensor not installed If an aeolog radiation sensor is installed this needs to be set in this sub-menu item. If this sub-menu states that there is a radiation sensor installed but actually it is not, the time series of the radiation sensor written to the storage contains random values without meaning. 4.6.7 Configure auto power off time / display timeout Display timeout 060s The display timeout is the duration the display stays activated after having pressed the button last. The following values can be chosen: 10 s, 30 s, 60 s (1 Min), 600 s (10 Min) and „always on―. © INENSUS GmbH, 19.09.2011 19/45 4.6.8 Enter site name Enter site name: The site name shown on the starting display can be entered in this sub-menu item. To enter the site name keep the button pressed until „*― appears in the lower right corner of the display. This activates the first character position of the name to be entered. Once activated, the character can be changed by pressing the button shortly. The activated position is marked by a blinking underline. The activated position jumps one step to the right if the button is pressed until a ―*‖ appears in the lower right corner of the display. If the button is pressed for 4 sec. until a „#― appears in the lower right corner of the display the display jumps to the main menu and sets the name entered. 4.7 Display of available data and battery storage Storage Battery 017% 4.32V The percentage displayed, represents the portion internal storage used since being cleared last. of the Below, the voltage of the battery is shown as an indicator of the battery state of charge. The battery is full when the voltage shows 4.1 V and empty if the voltage shows 3.6 V. By keeping the button pressed until „*― appears in the lower right corner the sub-menu is entered. This is explained in the following chapters. 4.7.1 Time within the current measurement interval Current interval 045/600s The display shows the time elapsed within the current time interval in seconds as well as the total duration of the interval in seconds. 20/45 User Manual aeolog V3.x 4.7.2 Record number and duration of measurement Record no.12408 086 days 04 hrs The aeolog counts the number of recordings to the storage and displays it accordingly. Below, the duration of the measuring campaign is shown in terms of days and hours. 4.7.3 Software- and Hardwareversion SW Test 10.11.12 HW Test 10.09.29 The display shows the date of the last software and hardware test. The format of the date is : Year.Month:Day (JJ.MM.DD) 4.7.4 Serial number Serial number: 0291108086 The display shows the serial number of the aeolog. 4.7.5 Internal memory address Int. mem. addr.: 0001.60 / 8191 The memory address used to store the last step of the time series in the internal storage is presented. 4.7.6 SD-storage card entered? SD-storage card not entered The data logger checks if the contact between the SD-storage card and the SD-card reader is good enough to copy data to the SD-storage card. If the SD-card is inserted properly the display shows ―SD-storage card entered―. If the SD-card is not inserted properly or not inserted at all the display shows ―SDcard not entered‖. © INENSUS GmbH, 19.09.2011 21/45 4.8 Display during periods of low battery state of charge Bat < 3.7 V No data transfer During periods of low battery state of charge a display as above is shown. This indicates that the data logger is in the energy saving mode meaning that no data can be copied from the internal storage to the SD-card. When exposing the PV cells recharged within some days. to sunlight the logger gets Alternatively, a USB-A plug and a respective USB power supply (e.g. USB socket at a laptop computer) can be used to recharge the aeolog battery. Charging the battery from completely empty to completely full using the USB power supply takes approx. one day. 22/45 User Manual aeolog V3.x 5 Preparation of wind mast set up 5.1 Choosing a wind site The mast of the monitoring system should be placed exactly at the site where the wind turbine is expected to be installed. If this is impossible a site with similar wind conditions should be chosen. As a rule of thumb there should be no building or vegetation higher than half of the hub height of the turbine within a radius of 200 m around the wind site to gain a good energy yield. In other words, the hub height should be at least double the size of the highest building or plant within a 200 m radius for a good energy output. Wind monitoring campaigns should be conducted with the top anemometer being close to the intended hub height of the wind turbine. 5.2 Base plate & ground anchors The three ground anchors delivered with the main parcel have to be driven into the ground in a 4 m distance from the base plate using a hammer or stone. Please refer to the picture below. The ground anchor has to be tilted away from the base plate in order not to be pulled out by the guy wire. If the ground does not allow the usage of ground anchors of the delivered kind a different way of fixing the guy wires has to be chosen. © INENSUS GmbH, 19.09.2011 23/45 Ground anchor Base plate 4m Ground anchor Ground anchor The bended corners of the base plate are pushed into the soil. If the ground does not allow the corners to be pushed in, the base plate shall be fixed with an alternative method to prevent the mast from shifting. The angle of the anchor points away from the base plate to make sure that the anchors cannot be pulled out by the guy wires. 24/45 User Manual aeolog V3.x 5.3 Preparation of the mast for erection ! Make sure to wear working gloves during the preparation of the mast for erection to prevent cutting injuries. The mast has to be prepared for erection while lying on the ground. After accomplishing the preparation procedure the mast can be installed. Pull out each of the segments of the aluminum mast till the marked area of the segment becomes fully visible. The 4th and the 5th segment counted from the top of the 15 m mast have to be pulled apart completely to slide the lower guy wire ring over the 5th segment. Rejoin the segments afterwards. Tighten the bolts. © INENSUS GmbH, 19.09.2011 25/45 The upper guy wire ring has to be slid over the top segment of the mast. Connect the bottom of the mast to the base plate at the site where it is supposed to be erected when the mast is still lying on the ground. 5.3.1 Mounting of the lower anemometer boom (with 15 m mast) The aluminium boom delivered must be fixed to the mast with a hose clamp. The hose clamp has to be unscrewed completely to be 26/45 User Manual aeolog V3.x pushed through the holes in the boom. The boom shall be rectangular to the mast and rectangular to the estimated main wind direction. The height of the lower anemometer shall be 8 to 10 m above the ground depending on the surrounding vegetation. The hose clamp is applicable in different sizes to be attached to the mast at different heights. 5.3.2 Mounting of the lower anemometer (if applicable) The lower anemometer has to be screwed to the boom at its end. The sensor cable shall be fixed to the bottom with cable ties. © INENSUS GmbH, 19.09.2011 27/45 5.3.3 Mounting the top anemometer or the combined wind sensor At the top of the mast different sensors can be installed. A single anemometer can be fixed to the side of the top of the mast with a hose clamp. The combined wind direction and speed sensor shall be slid over the top end of the top segment and fixed with the hexagon key or the hose clamp delivered. The mark signed ―N‖ has to face north when the mast is erected. The version of the combined wind direction and wind speed sensor might divert from the picture below. After installation of the anemometers note the exact heights above ground in the prepared commissioning protocols at the end of this documentation. 5.3.4 Mounting of the data logger The data logger integrates solar photovoltaic cells for power supply. These cells shall face the sun during mid day and shall not be shaded by any objects surrounding the aeolog. Protect the data logger from extreme weather conditions. Ensure that the inside of the data logger is completely dry before closing the case. 28/45 User Manual aeolog V3.x The threaded cable connection must be at the bottom of the data logger. 5.3.5 Fixing of the cables to the mast The sensor cables are to be fixed tightly towards the mast using the black cable ties delivered with the mast. The distance between the cable ties shall be approx. 0.5 m. Directly below the sensors and at guy wire rings the sensor cable shall have a small slack as shown in the picture below. © INENSUS GmbH, 19.09.2011 29/45 6 Commissioning and handling of the data logger ! 6.1 To open the data logger casing a cross recess screw driver of the size PH2 is needed Alignment of the wind vane The „N―-marked spot at the wind vane is supposed to face north once the mast is erected. If the „N―-mark and the mark at the wind vane cover each other the data logger should show a value between approx. 355 and 5°. 0° cannot be measured due to the technical design of the wind vane. 6.2 Connection of external sensors (premounted delivery) The aeolog can record data of up to two anemometers, one wind vane and one external temperature and brightness sensor. To connect the sensor cables to the data logger please open the casing of the data logger carefully. Screw out the four cross recess screws at the front panel of the data logger until the front plate can be lifted. The data logger consists of two units being connected to each other via a flat ribbon cable. Please take care of the cable when opening the casing in order not to damage the plugs or the cable. The sensor cables with 7 mm diameter maximum must be passed through the data logger casing and fixed with the threaded cable glands. External sensors can be connected via a shielded or a non-shielded cable with up to 0.25 mm2 cross section. Flexible sensor cables have to be connected using wire end sleeves to guarantee good electrical contact between the wire and the clamp. To connect the wire to the clamp, just push the wire end sleeve into the clamp. To remove the wire from the clamp push a small flat screw driver strongly into the orange square hole and simultaneously pull the wire end sleeve out of the clamp. 30/45 User Manual aeolog V3.x The clamp number and the abbreviation of the sensor are printed on the circuit board. The sensors being delivered with the data logger are readily configured and signed and can be connected to the clamps on the circuit board directly. The number of the wire corresponds to the number on the circuit board. 6.3 Power supply and battery charging using a USB socket Power is supplied of the aeolog data logger through the integrated solar photovoltaic cells and the integrated accumulators. The accumulators are recharged automatically by photovoltaic cells. In case of a low battery state of charge the same will be shown on the display changing with the menu periodically. During a period of low battery state of charge no data can be copied from the internal storage to the SD-card. As an alternative to charging via the solar photovoltaic cells the logger can be connected to a power supplying USB port (e.g. with a laptop). To do this connect the USB socket to the power supplying USB port using a USB-A plug. Charging the accumulator from completely empty to completely full needs approx. one day. The front panel can be removed from the back casing to charge the batteries. 6.4 Closing the data logger casing Please make sure that the plugs and clamps are connected and fixed properly before closing the data logger casing. The plugs can be used just in one direction. Furthermore, make sure that the packing seal is not dirty or broken. When installing the data logger the threaded cable gland has to face down! 6.5 Setting the clock After commissioning of the data logger, it conducts a selfchecking routine. After some seconds the starting screen © INENSUS GmbH, 19.09.2011 31/45 appears. Jump to the time and date screen by pressing the button shortly. Time and date shown on this screen can be changed after pressing the button until a ―*‖ appears in the lower right corner of the display. By pressing the button shortly the underlined number is incremented. Keeping the button pressed for two seconds makes the underline jump one position to the right. The aeolog clock is a crystal controlled real time clock which can realize accuracy with deviation of some minutes per year. ! 6.6 The standard time (winter time) should be used all through the year to guarantee a consistency of the time series. Test of function Before erecting the mast the correct connection anemometers and the wind vane has to be checked. of the Turn the wind vane until the two marked lines facing north are aligned and then check the display. To activate the display press the button of the data logger as often as necessary to show the figures as shown below. V1=00.0 V2=00.0 D=123 T=12.3 In this position the ―D=000― or a similar small value representing the wind direction has to be shown on the display. Watching the wind vane from the top the values rise when turning right till the maximum value of 355° is reached. The wind direction is updated every 10 seconds and so is the display. Due to the design of the wind vane there are no values between 355° and 5°. The top anemometer is turned slowly by hand for a test. One revolution per second relates to a wind speed of 0.9 m/s. Repeat the test for the second anemometer if installed. 32/45 User Manual aeolog V3.x 7 Erecting the mast Before pulling up the mast please activate the data logger and check the sensor functionality as described in the chapter before. ! For safety reasons the guy wires shall not be pulled without wearing gloves. ! For mast tilt up at least two people are required. ! Mast tilt up should be carried out at days with low wind speeds. When erecting the mast at stronger winds at least three people are required. The following procedure is valid for mast erection on a horizontal and plane surface. For uneven or tilted surfaces the guy wire lengths need to be adjusted. The bottom end of the mast shall be lying on the base plate without connecting it with the bolt. Move the mast over to one side until the mast and the line between base plate and a ground anchor becomes a rectangle. Connect the respective guy wire from the guy wire ring on 9 m height to this ground anchor pulling the wire to almost tight. © INENSUS GmbH, 19.09.2011 33/45 Move the mast to the other side and connect the second wire to the ground anchor the same way. This is how the guy wires get the right length for erection. Make sure that the base plate and the bottom of the mast does not shift during this process. Ground anchors Radius of 4 m After having connected the two guy wires the mast shall be positioned exactly between the two guy wires connected already. The guy wires already connected lie on the ground loosely. However, as soon as the tower is tilted up these guy wires have the right length. With the 15 m tower the upper guy wires hang loosely without being connected anywhere at this stage. 34/45 User Manual aeolog V3.x The bottom of the mast shall be connected to the base plate using the bolt of the base plate. The corners of the base plate shall be pushed into the ground. Upper guy wires hanging loosely Ground anchors with fixed guy wires Place two cable clamps next to each of the ground anchors or give them to the person who is in charge of pulling the guy wires and fixing them to the anchors. Make sure you have a spanner No. 7 (metric) with you. Person 1 keeps the guy wire (guy wire ring of 9 m height) which is most parallel to the tower lying on the ground in his/her © INENSUS GmbH, 19.09.2011 35/45 hand and keeps the bottom of the tower to the ground with his/her feet. Person 2 lifts the top of the tower above his/her head and walks slowly to the bottom of the tower. Person two makes sure that the guy wire fixed to the anchor is tight at all times. Person 1 pulls the guy wire in his/her hands and helps person 2 to tilt up the tower this way. Tilt up the tower carefully and slowly! Once the tower is in upright position the remaining guy wires of the guy wire ring with 9 m height shall be fixed to the anchor by person 1. Person 2 holds the tower in its upright position. Person 1 adjusts the cable lengths until the tower is completely vertical. If you have a 15 m tower now you can fix the upper guy wires to the ground anchors using cable clamps. Adjust the length of the guy wires till the tower is completely vertical. The guy wires shall be pulled by hand. In its final position the guy wires must be tight enough to let the tower move maximal two times the diameter of the tower itself at the guy 36/45 User Manual aeolog V3.x wire ring. On the other hand the guy wires must be slack enough for the tower to move a little bit. ! 7.1 If you tighten the guy wires too much the mast bends and can buckle in a gust! Documentation of the setup procedure If the tower set up is documented properly, potential mistakes in measured data can be explained and deleted or corrected. Documentation can be realized with photographs and drawings, or in writing. Please find attached to the user manual ten empty commissioning reports. 7.2 Transferring the data from the data logger to a computer for evaluation To evaluate the time series stored in the data-logger the data needs to be copied to a computer. To do this, in a first step the data shall be copied from the internal aeolog storage to an SD—card. Insert the SD-card into the SD-card reader at the back of the aeolog front panel, go to the menu item ―Configure aeolog -> password area‖, enter the password sent to you with the delivery note, Configure aeolog -> password area go to the sub-menu item ―Write int. data to SD-card?‖, Write int. Data to SD-card? activate the sub-menu by keeping the button pressed for 2 sec until a ―*‖ appears in the lower right corner of the display and choose ―-> YES‖. Set the value by keeping the button pressed for 2 sec until a ―*‖ appears in the lower right corner of the display. During this procedure it does not make a difference if the front panel is connected to the back casing of the logger. While writing to the SD-card the logger does not record any © INENSUS GmbH, 19.09.2011 37/45 data coming from the sensors. The writing process can take up to ten minutes. In a second step the SD-card can be inserted into an SD-card reader of the computer which will be used to evaluate the data. 7.3 Evaluation of measured data The data measured is recorded on the storage card as unformatted ASCII text. The SD-card can be read using a standard SD-card reader. On the SD-card you will find a file named ―winddata.txt―, which can be opened with any spreadsheet software. The columns are separated by tabulator. Decimal sign is the dot. A readymade EXCEL spreadsheet for data evaluation can be found on the INENSUS Website under http://www.inensus.com/en/products1.htm Table 2: Recorded data Data logger : INENSUS aeolog (V3.0) URL : www.inensus.com Software version: 2011.07.25 Serial number : 0291012001 Site name : TEST 3SDC RN 000317 000318 000319 000320 000321 000322 000323 38/45 Date 2011.06.12 2011.06.12 2011.06.12 2011.06.12 2011.06.12 2011.06.12 2011.06.12 Time 00:01:40 00:01:50 00:02:00 00:02:10 00:02:20 00:02:30 00:02:40 v1_avg 03.0 02.1 02.3 01.8 03.6 03.5 02.8 v1_min 00.8 00.0 00.0 00.0 00.4 00.4 00.0 User Manual aeolog V3.x v1_max 05.4 04.2 04.8 03.2 03.8 05.2 04.8 v1_std 02.2 01.9 02.1 01.3 01.6 02.4 02.3 dir 014 018 044 040 036 038 038 temp 14.2 14.0 14.0 14.0 13.8 13.8 13.6 solar 000 000 000 000 000 000 000 V_batt 3.90 8 Appendix 8.1 Technical data Table 1: Summary of technical data Energy supply Dimensions(B x H x T) Internal storage capacity External Sensors (Input channels protected against over voltage) Display Solar cells with 3,7 V; 1,5 Ah lithium accumulator. 120 x 80 x 57 mm³ 160.000 data sets 2 anemometers (wind-speed) 1 wind vane (wind direction) temperature solar irradiation Current wind speed and wind direction Average wind speed for every month and for the whole period of measurements since commissioning of data logger wind speeds with classes of 1 m/s Frequency and average wind speed in 16 direction sectors Time & date Table 3: Sensor connection clamps aeolog clamp numbers External sensor connection 8 GND 7 A1 Common signal mass Pulse input for anemometer 1 (reed-switch closure to GND) Signal form the wind vane (1 k potentiometer) 3 V supply voltage for the wind vane and temperature sensor Temperature sensor (10 k NTC) Brightness sensor (silicon diod) Common signal mass Pulse input for anemometer 2 (reed-switche closure to GND) 6 Vane 5 +3V 4 3 2 1 Temp Light GND A2 © INENSUS GmbH, 19.09.2011 39/45 Figure 1: Schematic of external sensor configuration. Cable numbers from sensors supplied with the aeolog data logger have the same numbering as the clamp numbers printed on the circuit board. Colours and numbers in the data sheets supplied with the sensors may differ from the clamp numbers. 8.2 Permissible operation conditions The aeolog data logger is applicable for outside installation and temperatures between -10°C and +50°C. If the front panel is mounted correctly by the user and the sealing has the right fit casing of the data logger has protection class IP 44. This means that the data logger is protected against penetration of foreign bodies and splashproof. Protect the data logger from extreme weather conditions. The cable entry must face the ground. 40/45 User Manual aeolog V3.x 8.3 EG-conformity declaration The signatory representing the manufacturer mentioned below INENSUS GmbH Am Stollen 19 38640 Goslar Germany herewith confirms that the product aeolog data logger for small wind turbines and hybrid systems is in accordance with the EG-guideline 89/336/EWG and obeys the following standards • EN 55022:2006 Information technology equipment – Radio disturbance characteristics – Limits and methods of measurement • EN 55024:2002 Information technology equipment Immunity characteristics - Limits and methods of measurement - as long as the following operation conditions are obeyed. The area of applicability is the free field application outside of private or industrial buildings or plants. The data logger is equipped with different sensors that are connected to a metallic tower. The operator of the data logger has to make sure that the tower and the sensors are installed correctly and safely and that there is lightning protection available. The presence of strong electromagnetic fields in the vicinity of transformer station, overhead lines, transmitter masts or industrial plants may interfere with the function of the data logger and the sensors. The data logger and the sensors are not protected against direct lightning strikes. The technical documentation may be viewed at the manufacturer’s facilities. Goslar, July 30th 2011 Dipl.-Ing. Holger Peters (Head of the INENUS R&D department and person in charge for EMC) © INENSUS GmbH, 19.09.2011 41/45 8.4 Disposal of the data logger The aeolog data logger is registered in Germany with the number WEEE-Reg.-Nr. DE 23444271 for free of charge disposal at local collecting points for electronic devices. The legal basis for this is the Electric devices law (ElektroG). Please do not put the data logger into your home garbage. The data logger is manufactured RoHS conform regarding the EGguideline 2002/95/EG Restriction of the use of certain hazardous substances of January 27th 2003. 8.5 Troubleshooting 8.5.1 The display stays empty If the data logger display does not respond after pressing the button please check: That the photovoltaic cells are exposed to direct sunlight regularly The plug of the accumulator is connected tightly with the socket on the circuit board If the above is granted the micro controller of the aeolog might be crashed due to unfavorable ambient conditions. You can reset the micro controller by unplugging the battery from the circuit board, unplugging the USB-A plug from the logger and covering the photovoltaic cells from sunlight for a few seconds. Afterwards reconnect the powr supplies you disconnected before and uncover the photovoltaic cells. The data logger is now reset and starts its operation from the beginning. All data recorded so far stays unchanged. 42/45 User Manual aeolog V3.x 8.5.2 The display does not show any values although the sensors move Please make sure that: The sensors are connected to the clamps in the back casing of the data logger properly and in the right order The plug of the flat ribbon cable of the aeolog front panel is connected to its socket in the back casing properly The flat ribbon cable is undmaged 8.5.3 There is water in the data-logger casing Please make sure that: The water drainage hole in the back casing of the data logger faces down to the ground The water drainage hole is the lowest place of the data logger The sealing of the front panel is completely clean and the cover is fixed to the back casing with screws tightened properly 8.6 Contact Address: URL: Email: Tel.: Fax: 8.7 INENSUS GmbH Am Stollen 19 38640 Goslar Germany www.inensus.com [email protected] +49 (5321) 6855 101 +49 (5321) 6855 109 Documentation of the set up procedure ! Check the right fit of the ground anchors, the tightness of the cable clamps and the length of the cables periodically. © INENSUS GmbH, 19.09.2011 43/45 On the following pages you can find some empty forms for writing a commissioning protocol. You should use this form to document each change of the setting at the measuring site. This facilitates the data evaluation later on. 44/45 User Manual aeolog V3.x 8.7.1 Commissioning protocol #1 Exact name and description of the monitoring site Commissioning carried out by date & time Height of the top anemometer Height of the bottom anemometer Deviation of wind vane from true north Distance, height and direction of buildings Storage card marked with Distance, height and direction of buildings Date of battery replacement Battery type Problems during installation Sketch of the site and its surroundings with distances Anchors and wire clips are checked? Photographs of mast, sensors, and surroundings are made? © INENSUS GmbH, 19.09.2011 45/45