1
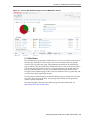
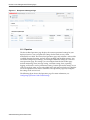
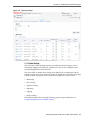
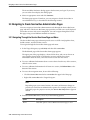
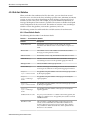
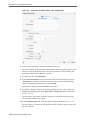
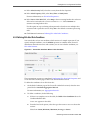
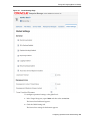
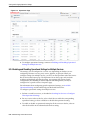
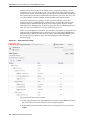
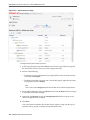
Monitoring SLA and Pipeline Alerts
1. In the Target Navigator, expand SOA and select service-bus.
The Service Bus Dashboard page appears.
2. Click the Alert History tab.
3. Perform a search for the alert you want to view, as described in Filtering SLA and
Pipeline Alerts.
4. Click the name or summary of an alert in the Alert History table.
The Alert Detail dialog appears.
5. To update the annotation, enter the new text in the text box, and click Apply.
6. Click the previous or next buttons to view information for other alerts in the table.
7. When you are done viewing the information, click Close.
4.7.5 Viewing the Alert Rule Configuration
You can view the configuration of the actual rule that triggered an alert. The Alert
Rule dialog displays the following configuration information for a rule:
• The name of the alert rule (for SLA alerts only)
• The name and description of the rule
• The expiration time of the rule
• Whether the rule is enabled or disabled
• The alert severity
• The alert frequency
• Whether processing for the rule is stopped after generating an alert
• The aggregation interval
• The condition expression
4.7.5.1 Viewing the Alert Rule Configuration on the Service Bus Dashboard
You can view the alert rule configuration on the Service Bus Dashboard.
To view the alert rule configuration on the Dashboard:
1. In the Target Navigator, expand SOA and select service-bus.
The Service Bus Dashboard page appears.
2. In the Alert History table, click the icon in the Info column in the row of the alert
you want to view.
The Alert Rule dialog appears.
3. When you are done viewing the information, click Close.
4.7.5.2 Viewing the Alert Rule Configuration on the Alert History Page
You can view the alert rule configuration on the Alert History page.
4-16 Administering Oracle Service Bus