Download Administering Oracle Service Bus
Transcript
Oracle® Fusion Middleware Administering Oracle Service Bus 12c (12.2.1) E60581-01 October 2015 Documentation for administrators that describes how to monitor and manage the Oracle Service Bus runtime environment, including importing and exporting, monitoring, reporting, operational settings, and global resource management. Oracle Fusion Middleware Administering Oracle Service Bus, 12c (12.2.1) E60581-01 Copyright © 2008, 2015, Oracle and/or its affiliates. All rights reserved. Primary Author: Oracle Corporation Contributing Authors: Contributors: This software and related documentation are provided under a license agreement containing restrictions on use and disclosure and are protected by intellectual property laws. Except as expressly permitted in your license agreement or allowed by law, you may not use, copy, reproduce, translate, broadcast, modify, license, transmit, distribute, exhibit, perform, publish, or display any part, in any form, or by any means. Reverse engineering, disassembly, or decompilation of this software, unless required by law for interoperability, is prohibited. The information contained herein is subject to change without notice and is not warranted to be error-free. If you find any errors, please report them to us in writing. If this is software or related documentation that is delivered to the U.S. Government or anyone licensing it on behalf of the U.S. Government, then the following notice is applicable: U.S. GOVERNMENT END USERS: Oracle programs, including any operating system, integrated software, any programs installed on the hardware, and/or documentation, delivered to U.S. Government end users are "commercial computer software" pursuant to the applicable Federal Acquisition Regulation and agencyspecific supplemental regulations. As such, use, duplication, disclosure, modification, and adaptation of the programs, including any operating system, integrated software, any programs installed on the hardware, and/or documentation, shall be subject to license terms and license restrictions applicable to the programs. No other rights are granted to the U.S. Government. This software or hardware is developed for general use in a variety of information management applications. It is not developed or intended for use in any inherently dangerous applications, including applications that may create a risk of personal injury. If you use this software or hardware in dangerous applications, then you shall be responsible to take all appropriate fail-safe, backup, redundancy, and other measures to ensure its safe use. Oracle Corporation and its affiliates disclaim any liability for any damages caused by use of this software or hardware in dangerous applications. Oracle and Java are registered trademarks of Oracle and/or its affiliates. Other names may be trademarks of their respective owners. Intel and Intel Xeon are trademarks or registered trademarks of Intel Corporation. All SPARC trademarks are used under license and are trademarks or registered trademarks of SPARC International, Inc. AMD, Opteron, the AMD logo, and the AMD Opteron logo are trademarks or registered trademarks of Advanced Micro Devices. UNIX is a registered trademark of The Open Group. This software or hardware and documentation may provide access to or information about content, products, and services from third parties. Oracle Corporation and its affiliates are not responsible for and expressly disclaim all warranties of any kind with respect to third-party content, products, and services unless otherwise set forth in an applicable agreement between you and Oracle. Oracle Corporation and its affiliates will not be responsible for any loss, costs, or damages incurred due to your access to or use of third-party content, products, or services, except as set forth in an applicable agreement between you and Oracle. Contents Preface ............................................................................................................................................................... xv Documentation Accessibility .................................................................................................................... xv Conventions................................................................................................................................................. xv What's New in This Guide....................................................................................................................... xvii New and Changed Features for 12c (12.2.1) ......................................................................................... xvii Significant Documentation Changes for 12c (12.2.1) ........................................................................... xvii Part I 1 2 Learning about Oracle Service Bus Administration Interoperability, Compatibility, and System Support 1.1 Supported System Configurations ................................................................................................ 1.2 Interoperability and Compatibility with Oracle Products......................................................... 1-1 1.3 Supported Standards and Implementations................................................................................ 1-1 1.4 Interoperability and Support Limitations .................................................................................... 1-4 1.4.1 .NET Interoperability Limitations...................................................................................... 1-4 1.4.2 Apache Axis Interoperability Limitations ........................................................................ 1-5 1.4.3 WebSphere Interoperability Limitations .......................................................................... 1-6 1-1 Introduction to Oracle Service Bus Administration 2.1 Oracle Fusion Middleware Overview .......................................................................................... 2-1 2.2 Oracle Service Bus Overview......................................................................................................... 2-1 2.2.1 Introduction to Service Monitoring and Management ................................................... 2-2 2.2.2 Introduction to the Oracle Service Bus Monitoring Framework................................... 2-2 2.2.3 Accessing Statistics Using the JMX API ............................................................................ 2-4 2.2.4 Accessing Statistics in a Cluster ......................................................................................... 2-4 Oracle Service Bus Runtime Monitoring...................................................................................... 2-4 2.3.1 Service Health Monitoring .................................................................................................. 2-4 2.3.2 SLA and Pipeline Alert Monitoring................................................................................... 2-5 2.3.3 Resequencing Group Monitoring ...................................................................................... 2-6 2.3.4 Log File Monitoring ............................................................................................................. 2-7 2.3 iii 2.3.5 2.4 2.5 2.6 3 2-8 2.4.1 Environment Customization .............................................................................................. 2-8 2.4.2 Runtime Configuration........................................................................................................ 2-8 2.4.3 Business Service Endpoint Management .......................................................................... 2-9 2.4.4 Tuning Performance with Endpoint Throttling............................................................... 2-9 2.4.5 Importing and Exporting Resources.................................................................................. 2-9 2.4.6 Diagnostics .......................................................................................................................... 2-10 Oracle Service Bus Runtime Security.......................................................................................... 2-10 2.5.1 Working with Security Policies ........................................................................................ 2-10 2.5.2 Defining Security Administration.................................................................................... 2-10 Introduction to Aggregation Intervals........................................................................................ 2-11 2.6.1 Refresh Rate of Monitored Data....................................................................................... 2-11 2.6.2 Sampling Intervals Within Aggregation Intervals ........................................................ 2-11 2.6.3 Aggregation Interval Properties....................................................................................... 2-12 2.6.4 Resetting the Statistics ....................................................................................................... 2-12 Server Monitoring and Management.......................................................................................... 2-12 2.8 Oracle Service Bus and Oracle Enterprise Scheduler ............................................................... 2-12 Getting Started with Oracle Service Bus Administration Introduction to the Management and Monitoring Pages .......................................................... 3-1 3.1.1 Service Bus Domain-Level Monitoring Pages.................................................................. 3-2 3.1.2 Service Bus Project Monitoring Pages ............................................................................... 3-8 3.1.3 Service Bus Service Monitoring Pages .............................................................................. 3-9 3.2 Logging in to Oracle Enterprise Manager Fusion Middleware Control ................................. 3-9 3.3 Navigating to Oracle Service Bus Administration Pages ........................................................ 3-10 3.3.1 Navigating Through the Service Bus Home Page and Menu...................................... 3-10 3.3.2 Navigating Through the Service Bus Projects Home Page and Menu ....................... 3-12 3.3.3 Navigating to Oracle Service Bus Pages from the Home Page.................................... 3-13 3.4 Navigating to the System MBean Browser ................................................................................ 3-13 3.5 Setting Accessibility Options ....................................................................................................... 3-13 3.6 Logging out of Oracle Enterprise Manager Fusion Middleware Control ............................. 3-13 3.7 Starting Oracle Service Bus Servers ............................................................................................ 3-14 Part II Monitoring Oracle Service Bus Monitoring Oracle Service Bus Alerts 4.1 4.2 iv 2-7 2.7 3.1 4 Message Reporting............................................................................................................... Oracle Service Bus Runtime Management................................................................................... Introduction to Oracle Service Bus Alerts.................................................................................... 4-1 4.1.1 Alerts on the Service Bus Dashboard ................................................................................ 4-1 4.1.2 Alerts and Operational Settings ......................................................................................... 4-2 About Service Level Agreement Alerts ........................................................................................ 4-2 4.2.1 SLA Alert Severity Levels ................................................................................................... 4-3 4.2.2 Aggregation Intervals .......................................................................................................... 4-3 4.2.3 SLA Alert Frequencies ......................................................................................................... 4-3 4.2.4 SLA Alert Statistics............................................................................................................... 4-4 About Pipeline Alerts...................................................................................................................... 4-5 4.3.1 A Sample Use Case for Pipeline Alerts ............................................................................. 4-6 4.4 Enabling and Disabling Alerts....................................................................................................... 4-6 4.5 Creating Service Level Agreement Alert Rules .......................................................................... 4-6 4.5.1 Before You Begin .................................................................................................................. 4-7 4.5.2 Configuring SLA Alert Rule Properties ............................................................................ 4-7 4.5.3 Defining SLA Alert Rule Conditions................................................................................. 4-9 4.3 4.6 4.7 5 4.6.1 Editing Alert Rules............................................................................................................. 4-11 4.6.2 Deleting Alert Rules........................................................................................................... 4-12 Monitoring SLA and Pipeline Alerts .......................................................................................... 4-12 4.7.1 Enabling Alert Reporting .................................................................................................. 4-13 4.7.2 Viewing all SLA and Pipeline Alerts in a Domain ........................................................ 4-13 4.7.3 Filtering SLA and Pipeline Alerts .................................................................................... 4-14 4.7.4 Viewing SLA or Pipeline Alert Details............................................................................ 4-15 4.7.5 Viewing the Alert Rule Configuration ............................................................................ 4-16 4.7.6 Deleting an SLA or Pipeline Alert ................................................................................... 4-17 4.7.7 Purging SLA or Pipeline Alerts........................................................................................ 4-17 Monitoring Oracle Service Bus Service Health 5.1 5.2 5.3 6 Updating SLA Alert Rules............................................................................................................ 4-11 About Service Health Metrics ........................................................................................................ 5-1 5.1.1 Service Health Metrics for Domains and Projects ........................................................... 5-1 5.1.2 Proxy Service Metrics........................................................................................................... 5-2 5.1.3 Business Service Metrics...................................................................................................... 5-2 5.1.4 Pipeline Service Metrics ...................................................................................................... 5-3 5.1.5 Split-Join Service Metrics .................................................................................................... 5-3 Monitoring Service Health Statistics............................................................................................. 5-3 5.2.1 5-4 Viewing Statistics for the Services with the Most Errors................................................ 5.2.2 Viewing Service Health Statistics for a Domain .............................................................. 5-4 5.2.3 Viewing Service Health Statistics for a Project ................................................................ 5-6 5.2.4 Viewing All Service Health Statistics for a Service ......................................................... 5-8 Resetting Statistics for Service Monitoring .................................................................................. 5-9 5.3.1 5-9 What You Might Need to Know About Resetting the Statistics.................................... Monitoring Resequencing Groups 6.1 Introduction to Resequencing Groups.......................................................................................... 6-1 6.1.1 Oracle Service Bus Resequencing Message States ........................................................... 6-1 6.1.2 Resequencer Error Handling .............................................................................................. 6-2 6.1.3 Resequencer Database ......................................................................................................... 6-2 6.1.4 How Deployment Activities Affect Resequencing.......................................................... 6-2 6.1.5 How Server Shutdown Affects Resequencing ................................................................. 6-3 v 6.2 Configuring Resequencing at Runtime ........................................................................................ 6-3 6.3 Monitoring Resequencing Groups and Messages ...................................................................... 6-4 6.3.1 Monitoring Resequencing Groups and Messages ........................................................... 6-4 6.3.2 Viewing Information About a Resequencing Group ...................................................... 6-5 Managing Resequencing Groups at Runtime.............................................................................. 6-6 6.4.1 Skipping Message Sequence IDs ........................................................................................ 6-6 6.4.2 Recovering when a Resequencing Group Times Out .................................................... 6-6 6.4.3 Recovering from Resequencing Faults.............................................................................. 6-7 6.4 7 Configuring and Monitoring Log Files 7.1 7.2 7.3 7.4 7.5 Part III 8 7-1 7.1.1 ODL Log Files ....................................................................................................................... 7-1 7.1.2 ODL Logging Levels ............................................................................................................ 7-1 7.1.3 ODL Message Format .......................................................................................................... 7-2 7.1.4 ODL Log Configuration ...................................................................................................... 7-2 7.1.5 Oracle Service Bus Loggers................................................................................................. 7-2 Configuring Diagnostic Logging for Oracle Service Bus........................................................... 7-3 7.2.1 About Service Bus Logging in Fusion Middleware Control.......................................... 7-3 7.2.2 Configuring Log Levels and Log Files for Service Bus................................................... 7-3 7.2.3 Configuring Oracle Service Bus Logging using WLST Commands ............................. 7-4 7.2.4 Setting Logging Levels for Debugging in Fusion Middleware Control....................... 7-4 7.2.5 Setting the Prefix for Oracle Service Bus Error Messages .............................................. 7-5 7.2.6 Configuring Oracle Service Bus for Offline Logging ...................................................... 7-5 Viewing Diagnostic Log Files for Oracle Service Bus ................................................................ 7-5 7.3.1 Viewing Oracle Service Bus Log Files in Fusion Middleware Control ........................ 7-5 7.3.2 Customizing the Log Message View ................................................................................. 7-6 7.3.3 Viewing Oracle Service Bus Log Files Using WLST Commands .................................. 7-7 Oracle Service Bus Loggers ............................................................................................................ 7-7 7.4.1 Service Bus Standard Loggers ............................................................................................ 7-7 7.4.2 Service Bus Debug Loggers in 11g and 12c ...................................................................... 7-8 Log Configuration After Upgrading from 11g.......................................................................... 7-11 7.5.1 Logging Levels.................................................................................................................... 7-11 7.5.2 Log Message Formatting ................................................................................................... 7-11 Managing the Oracle Service Bus Runtime Configuring Operational and Global Settings 8.1 8.2 vi Introduction to Oracle Service Bus Logging................................................................................ Introduction to Operational Settings ............................................................................................ 8-1 8.1.1 Available Operational Settings........................................................................................... 8-1 8.1.2 Global and Service-Level Operational Settings ............................................................... 8-6 Viewing and Configuring Operational Settings.......................................................................... 8-7 8.2.1 Configuring Operational Settings at the Global Level.................................................... 8-8 8.2.2 Operational Settings at the Global Level ........................................................................ 8-10 9 Enabling and Disabling Operational Settings for Multiple Services .......................... 8-12 8.2.5 Enabling and Disabling Operational Settings for a Single Service ............................. 8-13 8.2.6 Setting the Aggregation Interval for a Service ............................................................... 8-14 8.2.7 Configuring the Monitoring Level for a Pipeline or Split-Join.................................... 8-14 8.2.8 Configuring Message Tracing for a Service.................................................................... 8-15 8.2.9 Configuring the SLA Alert Level for a Service .............................................................. 8-16 8.2.10 Configuring the Pipeline Alert Level ............................................................................ 8-16 8.2.11 Configuring the Logging Level for a Service ............................................................... 8-17 8.2.12 Configuring Throttling for a Business Service ............................................................. 8-17 8.2.13 Configuring Offline Endpoint URI Handling for a Business Service....................... 8-17 Making Bulk Updates to Operational Settings.......................................................................... 8-17 8.4 Preserving Operational Settings During Resource Imports .................................................... 8-17 Customizing Oracle Service Bus Environments 9.2 About Environment Values............................................................................................................ 9-1 9.1.1 Find and Replace .................................................................................................................. 9-2 9.1.2 Configuration Files............................................................................................................... 9-2 Finding and Replacing Environment Values Using the Oracle Service Bus Console ........... 9-4 9.2.1 Finding Environment Values.............................................................................................. 9-5 9.2.2 Replacing Environment Values.......................................................................................... 9-6 Using Configuration Files to Update Environment Values and Operational Settings ......... 9-7 9.3.1 Creating a Configuration File ............................................................................................. 9-7 9.3.2 Executing a Configuration File........................................................................................... 9-8 9.4 Available Environment Values...................................................................................................... 9-8 9.5 Environment Values for Operational Settings........................................................................... 9-13 9.6 Sample Configuration Files .......................................................................................................... 9-14 9.3 11 Searching for Services to Configure Their Operational Settings................................. 8-11 8.2.4 8.3 9.1 10 8.2.3 Importing and Exporting Oracle Service Bus Resources 10.1 About Importing and Exporting Oracle Service Bus Resources........................................... 10-1 10.2 Exporting Oracle Service Bus Resources in Fusion Middleware Control ........................... 10-1 10.3 Importing Oracle Service Bus Resources in Fusion Middleware Control........................... 10-3 Defining Access Security for Oracle Service Bus 11.1 Understanding Oracle Service Bus Application Security ...................................................... 11-1 11.1.1 Users................................................................................................................................... 11-1 11.1.2 Groups................................................................................................................................ 11-2 11.1.3 Roles ................................................................................................................................... 11-2 11.1.4 Access Control Policies.................................................................................................... 11-4 11.1.5 Security Configuration Data and Sessions ................................................................... 11-5 11.2 Security Configuration During Exports ................................................................................... 11-5 11.3 Configuring Oracle Service Bus Administrative Security ..................................................... 11-5 11.3.1 How to Grant Permissions to Individual Users........................................................... 11-5 vii 11.4 Part IV 12 How to Grant Permissions to Users in User Groups .................................................. 11-6 11.3.3 Creating Oracle Service Bus Groups ............................................................................. 11-6 11.3.4 Granting Permissions to Groups.................................................................................... 11-7 11.3.5 Creating Oracle Service Bus Users ................................................................................ 11-9 11.3.6 Granting Access Permissions By Assigning Users to Groups ................................... 11-9 11.3.7 Granting Permissions to Individual Users ................................................................. 11-10 Securing Oracle Service Bus in a Production Environment ................................................ 11-12 11.4.1 Undeploying the Service Bus (SB) Resource .............................................................. 11-12 11.4.2 Protection of Temporary Files With Streaming body Content ................................ 11-13 11.4.3 Protecting Against Denial of Service Attacks on the Oracle Service Bus Console 11-13 Performing Advanced Administration Tasks Configuring Reporting for Messages and Alerts 12.1 12.2 12.3 Introduction to the Service Bus Reporting Framework ......................................................... 12-1 12.1.1 Message Report Configuration....................................................................................... 12-1 12.1.2 Default Reporting Provider ............................................................................................ 12-2 12.1.3 Custom Report Providers................................................................................................ 12-2 12.1.4 Reporting Workflow ........................................................................................................ 12-2 About the JMS Reporting Provider ........................................................................................... 12-3 12.2.1 About the Pipeline Report Action.................................................................................. 12-4 12.2.2 Reporting Actions in Global Transactions.................................................................... 12-5 Configuring a Database for the JMS Reporting Provider Store ............................................ 12-6 12.3.1 Configuring the Reporting Data Source for Transactions.......................................... 12-6 12.3.2 Creating a Database for the JMS Reporting Provider Store ....................................... 12-6 12.4 Enabling Message Reports ......................................................................................................... 12-7 12.5 Working With Message Reports................................................................................................ 12-7 12.5.1 Searching for Message Reports ...................................................................................... 12-7 12.5.2 Viewing Message Report Details ................................................................................... 12-8 12.5.3 About Purging Message Reports from the Reporting Data Store ........................... 12-10 12.5.4 Purging Message Reports from the Reporting Data Store ....................................... 12-10 12.6 Stopping a Reporting Provider................................................................................................ 12-11 12.7 Starting a Reporting Provider .................................................................................................. 12-11 12.8 Untargeting a JMS Reporting Provider .................................................................................. 12-12 12.9 13 11.3.2 12.8.1 Untargeting the Default JMS Reporting Provider During Domain Creation........ 12-12 12.8.2 Untargeting the JMS Reporting Provider when the Server is Running ................. 12-12 12.8.3 Untargeting the JMS Reporting Provider When the Server in Not Running ........ 12-13 Using Oracle Advanced Queueing JMS ................................................................................. 12-14 Monitoring and Managing Security Policies 13.1 Introduction to Security Policies................................................................................................ 13-1 13.2 Configuring Global Policies ....................................................................................................... 13-1 13.2.1 viii How to Create a Global Policy Set ................................................................................. 13-2 13.3 13.4 14 How to Enable a Service for Global Policies ................................................................ 13-2 13.2.3 How to Disable a Service for Global Policies ............................................................... 13-2 Monitoring Security Policies ...................................................................................................... 13-3 13.3.1 Viewing the Policies Attached to a Service .................................................................. 13-3 13.3.2 Monitoring Policy Usage................................................................................................. 13-4 13.3.3 Viewing Policy Violations............................................................................................... 13-5 Managing Security Policies ........................................................................................................ 13-5 13.4.1 Attaching Security Policies Directly to a Service ......................................................... 13-5 13.4.2 Detaching Policies from a Service .................................................................................. 13-6 13.4.3 Overriding Security Policies ........................................................................................... 13-7 Monitoring and Managing Endpoint URIs for Business Services 14.1 15 13.2.2 About Endpoint URI Management ........................................................................................... 14-1 14.1.1 About Endpoint URIs ...................................................................................................... 14-1 14.1.2 Offline and Online Endpoint URIs ................................................................................ 14-2 14.1.3 Metrics for Monitoring Endpoint URIs ......................................................................... 14-3 14.2 Configuring Service Bus to Take Unresponsive Endpoint URIs Offline............................. 14-5 14.3 Marking an Endpoint URI Offline Manually .......................................................................... 14-6 14.4 Marking an Offline URI as Online ............................................................................................ 14-6 14.5 Viewing Endpoint URI Metrics for a Business Service .......................................................... 14-7 14.6 Creating Alerts Based on Endpoint URI Metrics .................................................................... 14-7 14.6.1 About Creating an SLA Alert Based on Endpoint URI Status................................... 14-7 14.6.2 Creating an SLA Alert Based on Endpoint URI Status ............................................... 14-8 14.6.3 Configuring an Alert Rule Based on Endpoint URI Statistics ................................... 14-9 Configuring Business Services for Message Throttling 15.1 Introduction to Throttling .......................................................................................................... 15-1 15.1.1 Throttling Concepts ......................................................................................................... 15-1 15.1.2 Throttling Properties........................................................................................................ 15-2 15.1.3 Throttling Groups............................................................................................................. 15-2 15.1.4 Throttling Group Properties and Business Service Throttling Properties ............... 15-3 15.1.5 Throttling for Business Services with Multiple Endpoint URIs ................................ 15-3 15.1.6 Throttling Retried Messages ........................................................................................... 15-4 15.1.7 Throttling and Work Managers...................................................................................... 15-4 15.2 Throttling in a Cluster................................................................................................................. 15-4 15.3 Throttling Metrics ........................................................................................................................ 15-4 15.3.1 15.4 15.5 Using Throttling Metrics to Define Alerts .................................................................... 15-4 Configuring Throttling for a Single Business Service ............................................................ 15-5 15.4.1 Configuring Throttling for a Single Business Service ................................................. 15-5 15.4.2 Disabling Throttling for a Single Business Service...................................................... 15-5 Configuring Throttling for a Group of Business Services ..................................................... 15-6 15.5.1 Creating Throttling Groups ............................................................................................ 15-6 15.5.2 Associating Business Services with a Throttling Group............................................. 15-7 ix 16 16.2 16.3 Part V About the Resequencer Database Tables ................................................................................. 16-1 16.1.1 Database Table Purge Scripts ......................................................................................... 16-1 16.1.2 Automatic Purging of Completed Resequencer Messages ........................................ 16-1 16.1.3 The Datasource for Resequencing.................................................................................. 16-2 16.1.4 Purge Scripts and Resequenced Message Purge States ............................................. 16-2 Purging Oracle Service Bus Resequencer Data ....................................................................... 16-3 16.2.1 Configuring the Resequencer to Automatically Purge Completed Messages ........ 16-3 16.2.2 Using SQL Scripts to Purge Resequencer Tables ........................................................ 16-4 Reconfiguring an Active Resequencer is not Supported ....................................................... 16-6 Troubleshooting Oracle Service Bus Services 17.1 Introduction to Execution Tracing ............................................................................................ 17-1 17.2 Enabling and Disabling Execution Tracing.............................................................................. 17-1 17.2.1 Setting Oracle WebLogic Server Log Levels ................................................................ 17-1 17.2.2 Configuring Execution Tracing for a Single Service ................................................... 17-2 17.2.3 Configuring Execution Tracing for Multiple Services ................................................ 17-2 Accessing Execution Tracing Information ............................................................................... 17-2 Using the Diagnostic Frameworks to Diagnose Problems 18.1 18.2 x Deleting a Throttling Group ........................................................................................... 15-8 Using Execution Tracing to Diagnose Problems 17.3 18 Editing Throttling Groups .............................................................................................. 15-7 15.5.4 Managing Resequencer Tables 16.1 17 15.5.3 Understanding Diagnostics for Oracle Service Bus................................................................ 18-1 18.1.1 Oracle WebLogic Diagnostic Framework..................................................................... 18-1 18.1.2 Oracle Fusion Middleware Diagnostic Framework .................................................... 18-2 18.1.3 About the Automatic Diagnostic Repository ............................................................... 18-3 18.1.4 Predefined Incident Processing Rules ........................................................................... 18-3 18.1.5 Dynamic Monitoring Service Metrics............................................................................ 18-3 Working with Oracle Service Bus Diagnostic Dumps............................................................ 18-5 18.2.1 Listing the Available Diagnostic Dumps ...................................................................... 18-5 18.2.2 Derived Resource Caches Diagnostic Dumps (OSB.derived-caches)....................... 18-6 18.2.3 Running a JMS Correlation Table Diagnostic Dump (OSB.jms-async-table) .......... 18-9 18.2.4 Running an MQ Correlation Table Diagnostic Dump (OSB.mq-async-table) ...... 18-10 18.3 Generating Diagnostic Dumps Using RDA ........................................................................... 18-11 18.4 Viewing Incident Packages with ADR Tools......................................................................... 18-11 18.5 Querying Problems and Incidents........................................................................................... 18-12 Part VI A Appendixes JMX Monitoring API A.1 Introduction to the JMX Monitoring API.................................................................................... A-1 A.2 Using the JMX Monitoring API .................................................................................................... A-1 A.3 A.2.1 Public POJO Objects............................................................................................................ A-2 A.2.2 ServiceDomainMBean ........................................................................................................ A-3 A.2.3 MonitoringConfigurationMBean ...................................................................................... A-3 A.2.4 Statistics Collected for Oracle Service Bus....................................................................... A-3 A.2.5 Caveats.................................................................................................................................. A-7 A.2.6 Performance ......................................................................................................................... A-7 API Usage Example........................................................................................................................ A-7 A.3.1 B Using the Oracle Service Bus Deployment APIs B.1 Deployment MBean Overview...................................................................................................... B-1 B.2 Managing Sessions Using Programs and Scripts ....................................................................... B-1 B.2.1 B.3 C D Sample Program .................................................................................................................. A-8 Creating, Activating, Discarding, and Locating Sessions .............................................. B-2 Managing Configuration Tasks Using Programs and Scripts .................................................. B-2 B.3.1 Importing, Exporting, and Querying Configurations ................................................... B-3 B.3.2 Updating Environment-Specific Information.................................................................. B-3 Auditing Your Oracle Service Bus System C.1 Auditing the Configuration Changes .......................................................................................... C-1 C.2 Creating an Audit Trail for a Message Flow............................................................................... C-1 C.3 Auditing Security Violations......................................................................................................... C-1 Interoperability with WSRP D.1 WSRP Producers and Consumers ................................................................................................ D-1 D.2 WSRP Architecture......................................................................................................................... D-1 D.2.1 D.3 D.4 Enhanced Architecture with Oracle Service Bus ............................................................ D-2 WSRP Design Concepts ................................................................................................................. D-3 D.3.1 WSRP WSDL Documents................................................................................................... D-3 D.3.2 WSRP Messages................................................................................................................... D-4 Configuring Oracle Service Bus for WSRP ................................................................................. D-4 D.4.1 Getting the Producer WSDL Document .......................................................................... D-4 D.4.2 Using SSL with WSRP Producers ..................................................................................... D-4 D.4.3 Routing Messages Between Consumer and Producer................................................... D-5 D.4.4 Monitoring WSRP Applications........................................................................................ D-5 D.4.5 Load Balancing and Failover ............................................................................................. D-5 xi E Role-Based Access in Oracle Service Bus E.1 E.2 E.3 xii Application Security Roles............................................................................................................. E-1 E.1.1 Application Role-Based Access in Oracle Service Bus Console .................................... E-1 E.1.2 Application Role-Based Access in Fusion Middleware Control................................... E-4 Enterprise Security Roles ............................................................................................................... E-5 E.2.1 Enterprise Role-Based Access in Oracle Service Bus Console....................................... E-5 E.2.2 Enterprise Role-Based Access in Fusion Middleware Control...................................... E-7 Role-Based Security Configuration Access.................................................................................. E-8 List of Tables 1-1 1-2 1-3 1-4 2-1 4-1 4-2 4-3 5-1 7-1 7-2 7-3 7-4 8-1 9-1 9-2 11-1 14-1 18-1 18-2 18-3 18-4 18-5 18-6 A-1 A-2 A-3 A-4 B-1 D-1 E-1 E-2 E-3 E-4 E-5 E-6 E-7 E-8 E-9 Supported Standards and Implementations............................................................................ 1-1 Oracle WebLogic Family Platforms.......................................................................................... 1-3 Oracle Family Platforms............................................................................................................. 1-3 Third-Party Platforms................................................................................................................. 1-4 Sample Interval.......................................................................................................................... 2-12 Count Statistic Details................................................................................................................. 4-4 Maximum, Minimum, and Average Statistic Details............................................................. 4-5 Status Statistic Details................................................................................................................. 4-5 Oracle Service Bus Service Metrics........................................................................................... 5-2 Service Bus Standard Loggers................................................................................................... 7-7 Service Bus Debug Loggers in 11g and 12c............................................................................. 7-8 Mapping of 11g Log Levels to 12c.......................................................................................... 7-11 Message Format Mapping to ODL......................................................................................... 7-12 Operational Settings at the Global Level............................................................................... 8-10 Environment Values for Resources........................................................................................... 9-9 Environment Values for Operational Settings...................................................................... 9-14 Oracle Service Bus 11g Groups............................................................................................... 11-4 Status of Endpoint URIs........................................................................................................... 14-4 Service Bus Sensors................................................................................................................... 18-4 Service Bus Diagnostic Dumps................................................................................................ 18-5 JMS Correction Table Diagnostic Dumps.............................................................................. 18-6 Oracle Service Bus Derived Resource Caches....................................................................... 18-6 JMS Correlation Table Diagnostic Dumps............................................................................. 18-9 MQ Correlation Table Diagnostic Dumps........................................................................... 18-10 SERVICE Statistics...................................................................................................................... A-3 FLOW_COMPONENT Statistics.............................................................................................. A-6 WEBSERVICE_OPERATION Statistics................................................................................... A-6 Statistics for Endpoint URI ....................................................................................................... A-7 Session Management Methods.................................................................................................. B-2 Producer Services........................................................................................................................ D-3 Application Role-Based Access to Resources.......................................................................... E-1 Application Role-Based Access to Administration Functions.............................................. E-3 Application Role-Based Access to Session Management...................................................... E-3 Application Role-Based Access in Fusion Middleware Control.......................................... E-4 Enterprise Role-Based Access to Resource Actions............................................................... E-5 Enterprise Role-Based Access to Administration Functions................................................ E-6 Enterprise Role-Based Access to Session Management......................................................... E-7 Enterprise Role-Based Monitoring and Management Access.............................................. E-7 Role-Based Security Configuration Access............................................................................. E-8 xiii xiv Preface This preface describes the document accessibility features and conventions of this guide--Administering Oracle Service Bus. Documentation Accessibility For information about Oracle's commitment to accessibility, visit the Oracle Accessibility Program website at http://www.oracle.com/pls/topic/lookup? ctx=acc&id=docacc. Access to Oracle Support Oracle customers that have purchased support have access to electronic support through My Oracle Support. For information, visit http://www.oracle.com/pls/ topic/lookup?ctx=acc&id=info or visit http://www.oracle.com/pls/ topic/lookup?ctx=acc&id=trs if you are hearing impaired. Conventions The following text conventions are used in this document: Convention Meaning boldface Boldface type indicates graphical user interface elements associated with an action, or terms defined in text or the glossary. italic Italic type indicates book titles, emphasis, or placeholder variables for which you supply particular values. monospace Monospace type indicates commands within a paragraph, URLs, code in examples, text that appears on the screen, or text that you enter. xv What's New in This Guide This preface introduces the new and changed features of Oracle Service Bus and other significant changes that are described in this guide, and provides pointers to additional information. This document is the new edition of the formerly titled Oracle Fusion Middleware Administrator's Guide for Oracle Service Bus. For a list of known issues (release notes), see the Known Issues for Oracle SOA Products at http://www.oracle.com/technetwork/middleware/docs/soaaiafp-knownissuesindex-364630.html. New and Changed Features for 12c (12.2.1) For Oracle SOA Suite 12c (12.2.1), this guide has been updated to include the following new and changed administration features: • Support for Automatic Service Migration in a clustered environment. See Automatic Service Migration. Note: This SOA Suite feature is part of Oracle Integration Continuous Availability. Please refer to the Oracle Fusion Middleware Licensing Information User Manual for more details on Oracle SOA Suite for Middleware Options. • Support for the JavaScript timeout operational setting. See JavaScript Timeout. Significant Documentation Changes for 12c (12.2.1) For this release, the screenshots in this guide were updated to reflect the new user interface. Tasks affected by the user interface change were also updated. The Interoperability, Compatibility, and System Support chapter was updated to list the supported standards, technologies, and products that Service Bus supports in the 12c (12.2.1) release. xvii Part I Learning about Oracle Service Bus Administration This part includes background information and instructions you need to get started with Service Bus administration tasks. This part contains the following chapters: • Interoperability, Compatibility, and System Support • Introduction to Oracle Service Bus Administration • Getting Started with Oracle Service Bus Administration 1 Interoperability, Compatibility, and System Support This chapter lists products, standards, and technologies supported by Oracle Service Bus, including Oracle and third-party products, protocols, and web services standards. This chapter includes information about Oracle Service Bus interoperability. It includes the following topics: • Supported System Configurations • Interoperability and Compatibility with Oracle Products • Supported Standards and Implementations • Interoperability and Support Limitations 1.1 Supported System Configurations For support information on vendor operating systems, JDK, hardware, and databases, see Oracle Fusion Middleware Supported System Configurations at http:// www.oracle.com/technetwork/middleware/ias/downloads/fusioncertification-100350.html. 1.2 Interoperability and Compatibility with Oracle Products For interoperability and compatibility information for Oracle products and versions, see the Understanding Interoperability and Compatibility. This guide helps you understand how Oracle components work together depending on whether they are the same or different versions. It also guides you through the support matrixes. 1.3 Supported Standards and Implementations Oracle Service Bus supports the following standards and implementations. Table 1-1 Supported Standards and Implementations Standard/ Implementation Version Email Servers • Microsoft Windows IIS SMTP Server • Sol/Apache SMTP Server FTP Servers • Microsoft Windows IIS FTP Server • Sol/Apache FTP Server • ProFTPD Server Interoperability, Compatibility, and System Support 1-1 Supported Standards and Implementations Standard/ Implementation Version Web Services • • • • • • • • • • • • WSDL 1.1 SOAP 1.1 and 1.2 SOAP with Attachments (SwA) SOAP Message Transmission Optimization Mechanism (MTOM) with XML-binary Optimized Packaging (XOP) Universal Description, Discovery, and Integration version 3 (UDDI v3) WS-ReliableMessaging 1.0, 1.1, and 1.2 WS-Addressing 1.0 WS-AT 1.0, 1.1, and 1.2 XACML 2.0 WS-Inspection Web Services Interoperability Basic Profile (WS-I BP) 1.1 Web Services Interoperability Basic Security Profile (WS-I BSP) 1.0 Security • Oracle Web Services Manager (OWSM) • Oracle Platform Security Services (OPSS) Login Modules EJB • 2.1 • 3.0 SNMP • SNMPv1 • SNMPv2c WebLogic JMS WebLogic Server • • • • • • 8.1 SP4-SP6 9.0, 9.1, 9.2 10.0 10.3.x 12.1.3 12.2.1 Third-party JMS Any JMS provider that implements the JMS specification is supported through Oracle WebLogic Server as a foreign JMS provider. Microsoft .NET 1.1 with SOAP 1.1 Style-encoding: document-literal, rpc-encoded • Oracle Service Bus supports document-literal and interoperates with .NET services. • Oracle Service Bus interoperates with .NET rpc-encoded services in cases of inbound and outbound (routing/publish). In these cases, interoperability is possible regardless of parameter types. • Oracle Service Bus Service Callouts may fail to interoperate with .NET rpc-encoded services. Note: DIME attachments are not supported by Oracle Service Bus. See also .NET Interoperability Limitations. Microsoft .NET 2.0 with SOAP 1.1 and SOAP 1.2 1-2 Administering Oracle Service Bus 2.0, 3.0, and 3.5 with SOAP 1.1 and SOAP 1.2 See .NET Interoperability Limitations. Supported Standards and Implementations Standard/ Implementation Version WebLogic JMS Client for Microsoft .Net (for .Net C# client applications) See Developing JMS .NET Client Applications for Oracle WebLogic Server. Oracle Service Bus interoperates with the platforms described in the following tables. Table 1-2 Oracle WebLogic Family Platforms Interoperability Version WS-* and JMS interoperability with WebLogic Platform • • • • • • 8.1 SP4-SP6 (except WS-Security) 9.0, 9.1, 9.2 (except WS-Security) 10.0 (except WS-Security) 10.3.x 12.1.3 12.2.1 Web Services for Remote Portlets (WSRP) with Oracle WebLogic Portal • • • • 9.2 10.0 10.2 10.3.x Oracle WebLogic Portal • • • • • 8.1 SP6 9.2 10.0 10.2 10.3 Table 1-3 Oracle Family Platforms Interoperability Version Oracle Service Bus • • • • • Oracle Service Registry 11.1.1.6 Oracle Web Services Manager • • • • Oracle BPEL Process Manager • 10.1.3.4.x and later Oracle JDeveloper • 12.1.3 • 12.2.1 Oracle JCA Adapters • 12.1.3 • 12.2.1 Oracle Data Service Integrator • 12.1.3 • 12.2.1 3.0 10.3 and 10.3.1 11.1.1.3 and later 12.1.3 12.2.1 10.1.3.x and later 11.1.1 12.1.3 12.2.1 Interoperability, Compatibility, and System Support 1-3 Interoperability and Support Limitations Interoperability Version Oracle Tuxedo/WebLogic Tuxedo Connector • 12.1.1 • 12.1.3 Table 1-4 Third-Party Platforms Interoperability Version IBM WebSphere MQ • 7.5 Supported with SOAP 1.1, not SOAP 1.2. See WebSphere Interoperability Limitations. IBM WebSphere EJB/RMI 6.0 IBM WebSphere WS 6.1 (Fixpack 15) Supported with SOAP 1.1, not SOAP 1.2. See WebSphere Interoperability Limitations. JBoss Application Server • • • • 4.x 5.x 6.x 7.x Tibco Enterprise Message Service All versions that meet the JMS 1.2 specification through Oracle WebLogic Server Apache Axis • 1.2.1 • 1.4.1 Supported with SOAP 1.1, not SOAP 1.2. See Apache Axis Interoperability Limitations. BMC Patrol http://www.softwareinnovations.co.uk/products/ patrol.html 1.4 Interoperability and Support Limitations This section describes interoperability limitations with different platforms. • .NET Interoperability Limitations • Apache Axis Interoperability Limitations • WebSphere Interoperability Limitations 1.4.1 .NET Interoperability Limitations • .NET clients that need to communicate with Oracle Service Bus using basic authentication must send the authentication information in the first request. Otherwise, the invocation fails because Oracle Service Bus does not challenge the .NET client for credentials. • Oracle Service Bus interoperability with .NET using Basic Authentication works successfully when configured with Windows 2003/IIS 6.0; however, interoperability with .NET using Basic Authentication on Windows XP/IIS 5.1 is not supported. 1-4 Administering Oracle Service Bus Interoperability and Support Limitations • Message-level security interoperability for .NET clients works only with SOAP 1.1. The WSE Soap Protocol Factory does not support security with SOAP 1.2. See "Message-Level Security with .Net 2.0" in Developing Services with Oracle Service Bus. The following security configurations in the .NET 1.1 framework are not interoperable with the Oracle Service Bus message-level security: • Signing the message body from WebLogic to .NET WSE 2.0 (Webservices Security Extension) is interoperable. However, by default, WSE requires additional headersfor example, WS-Addressing and timestamp. Therefore, to make Oracle Service Bus message-level security for .NET web services interoperable, you must remove all of the message predicate other than the message body from .NET security policy configuration • To ensure Oracle Service Bus interoperability with .NET, the replay detection attribute, <replayDetection>, must be set to disabled on the .NET side. 1.4.2 Apache Axis Interoperability Limitations This section describes issues that arise when working with Apache Axis, and also provides ways to address the issues. • Unresolved References When Importing RPC-Encoded Axis-Generated WSDL Documents • SOAPAction attribute in Axis-generated WSDL files initialized to empty string • HTTP Response and Status Code for One-Way Operations • HTTP Response and Status Code for One-Way Operations Generate a Fault 1.4.2.1 Unresolved References When Importing RPC-Encoded Axis-Generated WSDL Documents When you import an RPC encoded WSDL file, generated by Axis, into Oracle Service Bus, you may experience a warning message indicating that the WSDL file contains references that must be resolved. To work around this issue, open the structural view of the imported WSDL file in the View a WSDL page in the Oracle Service Bus Administration Console to view unresolved schema imports. They appear in the Imports section. Note that this issue does not affect your ability to use the WSDL file in the Oracle Service Bus environment. You can eliminate the warning by removing unresolved schemas from the WSDL file. 1.4.2.2 SOAPAction attribute in Axis-generated WSDL files initialized to empty string The WSDL file generated by Axis have the SOAPAction attribute initialized to an empty string. Configuring an Oracle Service Bus business service with this WSDL file, causes invocations to this web service to fail generating a "No SOAPAction" fault. To work around the issue and ensure successful web service invocations from Oracle Service Bus to Axis, configure a transport header in the pipeline. Add a Set Transport Headers request action in the message flow route and enable the Pass all headers through Pipeline option. This issue also causes invocations from the Oracle Service Bus Test Console to fail (and generates a "No SOAPAction" fault) even when the workaround is in place. To make Interoperability, Compatibility, and System Support 1-5 Interoperability and Support Limitations Test Console invocations work, set the SOAPAction HTTP header in the Set Transport Header request action in the message flow route. 1.4.2.3 HTTP Response and Status Code for One-Way Operations For both document literal and RPC encoded types of web services, on invocation of a one-way operation, Axis is expected to send an empty HTTP response with status code 202 OK to the client. However, Axis sends an non-empty HTTP response with status code 200 OK. The body of this HTTP response contains an empty SOAP envelope. This causes the Oracle Service Bus proxy or business service to send the same 200 OK response code to their clients violating the expected results. 1.4.2.4 HTTP Response and Status Code for One-Way Operations Generate a Fault For both document literal and RPC encoded types of web services, on invocation of a one-way operation generating a fault, Axis is expected to send an empty HTTP response with status code 202 OK to the client. However, Axis sends a non-empty HTTP response with status code 500 Internal Server Error with an empty SOAP envelope as a body. This causes the Oracle Service Bus proxy or business service to send the same 500 Internal Server Error response to their clients violating the expected results. 1.4.3 WebSphere Interoperability Limitations For both document literal and RPC encoded types of web services, on invocation of a one-way operation, WebSphere is expected to send an empty HTTP response with status code 202 OK to the client. However, WebSphere sends an non-empty HTTP response with status code 200 OK. The body of this HTTP response contains an empty SOAP envelope. This causes the Oracle Service Bus proxy or business service to send the same 200 OK response code to their clients violating the expected results. 1-6 Administering Oracle Service Bus 2 Introduction to Oracle Service Bus Administration This chapter gives an overview of Oracle Fusion Middleware, Oracle Service Bus, and the types of administration tasks you perform from Oracle Enterprise Manager Fusion Middleware Control and from the Oracle Service Bus Console. This chapter includes the following topics: • Oracle Fusion Middleware Overview • Oracle Service Bus Overview • Oracle Service Bus Runtime Monitoring • Oracle Service Bus Runtime Management • Oracle Service Bus Runtime Security • Introduction to Aggregation Intervals • Server Monitoring and Management • Oracle Service Bus and Oracle Enterprise Scheduler 2.1 Oracle Fusion Middleware Overview Oracle Fusion Middleware is a collection of standards-based software products that spans a range of tools and services: from Java EE and developer tools, to integration services, business intelligence, and collaboration. Oracle Fusion Middleware offers complete support for development, deployment, and management of applications. Oracle Fusion Middleware components are monitored at runtime using Oracle Enterprise Manager Fusion Middleware Control Console. 2.2 Oracle Service Bus Overview Oracle Service Bus is a component of Oracle Fusion Middleware that provides standards-based integration for high-volume SOA environments. Service Bus is a core component in Oracle SOA Suite, acting as a back-bone for SOA messaging. Service Bus connects, mediates, and manages interactions between heterogeneous services, legacy applications, packaged applications, and multiple enterprise service bus (ESB) instances across an enterprise-wide service network. Service Bus adheres to the SOA principles of building coarse-grained, loosely coupled, and standards-based services, creating a neutral container in which business functions can connect service consumers and back-end business services, regardless of underlying infrastructure. Introduction to Oracle Service Bus Administration 2-1 Oracle Service Bus Overview 2.2.1 Introduction to Service Monitoring and Management Service Bus includes a powerful set of runtime tools for monitoring, alerting, reporting, configuration, and management. The Service Bus monitoring framework provides access to server statistics, such as the number of messages that were processed successfully or that failed, the average execution time of message processing, the number of errors and alerts generated, and the average response time. Using Fusion Middleware Control, you can view monitoring statistics for the period of the current aggregation interval or for the period since you last reset statistics for this service or since you last reset statistics for all services. Using the public APIs you can access only the statistics since the last reset. 2.2.1.1 Administration Consoles Service Bus is fully integrated with Fusion Middleware Control for SOA-wide management. Most monitoring and management tasks for Service Bus services are performed using Fusion Middleware Control, though certain administration tasks require the Oracle Service Bus Console. In Fusion Middleware Control, Service Bus provides operational functions and settings that allow you to monitor SLA alerts, pipeline alerts, logs, reports, and policy usage by providing a cluster-wide view of service status and statistics. The framework monitors business services, proxy services, pipelines, and split-joins, including response times, message counts, error counts, and security policy usage and violations. Using Fusion Middleware Control, you can also turn tracing on and off, enable and disable services, update logging and alert levels, and recover from resequencing faults. Service-level flags and global flags help control monitoring, alerting, reporting, and logging. The Oracle Service Bus Console provides configuration tools for creating service level agreement alerts, pipeline alerts, messaging reporting actions, alert destinations, and throttling groups for business service endpoints. Using the console, you can also update environmental values, either individually or in bulk. 2.2.1.2 Auditing Capabilities Service Bus provides the following capabilities for auditing and monitoring services: • Gathers statistics about message invocations, errors, performance characteristics, messages passed and SLA violations. • Sends SLA-based alerts as SNMP traps, enabling integration with third-party ESM solutions. • Logs selected parts of messages for both systems operations and business auditing purposes. • Provides search capabilities by extracting key information from a message and use as it as a search index. 2.2.2 Introduction to the Oracle Service Bus Monitoring Framework The monitoring framework monitors the operational resources, servers, and service level agreements (SLAs) for Service Bus.Figure 2-1 illustrates of the architecture of the monitoring framework. 2-2 Administering Oracle Service Bus Oracle Service Bus Overview Figure 2-1 Monitoring Framework in Oracle Service Bus The Service Bus monitoring architecture consists of the following components: • Collector: Each Managed Server in a cluster hosts a Collector. The Collector collects statistics on operational resources at regular intervals of time, which is managed in a RMI object. It also keeps a history within the aggregation interval for the collected statistics. The Service Bus runtime invokes a collector at the beginning of each minute. At every system-defined checkpoint interval, it stores a snapshot of current statistics into a persistent store for recovery purposes and sends the information to the Aggregator in raw format, as raw format is optimized for fast collection and small footprint. Note: An operational resource is defined as the unit for which statistical information can be collected by the monitoring subsystem. Operational resources include proxy services, business services, pipeline components, split-join components, service-level resources such as Web Services Definition Language (WSDL) operations, and endpoint URIs. • Aggregator: The Aggregator is present only on one Managed Server. The server on which this resides is selected arbitrarily when you generate a domain using the Introduction to Oracle Service Bus Administration 2-3 Oracle Service Bus Runtime Monitoring configuration wizard. It aggregates all the statistics that are collected from all Managed Servers across all Managed Servers in a cluster. The Service Bus runtime invokes the aggregator twenty-five seconds past each minute, to enable collectors to collect data and send it to the aggregator. At systemdefined checkpoint intervals, each Managed Server in the cluster sends a snapshot of its contributions to the Aggregator. Data structures in aggregator are optimized for aggregating and retrieving data. • Retriever: The Retriever retrieves the statistics that are stored in the memory. This is present only in the Managed Server that contains the aggregator. • Alert Manager: The alert manager fires alerts based on the aggregated statistics. This is present only in the Managed Server that contains the aggregator. The Collector collects the updated statistics from the Service Bus runtime and sends it to the Aggregator, which then aggregates the statistics over the aggregation interval. Those statistics then are pushed to the Alert Manager, which triggers alerts based on the statistics. The aggregated statistics are also stored and can be retrieved by the Retriever. 2.2.3 Accessing Statistics Using the JMX API You can access the statistical information for a service through Fusion Middleware Control or directly by using the Java Management Extensions (JMX) monitoring APIs. Using the JMX monitoring APIs only allows access to the running count statistics. The JMX monitoring APIs provide efficient lower-level support for bulk operations. For more information about using JMX monitoring APIs, see JMX Monitoring API. 2.2.4 Accessing Statistics in a Cluster In a clustered environment, all the statistics collected on the Managed Servers are pushed to the aggregator. Statistics are available at individual Managed Server level and the cluster level. On the Service Health page, you can choose Cluster or the name of a Managed Server from the Server list to view statistics for the cluster or the individual Managed Server. 2.3 Oracle Service Bus Runtime Monitoring Service Bus lets you monitor and collect runtime information required for system operations by aggregating runtime statistics. Administrators can view the statistics in real-time to monitor system operational health and to flag problems in messaging services. This allows quick isolation and diagnosis of problems as they occur. In addition, you can configure service level agreement (SLA) alerts, pipeline alerts, and message reporting to trigger alerts or event logs under the conditions you define. Fusion Middleware Control provides configuration tools for loggers and log levels, as well as the ability to view log entries directly in the console. The following sections describe the monitoring features of Service Bus. 2.3.1 Service Health Monitoring Information about system operational health can be viewed at the server, project, and individual service level. The Service Bus domain and Service Bus Project Service Health pages display statistics aggregated for each service in either the domain or project. Individual service dashboards also display performance statistics at an operational level for more granular analysis. For pipelines and split-joins, performance statistics can be gathered for components in the message flow. 2-4 Administering Oracle Service Bus Oracle Service Bus Runtime Monitoring Statistics are collected for all Service Bus services. The monitoring system supports the following types of statistics: • Counter: A counter keeps track of the count of events in the runtime such as the number of messages received, errors generated, and failovers. This is scalar and takes on integral values. • Interval: An interval keeps track of the time elapsed between two well-defined events. This tracks the total, average, minimum, and maximum of such events in the runtime. This takes on integral and non-integral values. • Status Type: A status statistic keeps track of a service's status. Using this you can keep track of the initial status and the current status of the object. For more information about different types of statistics collected, see Using the JMX Monitoring API. For information about monitoring service health, see Monitoring Oracle Service Bus Service Health. 2.3.1.1 Metric Aggregation The displayed health statistics are based on an asynchronous aggregation of data collected during system operation. In a production cluster domain, the data aggregator runs as a singleton service on one of the Managed Servers in the cluster. Server-specific data aggregation is performed on each of the Managed Servers in the domain. The aggregator is responsible for the collection and aggregation of data from all the Managed Servers at regular, configurable intervals. These metrics are aggregated across the cluster for the configured aggregation interval and displayed on the Service Bus pages in Fusion Middleware Control. 2.3.1.2 Monitoring a Service that was Renamed or Moved When you rename or move a service, all the monitoring statistics that have been collected are lost. All current aggregation interval and cumulative metrics are reset and the service is monitored from start. If the endpoint URI for a service was marked offline before it was renamed or moved, the URIs are marked online again and the status of the URI is displayed as online after you complete renaming or moving the service. 2.3.2 SLA and Pipeline Alert Monitoring Service level agreement (SLA) alerts and pipeline alerts are configured for specific services in order to generate information about how messages are being processed through those services. SLA alerts are raised to indicate potential violations of service level agreements. The following are some common uses for SLA alerts: • Monitoring and generating e-mail notification of WS-Security errors. • Monitoring the number of messages passing through a particular pipeline. • Detecting the violation of service level agreements with third-party products. • Detecting a non-responsive endpoint. Pipeline alerts are defined directly in a pipeline using an alert action. Pipeline alerts are generally used to detect errors in a message flow or to indicate a business event. For more information about creating and monitoring alerts, see Monitoring Oracle Service Bus Alerts. Introduction to Oracle Service Bus Administration 2-5 Oracle Service Bus Runtime Monitoring 2.3.2.1 SLA Alerts Overview Service Level Agreements (SLAs) define the precise level of service expected from the services in Service Bus. SLA alerts are automated responses to violations of SLA rules and conditions. Service Bus runs SLA rules against aggregated monitoring statistics and raises alerts when rule violations are found. After monitoring those alerts, you can enable or disable services as needed. Administrators can set service level agreements (SLAs) on the following conditions: • Message processing times. • Message processing volume. • Number of errors, security violations, and validation errors. • Failure and success ratios. • For business services only, endpoint URI status. The Service Bus Dashboard and Alert History page in Fusion Middleware Control both display SLA alerts. When an SLA alert is raised, Service Bus also sends a notification to the alert destinations defined for that alert rule. In order for Service Bus to raise SLA alerts, SLA alerting must be enabled at both the service level and the global level. The Oracle Service Bus Console provides editors to create SLA alert rules and to define the conditions under which an alert is raised. Alert rules specify unacceptable service performance according to your business and performance requirements. Each alert rule allows you to specify the aggregation interval for that rule. This interval is not affected by the aggregation interval set for the service. 2.3.2.2 Pipeline Alerts Overview In addition to SLA alerts, Service Bus also provides alert actions that can be configured within the message flow of a pipeline. Pipeline alerts are generally used for business purposes such as recording the number of messages that flow through the message pipeline, tracking occurrences of certain business events, or reporting errors (though not for the health of the system). Pipeline alert actions generate alerts based on the message context in a pipeline, and can be configured to include an alert name, description (which can include message elements), alert destination, and alert severity. Service Bus generates a pipeline alert when it reaches an alert reporting action in a pipeline and the conditions defined for the action are met. You define the conditions under which a pipeline alert is triggered using the conditional constructs available in the pipeline editor, such as an XQuery expression or an if-then-else construct. When a pipeline alert is raised, Service Bus sends a notification to the alert destinations defined for that alert action. The Service Bus Dashboard and Alert History page in Fusion Middleware Control both display pipeline alerts. You define pipeline alerts using the editors in either Oracle Service Bus Console or JDeveloper. 2.3.3 Resequencing Group Monitoring Service Bus pipelines can be configured to use a resequencer, which re-orders messages that arrive in a random order into a new order based on the type of resequencer used. The Resequence Messages page displays information about the state of resequenced messages so you can monitor and manage the status of resequencers in 2-6 Administering Oracle Service Bus Oracle Service Bus Runtime Monitoring the runtime. You can search for resequencing groups to view based on the group name, the location of the pipeline, or the status of the resequencing group. If you click a group ID in the search results, additional information about the group appears in the Resequencing Group dialog. The information displayed in the group dialog depends on the status of the group. If the group is faulted or timed out, you can recover the faulted message or skip to the next available message. The Resequencing Group dialog provides the following information about a group: • Whether the group is timed-out or faulted. • The blocking message in the group, if any. • The next message to be processed after the group is unlocked. • The time after which the processing of the messages in the group stopped. • The instruction text to unlock the group. When processing of messages in a group is suspended due to a fault or a timeout, the dialog provides information about the suspended group. For more information about monitoring resequenced messages, see Monitoring Resequencing Groups . 2.3.4 Log File Monitoring Service Bus components generate log files containing messages that record all types of events, including startup and shutdown information, errors, warning messages, access information on HTTP requests, and additional information. Service Bus uses Oracle Diagnostic Logging (ODL) to define the standard format, content, and file-handling of diagnostic log files. In addition to logging standard actions, Service Bus adds entries to the diagnostic log file for any pipelines and split-joins that have log actions and that have logging enabled. Administrators can view this information on the Log Messages page of Fusion Middleware Control. Fusion Middleware Control also provides configuration tools, where you can specify the loggers to use and the log level for each logger. For more information about logging, see Configuring and Monitoring Log Files. 2.3.5 Message Reporting Reporting actions configured in a pipeline let you report on message data as messages pass through the pipeline. A reporting action can be placed at any point within a request or response pipeline or an error pipeline stage, and you can specify the information about each message that is written in each report entry generated by the action.You can use reporting actions to filter message information as it flows through the pipeline. The data captured by the report action can then be monitored in Fusion Middleware Control or accessed by a reporting provider. Reporting actions can help you determine whether there is a problem with a message pre- or post-transformation, during routing, and so on. The Message Reports page in Fusion Middleware Control displays information from the reporting data store, including summary information. You can expand summary information to view detailed information about specific messages. Service Bus provides additional tools for message reporting, including a built-in JMS reporting provider and a Java API you can use to create your own reporting provider. The JMS reporting provider picks up reported data and stores it in a message reporting database that acts as the reporting data store. Introduction to Oracle Service Bus Administration 2-7 Oracle Service Bus Runtime Management Use monitoring, SLA alerts, and reporting features in combination to manage the health and availability of the service infrastructure in real time, measure SLA compliance, and report this information efficiently and effectively. For more information about message reporting, see Configuring Reporting for Messages and Alerts. 2.4 Oracle Service Bus Runtime Management In addition to monitoring Service Bus services in the runtime, you can also manage running services. Management tasks include customizing environment values, configuring operational settings, managing endpoint URIs for business services, and importing and exporting services. The following sections describe the management tasks you can perform using Fusion Middleware Control. 2.4.1 Environment Customization Service Bus uses environment variables and values to represent properties in the Service Bus configuration that are likely to change when you move your configuration from one domain to another (for example, from test to production). By representing these properties as environment values, you can modify things like server names, port numbers, directory names, and retry configurations without having to change the value in each Service Bus resource individually. A good example is the URL of a proxy service, which changes depending on the physical location of the domain. Environment values can be found in alert destinations, proxy services, business services, SMTP server and JNDI provider resources, UDDI registry entries, and transports. Service Bus provides two methods to update environment values in a domain. You can either use the Find and Replace dialog on the Oracle Service Bus Console to update environment values or you can create and execute a configuration file that defines the values for each environment value. Using Find and Replace, you can replace entire environment values or just substrings of the values, which is useful for making minor or small changes. Configuration files let you modify all the environment variables directly, find and replace strings or substrings, update operational settings at the global and service levels, and update references between resources. For more information, see Customizing Oracle Service Bus Environments. 2.4.2 Runtime Configuration Operational settings provide control over the state of a service and how it can be monitored in Fusion Middleware Control. Configure operational settings to enable or disable the following features at the service or global level. The operational settings at the service level are overridden by those set at the global level. • A service's state • Monitoring, logging, and reporting • Aggregation interval • SLA and pipeline alerts • Execution and message tracing • Non-responsive endpoints 2-8 Administering Oracle Service Bus Oracle Service Bus Runtime Management • Throttling • Result caching • Resequencer processing In addition, you can restrict concurrent processing of messages, set the maximum number of messages in the throttling queue, and set the maximum length of time a message can stay in the throttling queue. 2.4.3 Business Service Endpoint Management In the runtime, you can monitor metrics for each business service endpoint URI to ensure they are all performing as expected. When you notice issues with an endpoint URI, Service Bus lets you mark a URI endpoint as offline to avoid repeated attempts at accessing the endpoint URI. You can alternatively configure the business service to automatically mark non-responsive URIs as offline. Configuring a business service to mark non-responsive URIs offline prevents a business service from repeatedly attempting to access a non-responsive URI and therefore avoids the communication errors caused by trying to access a nonresponsive URI. Once an endpoint URI is marked offline, Service Bus can bring it back online after a time period you specify, or keep it offline until you change the status manually. For more information about managing endpoint URIs, see Monitoring and Managing Endpoint URIs for Business Services. 2.4.4 Tuning Performance with Endpoint Throttling Service Bus provides the ability to regulate message traffic to a business service or group of business services, giving you control over the load placed on a business service. Throttling helps improve performance and stability by preventing message overload on high-traffic business services. Service Bus uses a throttling queue in which messages are stored once a business service is processing the maximum number of concurrent messages allowed. You configure the number of messages that can be concurrently processed, the maximum number of messages in the queue, and the length of time a message can stay in the queue. Messages are processed from the queue in order of priority, which can be assigned using routing options. You can apply throttling to individual business services or to groups of business services by assigning them to a throttling group. Throttling groups are useful when multiple business services send requests to the same server. By setting up throttling, you can control the flow of messages to that server, ensuring the message volume does not exceed the server's capacity. The configuration of the group applies to all services assigned to the group. For more information, see Configuring Business Services for Message Throttling. 2.4.5 Importing and Exporting Resources The import and export features of Service Bus let you share and update projects and resources between different runtime environments. In Fusion Middleware Control, you can import and export full configuration JAR files or just a subset of the resources included in a JAR file. A configuration JAR file contains projects or resources that were previously exported from a Service Bus instance. Importing configuration files can update or delete existing resources and add new resources to the configuration. Introduction to Oracle Service Bus Administration 2-9 Oracle Service Bus Runtime Security When you import Service Bus resources, you can also import a configuration file that defines environment values specific to the domain in which you are working, as described in Environment Customization. For more information, see Importing and Exporting Oracle Service Bus Resources. 2.4.6 Diagnostics Service Bus leverages Oracle WebLogic Server and Oracle Fusion Middleware diagnostic and reporting tools to help you detect, diagnose, and resolve issues in the runtime. WebLogic Diagnostic Framework (WLDF) captures diagnostic data, and can monitor logs and send notifications when certain conditions are met. The Oracle Fusion Middleware Diagnostic Framework targets critical errors, such as those caused by code bugs, data corruption, deadlocked threads, and inconsistent states. The framework captures dumps of relevant diagnostics, which you can then view and analyze. The Automatic Diagnostic Repository (ADR) stores all diagnostic data, such as traces and dumps, for Oracle Fusion Middleware components. The Oracle Dynamic Monitoring Service (DMS) provide metrics, trace events, and system performance information to administration tools. For information about how these tools work together to provide diagnostic information, see Using the Diagnostic Frameworks to Diagnose Problems. 2.5 Oracle Service Bus Runtime Security Security administration in the runtime includes monitoring policies, policy usage, and policy violations for services. In Fusion Middleware Control, you can also define administrative security by defining authentication and authorization for Service Bus users and service clients. 2.5.1 Working with Security Policies Service Bus uses standard Fusion Middleware Control features to monitor and manage the security policies attached to running business and proxy services. Policies provide a framework to manage and secure those services. Policy monitoring and management include the following tasks: • Attaching and detaching policies from services. • Updating policy overrides. • Attaching policy sets globally. • Monitoring policy usage. • Monitoring policy violations. You can configure policies for individual services in both the Oracle Service Bus Console and in Fusion Middleware Control. For more information, see Monitoring and Managing Security Policies. 2.5.2 Defining Security Administration For authentication and authorization, Service Bus uses Oracle Application Development Framework (ADF) security, which is built on Oracle Platform Security Services (OPSS). Service Bus leverages the security features in Fusion Middleware Control to create users, roles, and groups, and to assign security permissions. Service Bus provides a set of default application roles that you can assign to the users you 2-10 Administering Oracle Service Bus Introduction to Aggregation Intervals create in order to give them a standard set of access permission to Service Bus features, such as creating specific resources, monitoring the runtime, deploying resources, and so on. Inbound transport-level security and message-level security also use Service Bus user, group, and role data to authenticate inbound client requests based on conditions you define. For more information, see Defining Access Security for Oracle Service Bus. 2.6 Introduction to Aggregation Intervals In Service Bus, the monitoring subsystem collects statistics over an aggregation interval, which is the time period over which statistical data is collected and displayed in Fusion Middleware Control. Statistics that are not based on an aggregation interval are meaningless. In addition to statistics collected over a well-defined aggregation interval you can also collect cumulative statistics. 2.6.1 Refresh Rate of Monitored Data The aggregation interval is a moving window, which always refers to an interval of time in minutes, hours or days. It does not move with infinite granularity or precision, but at regular intervals of time called the sampling interval. This enables an aggregation interval to move smoothly and produce accurate statistics. Figure 2-2 Illustration of Aggregation Interval and Sampling Interval Figure 2-2 is an illustration of the of aggregation interval. For example, aggregation interval A1 is set at five minutes and aggregation interval A2 is set at ten minutes. The runtime collects statistics for the service with aggregation interval A1 for every minute (S1). It aggregates the statistics at the end of the aggregation interval. Similarly for aggregation interval A2 it collects statistics for every five minutes (S2). Intervals S1 and S2 are called sampling intervals, described below. 2.6.2 Sampling Intervals Within Aggregation Intervals Service Bus runtime statistics are computed at regular intervals, within every aggregation interval. These regular sub-intervals are known as the sample interval. The duration of the sample interval depends on the aggregation interval. Table 2-1 gives the length of sample interval for different aggregation intervals: Introduction to Oracle Service Bus Administration 2-11 Server Monitoring and Management Table 2-1 Sample Interval Aggregation Interval Sample Interval 1, 2, 3, 4, and 5 minutes 1 minute 10, 15, 20, 25, and 30 minutes 5 minutes 40, 50, and 60 minutes 10 minutes 90 and 120 minutes 30 minutes 3, 4, 5, and 6 hours 1 hour 8, 10, and 12 hours 2 hours 16, 20, and 24 hours 4 hours 2, 3, 4, 5, 6, and 7 days 1 day 2.6.3 Aggregation Interval Properties The aggregation interval has the following properties: • You can track statistics for a service over only one aggregation interval. • You cannot set an arbitrary value for an aggregation interval. You must choose from one of the values in the list. • You can set the aggregation interval for services and for alert rules. • You can only specify an aggregation interval less than or equal to seven days. When you modify the aggregation interval of a service, the statistics of the service in the current aggregation interval are reset. However, the status of the endpoint URI for the service remains unaffected by the change in the aggregation interval. A running count metrics of the service is not reset when you modify the aggregation interval. 2.6.4 Resetting the Statistics When you reset statistics for a service in the Oracle Service Bus Console, all the statistics collected for the service since the last reset are lost. You cannot undo this action. The status of endpoint URIs is not reset when you reset statistics. 2.7 Server Monitoring and Management Fusion Middleware Control displays information about the state of the Service Bus server so you can monitor the health and performance of your Service Bus environment and deployed applications. The console displays information about the state of domains, clusters, administration and managed servers, system components, and applications. You can also start and stop the server from Fusion Middleware Control. For more information, see "Monitoring Oracle Fusion Middleware" in Administering Oracle Fusion Middleware. 2.8 Oracle Service Bus and Oracle Enterprise Scheduler Using Oracle Enterprise Scheduler, you can define, schedule, and run jobs, which are units of work done on an application's behalf. When Oracle Enterprise Scheduler is installed with Service Bus, you can create jobs to perform tasks and define a schedule 2-12 Administering Oracle Service Bus Oracle Service Bus and Oracle Enterprise Scheduler that indicates how often to trigger the scheduler. For example, you can schedule a Service Bus proxy service with a web services interface using Oracle Enterprise Scheduler. In order to use Oracle Enterprise Schedule with Service Bus, the following templates must be deployed on the Service Bus domain: • Oracle Enterprise Scheduler Service Basic • Oracle Enterprise Manager Plugin for ESS You can define jobs in Fusion Middleware Control. For information and instructions, see the following documentation: • "Introduction to Oracle Enterprise Scheduler" in Administering Oracle Enterprise Scheduler • "Managing the Work of Oracle Enterprise Scheduler Jobs" in Administering Oracle Enterprise Scheduler • "Creating a Web Service Job Definition" in Developing Applications for Oracle Enterprise Scheduler Note: When you create a job definition or schedule for a Service Bus proxy service, you must specify /oracle/apps/ess/custom/osb for the Package field. Introduction to Oracle Service Bus Administration 2-13 Oracle Service Bus and Oracle Enterprise Scheduler 2-14 Administering Oracle Service Bus 3 Getting Started with Oracle Service Bus Administration This chapter describes how to log in to and navigate the menus of Fusion Middleware Control to perform Oracle Service Bus configuration, monitoring, and management tasks. It also describes the Service Bus administration pages available in the console. This chapter includes the following sections: • Introduction to the Management and Monitoring Pages • Logging in to Oracle Enterprise Manager Fusion Middleware Control • Navigating to Oracle Service Bus Administration Pages • Navigating to the System MBean Browser • Setting Accessibility Options • Logging out of Oracle Enterprise Manager Fusion Middleware Control • Starting Oracle Service Bus Servers For information about standard Fusion Middleware Control features and tasks, see Administering Oracle Fusion Middleware. 3.1 Introduction to the Management and Monitoring Pages In Fusion Middleware Control, you can monitor and mange Service Bus applications and their lifecycles. You deploy Service Bus applications designed in Oracle JDeveloper or the Oracle Service Bus Console to a Service Bus domain. Fusion Middleware Control accesses the information collected for those deployed applications. Service Bus aggregates runtime statistics, which you can view on the Dashboard, Alert History, and Service Health pages. The Dashboard allows you to monitor the health of the system and notifies you when alerts are generated in your services. With this information, you can quickly and easily isolate and diagnose problems as they occur. Service Bus monitoring and management features are categorized into service-level, project-level, and domain-level information and tasks. The Service Bus domain pages in Fusion Middleware Control display information at the domain-level, and let you set operational settings at both the service and global level. The Service Bus Project pages display the health of all services in a project, and let you set operational settings at the service level. Service component pages display information about the health of the selected service, and let you update operational settings for that service. You can also attach and detach policies and define policy override values for business services and proxy services, as well as manage endpoint URIs for business services. Getting Started with Oracle Service Bus Administration 3-1 Introduction to the Management and Monitoring Pages 3.1.1 Service Bus Domain-Level Monitoring Pages The Service Bus home page lets you perform administration tasks such as monitoring pipeline and SLA alerts, monitoring the health of individual services, viewing faults for resequenced messages, and updating global and operational settings. You can also perform corrective actions such as fault recovery. Fusion Middleware Control displays information for all deployed services, including proxy services, business services, pipelines, and split-joins. The level of information displayed depends on how the operational settings are configured for each service and at the global level. 3.1.1.1 Dashboard (Domain-Level) The Service Bus dashboard displays all the alerts that have been triggered in the Service Bus runtime as a result of SLA violations or pipeline alerts. Service Level Agreements (SLAs) are agreements that define the level of service expected from the business and proxy services in Service Bus. Pipeline alerts are defined in the message flow for business purposes such as recording the number of messages that flow through the message pipeline, tracking occurrences of certain business events, or reporting errors (but not for the health of the system). Each row of the Alert History table displays the information configured for the alert rule, such as the severity, timestamp, and associated service. Clicking the Alert Name link displays an Alert Details dialog for more information about the SLA alert. Clicking the Alert Summary link displays the Alert Details dialog for a pipeline alert. This helps you to analyze the cause of the SLA or pipeline alert. A read-only display of the configuration for the alert rule that generated each alert is also available. The Dashboard lists the Service Bus services with the most alerts and the services with the most errors. If you click an alert or error, additional information appears to help you analyze and fix the cause of the alert or error. For services with errors, the Dashboard displays additional information such as the average response time for a service, the number of messages processed, and the number of errors. The following image shows the Service Bus Dashboard. For more information, see Monitoring Oracle Service Bus Alerts. 3-2 Administering Oracle Service Bus Introduction to the Management and Monitoring Pages Figure 3-1 Service Bus Dashboard Page in Fusion Middleware Control 3.1.1.2 Alert History The Alert History page provides search features, so you can search for alerts based on the alert type, alert rule, or alert severity. You can also search for alerts for specific services or for a specific date range. The information provided on the Alert History page is similar to that provided on the Dashboard; however, the search feature allows you to view only those alerts or services you are interested in. The search results list provides additional links so you can view additional information about the alert, navigate to the Dashboard page for the service for which the alert was generated, and view the alert rule that generated the alert. Use the purge and delete features on the Alert History page to manage the size of the alert store. You can purge all alerts, or just purge those alerts that were generated within a specific time period. The following figure shows the Alert History page. For more information, see Monitoring Oracle Service Bus Alerts. Getting Started with Oracle Service Bus Administration 3-3 Introduction to the Management and Monitoring Pages Figure 3-2 Service Bus Alert History Page 3.1.1.3 Service Health When you display statistics for the current aggregation interval, the Service Bus Service Health page displays a dynamic view of statistical data collected for each deployed service. The display is updated at certain intervals to only display alerts for the aggregation interval. For example, if the aggregation interval of a particular service is twenty minutes, this page displays the data collected in the last twenty minutes for that service. You can search for specific services or groups of services to view. The Services table displays statistics for each service returned for your search, such as the number of alerts, messages, and errors, as well as the average response time. The aggregation interval can be individually configured for services, so the table also displays the aggregation interval for each service. The following figure shows the domain-level Service Health page. For more information, see Monitoring Oracle Service Bus Service Health. 3-4 Administering Oracle Service Bus Introduction to the Management and Monitoring Pages Figure 3-3 Service Health Page 3.1.1.4 Resequence Messages If any of your deployed pipelines use the resequencer to re-order messages, the Resequence Messages page displays information about the state of processing those messages so you can monitor the current health of the resequencing groups. A group can be running, faulted, or completed. The search feature lets you search for messages in specific resequencer groups, for groups in specific states, or for messages associated with a specific service. When message processing is suspended in a resequencing group, you can take steps on the Resequence Messages page to fix, retry, or abort processing the message. The corrective action depends on the type of fault, and might include canceling message processing, skipping a stuck message, or modifying the payload and retrying the message. These can all be performed from the Resequence Messages page. The following figure shows the Resequence Messages page. For more information, see Monitoring Resequencing Groups . Getting Started with Oracle Service Bus Administration 3-5 Introduction to the Management and Monitoring Pages Figure 3-4 Resequence Messages Page 3.1.1.5 Operations The Service Bus Operations page displays the current operational settings for your deployed services. You can update the settings for the listed services, either individually in or bulk. The Service Bus Operations page only includes a subset of the available operational settings, and only allows enabling and disabling settings. You can further configure these settings, and configure additional settings, on a service's own Operations page. The settings you can configure from the Service Bus page include monitoring, alerts, message tracing, execution tracing, alerts, reporting, logging, and business service performance tuning. Certain operational settings are set at the service level, some are set at the global level, and some need to be set at both the service and global level in order to take effect. The Operations page only configures the settings at the service level. The following figure shows the Operations page. For more information, see Configuring Operational and Global Settings. 3-6 Administering Oracle Service Bus Introduction to the Management and Monitoring Pages Figure 3-5 Operations Page 3.1.1.6 Global Settings The Service Bus Global Settings page lets you enable operational settings, such as monitoring, logging, and alerting, on a global scale. You can also configure certain resequencing properties for the runtime. You must enable or disable these settings at the global level in conjunction with the settings at the service level to effectively enable or disable them. The following settings must be enabled at the global level in order to be enabled for a specific service: • Monitoring • SLA Alerting • Pipeline Alerting • Reporting • Logging • Result Caching The following figure shows the Global Settings page. For more information, see Configuring Operational and Global Settings. Getting Started with Oracle Service Bus Administration 3-7 Introduction to the Management and Monitoring Pages Figure 3-6 Global Settings Page 3.1.2 Service Bus Project Monitoring Pages The Service Bus Project pages display information about the services in the selected project, and include the Service Health page and the Operations page. These pages are similar to the domain-level pages described in Service Bus Domain-Level Monitoring Pages,, but are only for the services included in the selected project. The Service Health page displays service health metrics for the services in the selected project. The Operations page displays the operational settings for the services in the selected project. You can update these settings individually or for all services in the project. 3-8 Administering Oracle Service Bus Logging in to Oracle Enterprise Manager Fusion Middleware Control 3.1.3 Service Bus Service Monitoring Pages You can monitor a specific service using the monitoring pages for that service. The service-specific pages include a Dashboard, the Policies page, and the Properties page. 3.1.3.1 Dashboard (Service-Level) The Dashboard displays service health metrics for the selected service, including alert counts, message counts, response times, and error counts. It also displays statistics for WSDL operations, if applicable. For business services only, you can view information about the state of the endpoint along with other statistics, and you manage endpoint URIs by bringing an endpoint URI online or offline. For pipeline and split-joins only, the Dashboard displays additional statistics down to the branch and activity levels. 3.1.3.2 Properties The Properties page displays the current operational settings for the service. You can update the settings by enabling or disabling settings, specifying monitoring and logging levels, specifying alert severities, and defining an aggregation interval. The available settings differ based on the type of Service Bus service you are monitoring. For more information, see Configuring Operational and Global Settings. 3.1.3.3 Policies The Policies page displays a list of all security policies attached to the service at a global level and a list of those attached directly to the service. From this page you can attach and detach policies and specify override values for policies that support overrides. Global policies cannot be modified on this page. Fusion Middleware Control provides features to monitor policy usage and violations, and to create global policy sets. For more information, see Monitoring and Managing Security Policies. 3.2 Logging in to Oracle Enterprise Manager Fusion Middleware Control In addition to entering the URL for Fusion Middleware Control directly in a web browser (described below), you can also access it from the Oracle Service Bus Console by clicking Links > EM Console. This lets you bypass the login step. To log in to Oracle Enterprise Manager Fusion Middleware Control: 1. Enter the following URL in your browser: http://host_name:port/em Where host_name is the name of the host on which Fusion Middleware Control is installed and port is the port number of the Administration Server (7001, by default). The port number is listed in the following file: DOMAIN_HOME/config/config.xml 2. Enter the administrator user name and password and click Login. Note: The default administrator user name is weblogic. You can change this during installation. Getting Started with Oracle Service Bus Administration 3-9 Navigating to Oracle Service Bus Administration Pages The Accessibility Preference dialog appears the first time you log in. If you want, you can select to not display this dialog again. 3. Select an appropriate action and click Continue. The home page appears. From here, you can navigate to Oracle Service Bus in several different ways, as described in the following sections. 3.3 Navigating to Oracle Service Bus Administration Pages You can navigate to Service Bus administration tasks through the Service Bus home page and menu. The Service Bus home page provides you with access to all deployed Service Bus services and service components. You can navigate through the Service Bus pages using several different methods and menus. 3.3.1 Navigating Through the Service Bus Home Page and Menu The Service Bus home page and menu provide access to all SLA and pipeline alerts, health statistics, and Service Bus services. To navigate through the Service Bus home page and menu: 1. In the Target Navigator, expand SOA, and then click service-bus. The Dashboard page of the Service Bus home page appears. The upper part of the page displays a chart of SLA alerts, and you can choose to view pipeline alerts instead. It also displays services with the most alerts, information about the alerts, and a list of services with the most errors. 2. To access additional information about a service that is listed in any of the sections, click the service name. 3. To access additional information for all items in a section, click Show More at the bottom of that section. 4. To access the navigation menu, do one of the following: • Click the Service Bus menu below service-bus the upper left of the page. • Right-click service-bus in the Target Navigator. Note: Depending upon your current location, the context of this menu changes to provide you with relevant administrative options. For example, when you are within the pages of a project or service, the Service Bus Project menu appears instead. 5. From the Service Bus menu, access any of the following options. Option Description Home Select this option to select a different Service Bus page to view. 3-10 Administering Oracle Service Bus Navigating to Oracle Service Bus Administration Pages Option Description Logs Select this option to view or configure log files, and select one of the following options: • View Log Messages: Select this to view the entries logged in the target log file. • Log Configuration: Select this to define log files and log levels for the different Service Bus loggers. Message Reports Select this option to view any message reports generated from pipeline reporting actions. Import Select this option to import a Service Bus configuration JAR file and, optionally, a configuration file that defines environment values. Export Select this option to export Service Bus projects and resources to a configuration JAR file. Security Select this option to configure security policies or roles, and select one of the following options: • Application Policies: Select this to create application policies that an application relies upon for controlling access to resources. • Application Roles: Select this to create application roles for applications. These options do not configure security policies for Service Bus services. System MBean Browser Select this option to launch the MBean browser, where you can view information about the MBean properties set for this domain. Target Information Select this option to view information about the target server, including the version, the location of the domain and Fusion Middleware home directories, and the server host name. 6. From the Service Bus home page, select any of the following tabs to search for and view additional information: • Dashboard: Displays information about alerts and errors. For more information, see Monitoring Oracle Service Bus Alerts. • Alert History: Displays a history of alerts and lets you search for alerts that meet the criteria you specify. For more information, see Monitoring Oracle Service Bus Alerts. • Service Health: Displays service health statistics and lets you search for running services to view. For more information, see Monitoring Oracle Service Bus Service Health. • Resequence Messages: Displays the status of resequencing messages, and lets you recover faults or skip messages that are blocking a group. For more information, see Monitoring Resequencing Groups . • Operations: Displays the current operational settings for running services, and lets you search for services and update their operational settings. For more information, see Configuring Operational and Global Settings. Getting Started with Oracle Service Bus Administration 3-11 Navigating to Oracle Service Bus Administration Pages • Global Settings: Displays the global operational settings, which you can enable and disable. For more information, see Configuring Operational and Global Settings. 3.3.2 Navigating Through the Service Bus Projects Home Page and Menu You can navigate directly to Service Bus tasks for a specific Service Bus project using the Service Bus Project menu. This menu is the same for both Service Bus projects and services. To navigate through the Service Bus Project home page and menu: 1. Expand SOA in the Target Navigator, and then expand service-bus. All running Service Bus projects appear in the list below service-bus. 2. Select a specific Service Bus project. The Service Health page for the selected project appears. 3. To access the navigation menu, do one of the following: • Click Service Bus Project below service-bus the upper left of the page. • Right-click the name of a project in the Target Navigator. The Service Bus Project menu provides you with administrative tasks specific to the current Service Bus application. 4. From the Service Bus Project menu, access any of the following options. Option Description Home Select this option to return to the Service Bus Project home page and directly navigate to any of the tabbed pages. Message Reports Select this option to view message reports generated from a pipeline reporting action. Import Select this option to import a Service Bus configuration JAR file or configuration file that defines environment values. Export Select this option to export Service Bus resources to a configuration JAR file. Target Information Select this option to view information about the target server, including the version, the location of the domain and Fusion Middleware home directories, and the server host name. 5. From the Service Bus Project home page, select any of the following tabs to search for and view additional information: • Service Health: Displays service health statistics and lets you search for running services in the current project to view. For more information, see Monitoring Oracle Service Bus Service Health. • Operations: Displays the operational settings for services in the project, and lets you search for services in the current project to update their operational settings. For more information, see Configuring Operational and Global Settings. 3-12 Administering Oracle Service Bus Navigating to the System MBean Browser 3.3.3 Navigating to Oracle Service Bus Pages from the Home Page The Fusion Middleware Control home page is the WebLogic Domain page, and is the page that appears when you first log in to the console. You can access the Service Bus home page or the home page for a specific Service Bus project from WebLogic Domain page. To navigate to a Service Bus or Service Bus project home page: • In the Deployments section of the home page, scroll through the list of deployed applications, and select either service-bus or the name of a specific Service Bus project. The home page for your selection appears. 3.4 Navigating to the System MBean Browser Some configuration parameters for Oracle Service Bus are not exposed in any Fusion Middleware Control property page. These parameters can be viewed using the System MBean Browser. A managed bean (MBean) is a Java object that represents a Java Management Extensions (JMX) manageable resource in a distributed environment, such as an application, a service, a component, or a device. Fusion Middleware Control provides the System MBean Browser for managing MBeans that perform specific monitoring and configuration tasks. For general information about the System MBean Browser, see "Getting Started Using the Fusion Middleware Control MBean Browsers" in Administering Oracle Fusion Middleware. You can directly access the main System MBean Browser page from the Target Navigator. The main page provides you with access to all properties in the System MBean Browser. You must then traverse the navigational tree to the section that you want to manage. To access the System MBean Browser: 1. In the Target Navigator, right-click service-bus. 2. Select System MBean Browser. The System MBean Browser appears with a list of application-defined MBeans for Service Bus. 3.5 Setting Accessibility Options Fusion Middleware Control provides accessibility options for the pages on which you monitor and manage Service Bus services. Fusion Middleware Control supports screen readers and provides standard shortcut keys to support keyboard navigation. You can also view the console pages in high contrast or with large fonts for better readability. For information and instructions on configuring accessibility in Fusion Middleware Control, see "Using Oracle Fusion Middleware Accessibility Options" in Administering Oracle Fusion Middleware. 3.6 Logging out of Oracle Enterprise Manager Fusion Middleware Control To log out of Oracle Enterprise Manager Fusion Middleware Control: Getting Started with Oracle Service Bus Administration 3-13 Starting Oracle Service Bus Servers • In the upper right-hand corner of any page, click the Log Out link. 3.7 Starting Oracle Service Bus Servers Service Bus services must be deployed to a running Oracle WebLogic Server, which can be started in a number of ways. For complete information about starting the servers using a command line, startup script, or the Administration Console, see Administering Server Startup and Shutdown for Oracle WebLogic Server. 3-14 Administering Oracle Service Bus Part II Monitoring Oracle Service Bus This part describes how to monitor Service Bus services and components, including viewing alerts, service health, resequencing group status, and log files. This part contains the following chapters: • Monitoring Oracle Service Bus Alerts • Monitoring Oracle Service Bus Service Health • Monitoring Resequencing Groups • Configuring and Monitoring Log Files 4 Monitoring Oracle Service Bus Alerts This chapter describes how to monitor and manage Service Bus service level agreement (SLA) and pipeline alerts. You create and configure SLA alert rules in the Oracle Service Bus Console, defining the conditions that trigger alerts that you can monitor at runtime. You define pipeline alerts when defining the message flow in a pipeline through an alert action. This chapter includes the following topics: • Introduction to Oracle Service Bus Alerts • About Service Level Agreement Alerts • About Pipeline Alerts • Enabling and Disabling Alerts • Creating Service Level Agreement Alert Rules • Updating SLA Alert Rules • Monitoring SLA and Pipeline Alerts 4.1 Introduction to Oracle Service Bus Alerts Oracle Service Bus lets you define two different types of alerts for service components: service level agreement (SLA) alerts and pipeline alerts. You define SLA alert rules in the Oracle Service Bus Console, and you define pipeline alert rules in either the Oracle Service Bus Console or JDeveloper. For both types of alerts, you can specify alert destinations, such as email addresses and JMS queues. The following figure shows the Service Bus Service Health page, with a list of services that have generated alerts. 4.1.1 Alerts on the Service Bus Dashboard In Fusion Middleware Control, you can monitor domain-wide SLA and pipeline alerts on the Service Bus Dashboard page. This page displays information about all alerts that occurred on the domain within the specified interval or since the last time the statistics were reset. The Dashboard includes the following information: • A pie chart illustrating the breakdown of alerts by severity for the specified period. • The top 10 services with the specified type of alert in the current aggregation interval, listed in descending order. • A table that lists and describes the alerts represented by the pie chart. • A table that lists the services with the most errors. Monitoring Oracle Service Bus Alerts 4-1 About Service Level Agreement Alerts The alerts listed on the page are the alerts that are represented in the pie chart. You can click on the name of an alert or service in any of the tables on this page to view more information, or click on a section of the pie chart to view additional information about alerts of the specified severity. Alerts can be sent to multiple alert destinations, including email addresses, JMS queues, and SNMP traps. The destinations for an alert are defined in an alert destination resource, which is associated with the alert in Service Bus. For more information about alert destinations, see "Working with Alert Destinations" in Developing Services with Oracle Service Bus. 4.1.2 Alerts and Operational Settings Alerts are only generated if alerting and monitoring are enabled for the Service Bus domain. For SLA alerts, SLA alerting must be enabled for both the individual service and the domain. For pipeline alerts, pipeline alerting must be enabled for both the individual pipeline and the domain. For more information about operational settings, see Configuring Operational and Global Settings. 4.2 About Service Level Agreement Alerts The purpose of SLA alerts is to inform the operations team of issues relating to the health of Service Bus services or to the quality of service provided. SLA alert rules trigger alerts for proxy services, business services, pipelines, and split-joins based on the conditions you define for each service. You can configure these alerts when you create Service Bus resources for a project. When you create an alert rule, you define the name, description, summary, duration, severity, frequency, and state of the alert rule. You also define one or more conditions that trigger an alert based on the rule. Conditions can include message or error counts, response times, failure or success ratios, and endpoint URI status. SLA alerts are automated responses to SLA alert rules violations and are displayed on the Dashboard and the Alert History page. You define alert rules to specify unacceptable service performance according to your business and performance requirements. When you create an SLA alert rule, you can specify the daily operating times for alerts and a date on which the alert rule expires. You can also specify the aggregation interval for the alerts generated by the rule. The alert aggregation interval set for the alert is not affected by the aggregation interval set for the service. For more information about aggregation intervals, see Aggregation Intervals. For a service for which monitoring is enabled, an alert rule is evaluated at discrete intervals. Once an alert rule is created, it is first evaluated at the end of the aggregation interval, and after that at the end of each sample interval. For example, if the aggregation interval of an alert rule is five minutes, it is evaluated five minutes after it is created, and then every minute after that (since the sample interval for five minutes is one minute). If a rule evaluates to false no alert is generated. If the rule evaluates to true the alert generation is governed by the Alert Frequency. If the frequency is Every Time, an alert is generated every time an alert rule evaluates to true. If the frequency is Notify Once, an alert is generated only if no alert is generated in the previous evaluation. In other words, an alert is generated the first time the alert rule evaluates to true and no more notifications are generated until the condition resets itself and evaluates to True again. 4-2 Administering Oracle Service Bus About Service Level Agreement Alerts 4.2.1 SLA Alert Severity Levels When you create an SLA or pipeline alert rule, you specify the severity of the alert. These levels have no concrete meaning within Service Bus; you define what they mean for your specific implementation. Alerts can have the following levels of severity: • Normal • Warning • Minor • Major • Critical • Fatal 4.2.2 Aggregation Intervals The aggregation interval determines the frequency at which the monitoring system tests the alert condition. The condition is tested each time the monitoring subsystem aggregates enough samples of data to constitute one aggregation interval. For example, if you select an aggregation interval of 1 hour, the condition is tested each time an hour's worth of data is available. The first time the condition is tested is at the end of the first hour. After that, the condition is tested every 10 minutes because the sampling interval for an aggregation interval of 1 hour is set to 10 minutes. You specify the aggregation interval for an alert rule when you create and configure the rule. This aggregation interval is not affected by the aggregation interval set for the service. 4.2.3 SLA Alert Frequencies You can specify that an alert be generated every time the alert rule condition is met or only the first time it is met. When an alert rule generates an alert each time a condition is met, the actions included in the alert rule are executed every time the alert rule evaluates to true. For example, if you define a condition that the average response time is greater than 300 milliseconds, you receive an alert every time this condition evaluates to true. The number of times an alert rule is evaluated depends on the aggregation interval and the sample interval associated with that rule. If the aggregation interval is set to 5 minutes, the sample interval is 1 minute. Rules are evaluated each time 5 samples of data are available. Therefore, the rule is evaluated for the first time approximately 5 minutes after it is created and every minute thereafter. When an alert rule is configured to generate an alert only once, the actions included in the rule are executed the first time the rule evaluates to true, and no more alerts are generated until the condition resets itself and evaluates to true again. For example, if you define a condition that the average response time is less than 300 milliseconds, you receive an alert the first time this condition evaluates to true, but you do not receive any more alerts until the condition evaluates to false and then to true again. The alert timestamp is updated and displayed on the Dashboard. Monitoring Oracle Service Bus Alerts 4-3 About Service Level Agreement Alerts 4.2.4 SLA Alert Statistics When you define alert conditions for SLA alert rules, you can select from several measures to use to evaluate the alert, including a specific count, minimum, maximum, average, or status to evaluate. Depending on which of these you choose, the list of statistics you can select varies. For example, if you select Minimum, Maximum, or Average, the Response Time statistic is available. The statistics available also depend on the configuration of the service itself. The number of statistics varies according to whether a service has pipelines, route nodes, operations, and so on. The following sections list and describe the available statistics for each measure. 4.2.4.1 Count Statistic Details The following table describes Count Statistic details. Table 4-1 Count Statistic Details Statistic Description Cache Hit Count For business services that use result caching, this statistic increments each time the cache is used to return a response to a client. Error Count The number of errors. This number is incremented each time message processing returns a failure. Failover Count For business services only, the number of times failover occurs. Failure Ratio (%) The ratio of errors encountered to the total number of messages successfully processed over the specified aggregation interval. Message Count The total number of messages processed. Success Ratio (%) The ratio of messages successfully processed to the total number of messages encountered over the specified aggregation interval. Request Pipeline.Error Count For pipelines only, the number of erroneous messages processed by the request pipeline. Request Pipeline.Message Count For pipelines only, the number of messages processed by the request pipeline. Response Pipeline.Error Count For pipelines only, the number of erroneous messages processed by the response pipeline. Response Pipeline.Message Count For pipelines only, the number of messages processed by the response pipeline. Validation Error Count For proxy services that have a validate action in the pipeline, the number of validation errors. For pipelines, this statistic is named validation-errors. WSS Error Count This operand is available depending on the transport for the service (such as with HTTP). It is the number of Web Service Security (WSS) erroneous messages processed. This counter is only available for WSDL-based services and is updated when a WSS error is encountered. 4-4 Administering Oracle Service Bus About Pipeline Alerts Statistic Description Uri:path.Message Count and Uri:path.Error Count These operands set alerts for business process endpoint URIs. For information on how to generate alerts based on endpoint URIs, see Monitoring and Managing Endpoint URIs for Business Services. 4.2.4.2 Maximum, Minimum, and Average Statistic Details The following table describes Maximum, Minimum, and Average Statistic details. Table 4-2 Maximum, Minimum, and Average Statistic Details Statistic Description Request Pipeline.Elapsed Time For pipelines only, the length of time it takes the request pipeline to process each message. Response Pipeline.Elapsed Time For pipelines only, the length of time it takes the response pipeline to process each message. Elapsed Time For pipelines and split-joins only, the length of time it takes to process each request or response. Response Time The length of time in milliseconds it takes to process each request or response. Throttling Time For business services only, the length of time a message processed by a business service configured for throttling spent in the throttling queue. Uri:path.Response Time This operand sets alerts for business process endpoint URIs. For information on how to generate alerts based on endpoint URIs, see Monitoring and Managing Endpoint URIs for Business Services. 4.2.4.3 Status Statistic Details The status statistics only apply to business services, and you can use them to base your conditions on whether the business service's endpoint URI is online or offline. The following table describes Status Statistic details. Table 4-3 Status Statistic Details Statistic Description All URIs Offline Evaluates to true if all URIs in the cluster are offline. All URIs Online Evaluates to true if all URIs in the cluster are online. Any URIs Offline Evaluates to true if any URIs in the cluster are offline. Any URIs Online Evaluates to true if any URIs in the cluster are online. 4.3 About Pipeline Alerts Pipeline alerts are triggered based on message context rather than a set of predefined conditions. You define pipeline alerts directly in the pipeline message flow by adding and configuring an alert action. Pipeline alert actions generate alerts based on the message context in a pipeline, and can be configured to include an alert name, Monitoring Oracle Service Bus Alerts 4-5 Enabling and Disabling Alerts description (which can include message elements, such as $order), alert destination, and alert severity. Unlike SLA alerts, notifications generated by a pipeline alert action are primarily intended for business purposes or to report errors, and not for monitoring system health. To define conditions under which a pipeline alert is triggered, use the conditional constructs available in the pipeline editor such as XQuery Editor or an if-then-else construct. You have complete control over the alert body, including the context variables, and you can extract the portions of the message to include in the alert. In addition to viewing pipeline alerts in Fusion Middleware Control, you can also select an alert destination to send notifications through email or JMS destinations. For more information, see "Adding Alert Actions" in Developing Services with Oracle Service Bus. 4.3.1 A Sample Use Case for Pipeline Alerts A sample use for pipeline alert might be when you want to be notified when special business conditions are encountered in a message flow. You can configure an alert action in a pipeline to raise alerts when such predefined conditions are encountered. You can also configure email and JMS alert destinations to receive a notification of the alert, and send the details to the alert recipient in the form of payload. For example, you want to be notified when an order exceeding $10 million is routed to a pipeline that routes orders to a purchase order website. You can create an alert action in the appropriate place in the pipeline that defines the condition of exceeding $10 million, and then configure an email alert destination as the target destination in the alert action. You can configure the content of the alert, and can also include the details of the order in the form of a payload. Pipeline alerting can also be used to detect errors in a message flow. For example, when a proxy service validates the input documents, you may want to be notified when the validation fails so you can contact the client to fix the problem. For this you must configure an alert action within the error handler for the pipeline. In the action, you can include the actual error message in the fault variable and other details in the SOAP header, to be sent as the payload. You can also configure additional alert destinations using an alert destination resource in the alert action. 4.4 Enabling and Disabling Alerts To raise an SLA or pipeline alert, you first define the alert rules and then enable alerting and monitoring at both the service level and the global level. For example, to enable SLA alerts for a proxy service, you must define the alert rules for that service in Oracle Service Bus Console, enable SLA alerting and monitoring for that proxy service, and enable SLA alerting and monitoring globally for the service bus domain. The last two steps are performed in Fusion Middleware Control. The same steps apply to enabling pipeline alerts. For more information about how to configure operational settings for services, see Viewing and Configuring Operational Settings. The Alert History panel contains a customizable table displaying information about violations or occurrences of events in the system. 4.5 Creating Service Level Agreement Alert Rules Creating SLA alert rules is a two-step process. First, you configure properties for the alert rule, such as how and when the rule is evaluated, any email or JMS destinations 4-6 Administering Oracle Service Bus Creating Service Level Agreement Alert Rules for alerts generated from the rule, and the severity of the generated alerts. Once the properties are configured, you can specify the conditions that, when met, generate the alerts. Note: When a service is created from another service, alert rules are maintained in the following way: • When a proxy service is created from a business service or a business service is created from a proxy service, the alert rules, if any, are removed. • When a proxy service is created from another proxy service or a business service is created from another business service, the alert rules, if any, are retained. 4.5.1 Before You Begin If you want the alerts generated by the SLA alert rule to be sent to email addresses or JMS queues for notifications, you must create an alert destination that defines those destinations. For more information, see "Working with Alert Destinations" in Developing Services with Oracle Service Bus. 4.5.2 Configuring SLA Alert Rule Properties To create an SLA alert and configure its properties: 1. Launch the Oracle Service Bus Console. For more information, see "Getting Started" in Developing Services with Oracle Service Bus. 2. If you are not currently in a session, click Create to create a new session or click Edit to enter an existing session. 3. In the Project Navigator, click the proxy service, business service, pipeline, or split- join to which you want to add SLA alerts. 4. On the editor, click the SLA Alert Rules tab. 5. Above the summary table, click Add a New Alert Rule. The Create SLA Alert Rule wizard appears, as shown below. Monitoring Oracle Service Bus Alerts 4-7 Creating Service Level Agreement Alert Rules Figure 4-1 Create SLA Alert Rule Wizard - Rule Configuration 6. Enter a name, description, and brief summary for the rule. The alert summary is the text of the subject line for any email notifications, and can contain no more than 80 characters. If you do not provide an alert summary, the default text, Oracle Service Bus Alert, is used. 7. To enable the rule, select Rule State. 8. In the Alert Destination field, enter the name of the alert destination resource or click Browse to search for and select a resource on the Search and Select dialog. Select an alert destination from the list and click OK. By default, all alerts go to Fusion Middleware Control. 9. To specify a window of time each day during which the rule is active, enter the beginning and ending times in the Start Time and End Time fields in the format HH:MM [AM/PM]. The alert rule is active daily from the start time you specified until the end time you specified, until the rule expires. 10. In the Expiration Date field, enter an expiration date in the format MM/DD/YYYY. The rule expires at 11:59 pm on the specified date. If you do not specify a date, the rule never expires. 4-8 Administering Oracle Service Bus Creating Service Level Agreement Alert Rules 11. In the Alert Severity field, select the severity from the list of options. 12. In the Alert Frequency field, select Every Time or Notify Once. For more information, see SLA Alert Frequencies.. 13. In the Process Next Rule field, select Stop to abort executing further rules after one of the rules associated with a service evaluates to true. Select Continue to continue executing further rules. Use this option to stop evaluating subsequent rules when there are multiple rules associated with a particular service. Keep No as the default to continue processing rules. 14. Click Next and continue to Defining SLA Alert Rule Conditions.. 4.5.3 Defining SLA Alert Rule Conditions You must define at least one condition, which consists of a simple expression. If you specify multiple conditions, use the And/Or operators to combine them. For more information about the measures and statistics you can use to define conditions, see SLA Alert Statistics. Figure 4-2 Create SLA Alert Rule Wizard - Rule Condition These instructions assume you completed Configuring SLA Alert Rule Properties and are on the Rule Condition page of the Create SLA Alert Rule wizard. To define the conditions for an SLA alert rule: 1. On the Rule Condition page of the Create SLA Alert Rule wizard, select the time period for the Condition Aggregation Interval. For more information, see Aggregation Intervals. 2. To define a condition, do the following: a. If there is no template row in the table, click Add a New Condition above the Condition Builder table. A new row appears in the table. b. From the first list of options, select the type of measure to use to evaluate the statistic. Select from Count, Minimum, Maximum, Average, or Status. Monitoring Oracle Service Bus Alerts 4-9 Creating Service Level Agreement Alert Rules Note: Status is only available for business services, and lets you base a condition on whether the endpoint URI is online or offline. c. From the second list of options, select the statistic to evaluate, such as Error Count, Failover Ratio (%), Response Time, and so on. The available statistics vary based on the type of measure you selected. For more information, see SLA Alert Statistics. d. From the third list of options, select a comparison operator: =, !=, > or <. e. In the field after the comparison operator, enter the value to compare the actual statistic against. If the condition is based on endpoint URI status, select True or False. f. If the condition is based on endpoint URI status, select whether to evaluate the rule for all servers or on any server. g. To the right of the row, click Update the Condition. 3. Repeat the above steps until you have added all the conditions you want to include in the alert rule. 4. To join the conditions you defined, select the conditions to join, click Join Selected Conditions, and then select either the And or Or operator. The conditions you selected are combined into one complex expression. Note: You can join several conditions at once if they should be at the same level and should be joined by the same operator. If you join a group of conditions, and then join the resulting complex expression with yet another condition, that complex expression is nested within parentheses in the final complex expression. 5. To revert a complex expression back to its original separate conditions, select the complex expression and click Split Selected Condition. 6. When you are done configuring properties and creating conditions, click Create. The new alert rule appears in the summary table, as shown in the following figure. 4-10 Administering Oracle Service Bus Updating SLA Alert Rules Figure 4-3 SLA Alert Rules Tab with Alert Rules Defined 4.6 Updating SLA Alert Rules Once you create an SLA alert for a service, you can modify the rule properties and conditions. You can also delete an SLA alert. • Editing Alert Rules • Deleting Alert Rules 4.6.1 Editing Alert Rules To edit alert rules: 1. Launch the Oracle Service Bus Console. For more information, see Getting Startedin Developing Services with Oracle Service Bus. 2. If you are not currently in a session, click Create to create a new session or click Edit to enter an existing session. 3. In the Project Navigator, click the proxy service, business service, pipeline, or split- join containing the SLA alert to modify. 4. Click the SLA Alert Rules tab. 5. Modify any of the following fields for an alert rule by selecting a new value from the list of available options: • Severity • Process Next Rule • Frequency 6. To disable a rule, clear the Enabled check box. To enable a rule, select the check box. 7. To enter or modify the expiration date, click Select Date in the Expiration Date column and select the expiration date to use. 8. To update additional properties and conditions for the alert rule, select the rule to update and then click the Edit icon above the Summary table. Update any of the Monitoring Oracle Service Bus Alerts 4-11 Monitoring SLA and Pipeline Alerts fields described in the online help or in Creating Service Level Agreement Alert Rules .. 9. When you are done making changes, click the Save icon. 10. To end the session and deploy the configuration to the runtime, click Activate. 4.6.2 Deleting Alert Rules To delete alert rules: 1. Launch the Oracle Service Bus Console. For more information, see Getting Started in Developing Services with Oracle Service Bus. 2. If you are not currently in a session, click Create to create a new session or click Edit to enter an existing session. 3. In the Project Navigator, click the proxy service, business service, pipeline, or split- join contain the SLA alert to delete. 4. Click the SLA Alert Rules tab. 5. Select the alert rule to delete, and the click the Delete above the Summary table. The alert rule is deleted in the current session. 6. When you are done making changes, click the Save icon. 7. To end the session and deploy the configuration to the runtime, click Activate. 4.7 Monitoring SLA and Pipeline Alerts When monitoring SLA and pipeline alerts in Fusion Middleware Control, you can view statistics for all alerts in the domains or a subset of alerts, view detailed information about a specific alert, and delete or purge alerts. You can also view how the alert rule is configured for a specific alert. 4-12 Administering Oracle Service Bus Monitoring SLA and Pipeline Alerts Figure 4-4 Service Bus Alert History Page 4.7.1 Enabling Alert Reporting In order to monitor SLA alerts, both monitoring and SLA alerts must be enabled at the global level. For information about configuring global settings, see Configuring Operational Settings at the Global Level. Once the global settings are configured, you also need to enable monitoring and SLA alerts for each service for which you want to monitor SLA alerts. You can also specify the alert level . For instructions, see the following topics: • Enabling and Disabling Operational Settings for a Single Service • Configuring the SLA Alert Level for a Service. 4.7.2 Viewing all SLA and Pipeline Alerts in a Domain To view all alerts in a domain: 1. In the Target Navigator, expand SOA and select service-bus. The Service Bus Dashboard page appears with the default selections to show SLA alerts for the past 30 minutes. 2. For the alert type, select either SLA Alerts or Pipeline Alerts. 3. In the Alerts History Duration field, select the amount of time (going back from this moment) for which you want to view alerts. The page updates to display only the alerts of the type and for the duration you specified. 4. Do any of the following: Monitoring Oracle Service Bus Alerts 4-13 Monitoring SLA and Pipeline Alerts • To view more information about the alerts of a specific severity, click that section of the pie chart. • To view a more complete history for the alerts, click Show More above the Alert History table. • To view more information about a specific alert, click the name of the alert. If an alert has an information icon by its name, hover over the icon to view the annotation. • To view the health of your services running on a different server, select the new server name from the Server field above the Service Health Snapshot table. • To view the health of your services based on information gained since the last statistics reset, select Since Last Reset from the field next to Service Health Snapshot. • To view more information about the health of your services running on a specific server, click Show More above the Service Health Snapshot table. • To view more information about a specific service in any of the tables on this page, click the name of that service. 4.7.3 Filtering SLA and Pipeline Alerts The Service Bus Alert History page lets you search for the specific alerts you want to view. Alerts are stored using the WebLogic Diagnostics Framework, which provides its own query language, including wildcard characters. For filtering alerts in the alert history, use the syntax described in "WLDF Query Language" in Configuring and Using the Diagnostics Framework for Oracle WebLogic Server. From the Dashboard page, you can also click on a specific area in the SLA or pipeline alerts pie chart to display the Alert History page for alerts with the chosen level of severity and alert history duration. Note: This page also appears when you select an alert from the Dashboard page. To perform a search for alerts from the Service Bus home page: 1. In the Target Navigator, expand SOA and select service-bus. The Service Bus Dashboard page appears. 2. Click the Alert History tab. 3. In the upper portion of the page, enter the criteria for the alerts you want to find. You can enter the following search criteria. For more information about these fields, see the online help provided with Fusion Middleware Control. • Alert type • Alert rule name for SLA alerts, or alert summary for pipeline alerts To find pipeline alert actions that were designed without alert summary text, enter Oracle Service Bus Alert. 4-14 Administering Oracle Service Bus Monitoring SLA and Pipeline Alerts • Alert severity Select the or above check box to restrict your search to the specified severity level or above. • Name of the service for which the alert rules are defined • Date range 4. When you are done entering the search criteria, click Search. Any alerts matching your criteria appear in the Alerts table. 5. To adjust how search results appear in the Alert History table, use the View menu above the table to do any of the following. • Columns: Use this option to select the columns to display in the table. Click Manage Columns to open a dialog that lets you choose which columns are hidden and which are visible. • Sort: Use this option to specify whether to sort the columns in ascending or descending order. Select Advanced Sort to open a dialog that lets you choose the column and order by which to sort the results. • Reorder Columns: Use this option to open a dialog that lets you change the order of the visible columns. 6. To clear all the criteria you entered, click Reset. 4.7.4 Viewing SLA or Pipeline Alert Details When an alert appears in Alert History table of the Service Bus Dashboard or Alert History page, you can click the name of the alert to view more information about it. 4.7.4.1 Viewing Alert Details on the Service Bus Dashboard You can view alert details on the Service Bus Dashboard. To view alert details on the Dashboard: 1. In the Target Navigator, expand SOA and select service-bus. The Service Bus Dashboard page appears. 2. If an alert has an information icon next to its name, someone has added annotations to the alert. Hover over the icon to the view the annotation text. 3. Click the name or summary of an alert in the Alert History table. The Alert Detail dialog appears. 4. To update the annotation, enter the new text in the text box, and click Apply. 5. Click the previous or next buttons to view information for other alerts in the table. 6. When you are done viewing the information, click Close. 4.7.4.2 Viewing Alert Details on the Alert History Page You can view alert details on the Alert History page. To view alert details on the Alert History page: Monitoring Oracle Service Bus Alerts 4-15 Monitoring SLA and Pipeline Alerts 1. In the Target Navigator, expand SOA and select service-bus. The Service Bus Dashboard page appears. 2. Click the Alert History tab. 3. Perform a search for the alert you want to view, as described in Filtering SLA and Pipeline Alerts. 4. Click the name or summary of an alert in the Alert History table. The Alert Detail dialog appears. 5. To update the annotation, enter the new text in the text box, and click Apply. 6. Click the previous or next buttons to view information for other alerts in the table. 7. When you are done viewing the information, click Close. 4.7.5 Viewing the Alert Rule Configuration You can view the configuration of the actual rule that triggered an alert. The Alert Rule dialog displays the following configuration information for a rule: • The name of the alert rule (for SLA alerts only) • The name and description of the rule • The expiration time of the rule • Whether the rule is enabled or disabled • The alert severity • The alert frequency • Whether processing for the rule is stopped after generating an alert • The aggregation interval • The condition expression 4.7.5.1 Viewing the Alert Rule Configuration on the Service Bus Dashboard You can view the alert rule configuration on the Service Bus Dashboard. To view the alert rule configuration on the Dashboard: 1. In the Target Navigator, expand SOA and select service-bus. The Service Bus Dashboard page appears. 2. In the Alert History table, click the icon in the Info column in the row of the alert you want to view. The Alert Rule dialog appears. 3. When you are done viewing the information, click Close. 4.7.5.2 Viewing the Alert Rule Configuration on the Alert History Page You can view the alert rule configuration on the Alert History page. 4-16 Administering Oracle Service Bus Monitoring SLA and Pipeline Alerts To view the alert rule configuration on the Alert History page: 1. In the Target Navigator, expand SOA and select service-bus. The Service Bus Dashboard page appears. 2. Click the Alert History tab. 3. Perform a search for the alert you want to view, as described in Filtering SLA and Pipeline Alerts. 4. In the Alert History table, click the icon in the Action column in the row of the alert you want to view. The Alert Rule dialog appears. 5. When you are done viewing the information, click Close. 4.7.6 Deleting an SLA or Pipeline Alert Once you display alerts on the Service Bus Alert History page, you can delete those alerts individually. To delete an alert: 1. In the Target Navigator, expand SOA and select service-bus. The Service Bus Dashboard page appears. 2. Click the Alert History tab. 3. Perform a search for the alert you want to delete, as described in Filtering SLA and Pipeline Alerts. 4. When the alert you want to delete appears in the Alert History table, select the alert and click Delete. Use the Ctrl key to select multiple alerts to delete. 4.7.7 Purging SLA or Pipeline Alerts Once you display alerts on the Service Bus Alert History page, you can purge all of the selected type of alerts (SLA or pipeline) or just those triggered within a specific time frame. Note: This action cannot be undone. 1. In the Target Navigator, expand SOA and select service-bus. The Service Bus Dashboard page appears. 2. Click the Alert History tab. 3. Perform a search for alerts, as described in Filtering SLA and Pipeline Alerts. 4. When the alerts appear in the Alert History table, click Purge. Monitoring Oracle Service Bus Alerts 4-17 Monitoring SLA and Pipeline Alerts The Purge Alert History dialog appears. 5. Do one of the following: • To permanently delete all SLA alerts, select All. • To permanently delete SLA alerts triggered within a specific date range, select Purge From/To and enter the purge from and purge to dates, or use the calendar icons to select the dates. If you enter the dates manually, use the format MM/DD/YY HH:MM AM|PM. 6. Click Purge. Note: If the server from which the alerts are being purged is unavailable, the logging framework persists a record of the purge and polls the server every 30 minutes to check its availability. When the logging framework finds the server available, it purges the alert(s). 4-18 Administering Oracle Service Bus 5 Monitoring Oracle Service Bus Service Health This chapter describes how to monitor the health of your Service Bus projects and services using service health statistics. Statistics such as response times or message, error, and alert counts can help you detect, analyze, and fix any issues. This chapter includes the following sections. • About Service Health Metrics • Monitoring Service Health Statistics • Resetting Statistics for Service Monitoring 5.1 About Service Health Metrics Service Bus collects statistics to help you monitor the health of your running services and projects using Fusion Middleware Control. The Service Health page lets you view all services in a domain or search for specific services to view. You can then select a service from the Services list to view more detailed information about that service's health on its own Dashboard page. You can monitor statistics based on the current aggregation interval or monitor a running count of the statistics from the last time the statistics were reset. You can reset statistics at any time for the domain, for a project, or for a service. When you display statistics based on the aggregation interval, you get a dynamic view of statistical data collected by each service with the aggregation interval determining the statistics that are displayed. For example, if the aggregation interval of a particular service is twenty minutes, that service's row displays the data collected in the last twenty minutes. For more information about the aggregation interval, see Introduction to Aggregation Intervals. 5.1.1 Service Health Metrics for Domains and Projects When you view metrics for a domain or project, the statistics displayed are only a subset of the general metrics collected for each service. The statistics include aggregation interval, average response time, message count, error count, and alert count. Service health metrics are only displayed for services that have monitoring enabled. The following table lists the metrics displayed for each type of service. For a complete list of statistics collected, see Statistics Collected for Oracle Service Bus. Monitoring Oracle Service Bus Service Health 5-1 About Service Health Metrics Table 5-1 Oracle Service Bus Service Metrics Metric Description Average Execution Time For a proxy service, the average of the time interval measured between receiving the message at the transport and either handling the exception or sending the response. For a business service, the average of the time interval measured between sending the message in the outbound transport and receiving an exception or a response. Total Number of Messages Number of messages sent to the service. In the case of JMS proxy services, if the transaction aborts due to an exception and places the message back in the queue so it is not lost, each retry dequeue is counted as a separate message. In the case of outbound transactions, each retry or failover is likewise counted as a separate message. Messages With Errors Number of messages with error responses. For a proxy service, it is the number of messages that resulted in an exit with the system error handler or an exit with a reply failure action. If the error is handled in the service itself with a reply with success or a resume action, it is not an error. For a business service, it is the number of messages that resulted in a transport error or a timeout. Retries and failovers are treated as separate messages. Success/Failure Ratio (Total Number of Messages - Number of Messages with Errors)/ Messages with Errors Security Number of messages with WS-Security errors. This metric is calculated for both proxy services and business services. Validation Number of validation actions in the flow that failed. This metric only applies to proxy services and pipelines. 5.1.2 Proxy Service Metrics From a proxy service's Dashboard page, you can view the following types of metrics for the service: • General: Displays a snapshot of the proxy service status for the current aggregation interval or since the last reset, including alerts, response times, message counts, error counts, and failure and success ratios. • Operations: Displays the statistics for operations defined for WSDL-based services. If there are no WSDL operations defined for the service, this table is empty. 5.1.3 Business Service Metrics From a business service's Dashboard page, you can view the following types of metrics for the service: • General: Displays a snapshot of the business service status for the current aggregation interval or since the last reset, including alerts, response times, message counts, error counts, and failure and success ratios. • Result Caching: Displays information about how result caching has been used for the service (if result caching is enabled). 5-2 Administering Oracle Service Bus Monitoring Service Health Statistics • Throttling: Displays the throttling statistics for a business service, including the minimum, maximum, and average throttling times in milliseconds (if throttling is enabled). • Operations: Displays the statistics for operations defined for WSDL-based services. If there are no WSDL operations defined for the service, this table is empty. • Endpoint URIs: Displays statistics for the various endpoint URIs configured for a business service, including the state, message count, error count, and response times. You can also bring URIs online and offline from this view. For more information, see Viewing Endpoint URI Metrics for a Business Service and Metrics for Monitoring Endpoint URIs. 5.1.4 Pipeline Service Metrics From a pipeline's Dashboard page, you can view the following types of metrics for the pipeline: • General: Displays a snapshot of the pipeline status for the current aggregation interval or since the last reset, including alerts, response times, message counts, and error counts. • Operations: Displays the statistics for operations defined for WSDL-based services. If there are no WSDL operations defined for the service, this table is empty. • Flow Metrics: Displays statistics for the message flow at the pipeline service level, pipeline (pair) level, or the action level, depending on the monitoring level for the pipeline. Statistics include message count, error count, and response times. When you select action-level statistics, the table displays information on actions in the pipeline as a hierarchy of nodes and actions. 5.1.5 Split-Join Service Metrics From a split-join's Dashboard page, you can view the following types of metrics for the split-join: • General: Displays a snapshot of the split-join status for the current aggregation interval or since the last reset, including alerts, response times, message counts, and error counts. • Flow Metrics: Displays statistics for the message flow at the split-join level, branch level, or activity level, depending on the monitoring level for the split-join. The statistics include message count, error count, and response times. When you select action-level statistics, the table displays information on actions in the split-join as a hierarchy of nodes and actions. 5.2 Monitoring Service Health Statistics The Service Health pages for Service Bus domains and projects display general metrics for services that have monitoring enabled. The Dashboard page for each service displays more detailed metrics for that service. The Current Aggregation Interval view displays a moving statistic view of the service metrics. The Since Last Reset view displays a running count of the metrics. If a cluster exists, cluster-wide metrics are displayed by default. Select an individual Managed Server to display metrics for that server. Monitoring Oracle Service Bus Service Health 5-3 Monitoring Service Health Statistics Monitoring for services is not enabled by default. To learn how to enable monitoring for services, see Viewing and Configuring Operational Settings. By default, the Dashboard refresh rate is No Refresh. 5.2.1 Viewing Statistics for the Services with the Most Errors The Service Bus Dashboard displays certain statistics for services that have generated the most errors for the time period you select. The statistics include the average response time, the number of messages processed, the number of errors generated, and the number of SLA alerts generated for the service. This is a limited set of statistics; you can click a service name to view the complete set of statistics for that service. For information about the statistics that appear on this page, see the online help provided with Service Bus. To view statistics for the services with the most errors: 1. In Fusion Middleware Control, expand SOA and select service-bus. 2. On the Service Bus Dashboard, scroll to the Services With Most Errors section. 3. In the Service Health Snapshot Table, select whether to view statistics for the current aggregation interval or for the period since the statistics were reset. 4. In the Server field, select the server for which you want to view statistics. 5. To view additional statistics for a service, click the name of the service in the table. The Dashboard for the selected service appears. 5.2.2 Viewing Service Health Statistics for a Domain The Service Bus - Service Health page displays health statistics for all services in the domain that have monitoring enabled. This is a subset of all statistics; you can click a service name to view the complete set of statistics for that service. You can filter the services displayed in the Services table by a variety of criteria. The following figure shows the Service Health page. 5-4 Administering Oracle Service Bus Monitoring Service Health Statistics Figure 5-1 Service Health Page To view statistics for all services in a Service Bus domain: 1. In Fusion Middleware Control, expand SOA and select service-bus. 2. Click the Service Health tab. 3. In the Display Statistics field, do one of the following: • To display monitoring statistics for the period of the current aggregation interval, select Current Aggregation Interval. • To display monitoring statistics for the period since you last reset statistics for a service, select Since Last Reset. 4. In the Server field, select a server from the list of options to display metrics for that server. 5. To list only specific services, enter any of the following search criteria: • In the Service field, select the type of service to search for, or select All Services to view all service types. • In the Name field, enter the name of the search target. This field accepts asterisks and question marks (* and ?) as wildcard characters. • In the Path field, enter the path of the search target. This field accepts asterisks and question marks (* and ?) as wildcard characters. Use the following format for the path: project-name/root-folder/ . . ./parent-folder If a service is directly under the project, use the following format: Monitoring Oracle Service Bus Service Health 5-5 Monitoring Service Health Statistics project-name • In the Invoked by Proxy field, click the search icon to search for and select the proxy service that invokes the service you want to find. • To view only services with messages, select Has Messages. • To view only services with alerts, select Has Alerts. • To view only services with errors, select Has Errors. • Click Reset to remove the search filters and display all services. 6. Click Search. A list of services matching your criteria appears. 7. To view additional statistics for a service, click the name of the service in the table. The Dashboard for the selected service appears. 5.2.3 Viewing Service Health Statistics for a Project The Service Bus Project - Service Health page displays health statistics for all services in the project that have monitoring enabled. This is a subset of all statistics; you can click a service name to view the complete set of statistics for that service. You can filter the services displayed in the Services table by a variety of criteria. The following figure shows the Dashboard page for a proxy service. 5-6 Administering Oracle Service Bus Monitoring Service Health Statistics Figure 5-2 Service Bus Service Dashboard To view statistics for the services in a Service Bus project: 1. In Fusion Middleware Control, expand SOA, expand service-bus, and select the name of the project for which you want to view statistics. The Service Bus Project - Service Health page appears. 2. In the Display Statistics field, do one of the following: • To display monitoring statistics for the period of the current aggregation interval, select Current Aggregation Interval. • To display monitoring statistics for the period since you last reset statistics for a service, select Since Last Reset. 3. In the Server field, select a server from the list of options to display metrics for that server. 4. To list only specific services, enter any of the following search criteria: • In the Service field, select the type of service to search for, or select All Services to view all service types. Monitoring Oracle Service Bus Service Health 5-7 Monitoring Service Health Statistics • In the Name field, enter the name of the search target. This field accepts asterisks and question marks (* and ?) as wildcard characters. • In the Path field, enter the path of the search target. This field accepts asterisks and question marks (* and ?) as wildcard characters. Use the following format for the path: project-name/root-folder/ . . ./parent-folder If a service is directly under the project, use the following format: project-name • In the Invoked by Proxy field, click the search icon to search for and select the proxy service that invokes the service you want to find. • To view only services with messages, select Has Messages. • To view only services with alerts, select Has Alerts. • To view only services with errors, select Has Errors. • Click Reset to remove the search filters and display all services. 5. Click Search. A list of services matching your criteria appears. 6. To view additional statistics for a service, click the name of the service in the table. The Dashboard for the selected service appears. 5.2.4 Viewing All Service Health Statistics for a Service The Dashboard page for each Service Bus service displays the complete set of service metrics and service-specific statistics for that service, but only if monitoring is enabled for that service. You can access the Dashboard page for a service in several ways. To view the complete set of health statistics for a service: 1. Navigate to one of the following pages in Fusion Middleware Control: • The Service Bus Dashboard page. To access this page, expand SOA and select service-bus. • The Service Bus - Service Health page. To access this page, expand SOA, select service-bus, and click the Service Health tab. • The Service Bus - Alert History page. To access this page, expand SOA, select service-bus, and click the Alert History tab. • The Service Bus Project - Service Health page. To access this page, expand SOA, expand service-bus, and select the name of the project. 2. If necessary, perform a search for the service whose statistics you want to view. 3. Click the name of the service whose statistics you want to view. 5-8 Administering Oracle Service Bus Resetting Statistics for Service Monitoring 5.3 Resetting Statistics for Service Monitoring You can use the Service Health page to reset monitoring statistics for all services in a domain or project, or just for one specific service. When you reset statistics, the system deletes all monitoring statistics that were collected for the service, project, or domain since you last reset statistics. However, the system does not delete the statistics being collected during the current aggregation interval for the service. After a statistics reset, the system immediately starts collecting monitoring statistics for the service again. Note: If a split-join that gathers branch or activity level statistics is redeployed, the statistics should be reset to ensure that the displayed statistics match the current branches and activities. To reset statistics for service monitoring: 1. Do one of the following: • To reset the statistics for all services in a domain, expand SOA and select service-bus. Click the Service Health tab. • To reset the statistics for all services in a project, expand SOA, expand servicebus, and select the name of the project. • To reset the statistics for a single service, navigate to that service's Dashboard page as described in Viewing All Service Health Statistics for a Service. 2. In the Display Statistics field, select Since Last Reset. 3. To the right of the Server field, click the Reset icon. All statistics are reset at the displayed level. 5.3.1 What You Might Need to Know About Resetting the Statistics When you reset statistics for a service, all the statistics collected for the service since the last reset are lost. Resetting the statistics for the domain resets the statistics for all monitored services regardless of whether they are displayed on the page or not. You cannot undo a reset action. The status of endpoint URIs is not reset when you reset statistics. Monitoring Oracle Service Bus Service Health 5-9 Resetting Statistics for Service Monitoring 5-10 Administering Oracle Service Bus 6 Monitoring Resequencing Groups This chapter describes how to monitor resequencing groups for running pipelines, and to recover from any errors that occur while resequencing and processing messages. This chapter includes the following sections: • Introduction to Resequencing Groups • Configuring Resequencing at Runtime • Monitoring Resequencing Groups and Messages • Managing Resequencing Groups at Runtime 6.1 Introduction to Resequencing Groups Service Bus pipelines can be configured to use a resequencer to re-order messages that arrive in a random order into a new order based on the resequencing strategy chosen. Resequencer strategies include best effort, standard, and FIFO. Messages are resequenced based on their resequencing group ID and their sequence ID, which are defined in the pipeline configuration. For information about how each strategy orders messages, see "Introduction to the Resequencer" and "Resequencing Order" in Developing SOA Applications with Oracle SOA Suite. The Resequence Messages tab of the Service Bus Home page in Fusion Middleware Control displays resequencing information so you can monitor the health of resequencing groups. This page shows message and group status, along with the Service Bus pipeline and project associated with each message and group. From this page, you can unlock a group that has timed out, resubmit failed messages, and skip a message that is blocking group processing. No health statistics are exposed for the resequencer. Instead, you can monitor the statistics for the associated service components, such as the pipelines and proxy services. 6.1.1 Oracle Service Bus Resequencing Message States The Resequence Messages page displays a running status of message processing for resequencing groups and messages. A resequencing message can be in one of the following states. • Running • Faulted • Completed • Aborted Monitoring Resequencing Groups 6-1 Introduction to Resequencing Groups When a group is in the running state, all messages are being processed normally. In the completed state, the group has finished processing all available messages. A resequencing group can be in a faulted state due a resequencing error, message error, database error, or group time out. Completed messages only appear in the results if the Purge Completed Messages global setting is not selected. Otherwise, completed messages are purged from the database and cannot be displayed on this page. 6.1.2 Resequencer Error Handling When message processing is suspended in a resequencing group due to a fault or a timeout, you can view additional information about the suspended group and specify how to restart message processing. Depending on the type of fault, you can cancel processing for the message or you can modify the payload and reprocess the message. When a group times out, you can skip to the next available instance to restart processing. Resequencing errors can occur during message persistence or message execution. Persistence errors include those that occur when evaluating the group ID or sequence ID, or when persisting the payload and message context variables. Execution errors include those that occur when accessing the database or when processing the message when it is sent to the pipeline. A group timeout can occur for the standard resequencer when a group is waiting for an expected message that does not arrive. 6.1.3 Resequencer Database The resequencer relies on a database for processing messages. The database tables are automatically created when you run Repository Creation Utility (RCU) when you create a Service Bus domain. Messages are purged from the database only when you configure the resequencer global settings to do so. For more information about how messages and message metadata are purged, see Automatic Purging of Completed Resequencer Messages. Service Bus provides scripts to purge and manage the resequencer tables in the database. For more information, see Managing Resequencer Tables. 6.1.4 How Deployment Activities Affect Resequencing Modifying a resequencer after it has been activated affects how the messages are processed at runtime. Activities that affect resequencers include updating the resequencer configuration, deleting a resequencer, or renaming or moving a pipeline associated with a resequencer. Under normal processing, the resequencer stores messages in the database and, once the messages are re-ordered, the messages are executed in another thread. When you remove a resequencer from a pipeline while messages are being processed, the following occurs: • Messages that have not been picked up from the database for processing remain in the database and are not automatically cleaned up. • Messages currently being picked up from the database for processing (but not yet sent to the pipeline) might generate an error message stating that the resequencer is undeployed. These messages also remain in the database. • Messages currently being processed by the pipeline are executed using the previous resequencer configuration. If you rename or move the pipeline associated with a resequencer, the resequencer is stopped and a new resequencer instance is created using the new path. If messages are 6-2 Administering Oracle Service Bus Configuring Resequencing at Runtime already being processed when the change is made, messages are processed as described above. Updating a resequencer configuration while it is processing messages may result in messages that are not processed. For example, if you modify the group ID, messages stored under the old group ID are not picked up for processing and remain in the database until they are manually cleared. 6.1.5 How Server Shutdown Affects Resequencing The resequencer handles messages differently when the server shuts down depending on where the message is in the process. This section describes three difference cases. 6.1.5.1 Server shuts down while a message is being transferred to the resequencer from Service Bus For message persistence, the resequencer participates in the current transaction if it exists; otherwise it starts its own transaction. If the proxy service is transactional, the transaction is rolled back and the message is redelivered based on the transactional setting on the inbound service. If the proxy service is non-transactional, the message may be lost depending on whether the resequencer could commit its transaction before the server shut down. 6.1.5.2 Server shuts down while a group is locked by the locker thread When the locker marks a group as locked and the server that is supposed to process the group's messages shuts down, the resequencer attempts to move this group to a different managed server for processing. 6.1.5.3 Server shuts down while a message is being processed by the resequencer When the server shuts down while a message is being processed, the message remains available to the resequencer and is processed once the server comes online again. There may be instances where the message is sent twice for processing from the resequencer to Service Bus. As an example, if the resequencer starts a transaction and then calls the Service Bus dispatch, after which the server shuts down, the message is again sent for processing when the server comes back online. 6.2 Configuring Resequencing at Runtime For services that use a resequencer, you can configure global settings that govern how the resequencers process messages at runtime. Service Bus provides the following operational settings for resequencers. These are global settings only, and cannot be applied at the service level. • Resequencer Locker Thread Sleep: The sleep interval for the locker threads in seconds. When the resequencer is unable to find a group with messages that can be processed, the locker thread sleeps for the specified duration. The locker thread does not sleep between each iteration of a database seek, as long as it finds groups with messages that can be processed. • Resequencer Maximum Groups Locked: The maximum number of resequencer groups that can be retrieved for processing in a single iteration of a database seek. Once retrieved, the groups are assigned to worker threads for processing. • Purge Completed Messages: When this option is selected, Service Bus purges resequenced messages that have completed processing from the resequencer database. Monitoring Resequencing Groups 6-3 Monitoring Resequencing Groups and Messages For information about configuring global settings, see Viewing and Configuring Operational Settings. Note: If you want to monitor successful as well as faulted instances for resequencing, enable execution tracing for the pipeline as well. 6.3 Monitoring Resequencing Groups and Messages You can monitor resequenced messages from the Service Bus Home page on the Resequence Messages tab. The Resequence Messages page lets you search for specific groups or components to monitor, and you can filter the results by the message state. Use this page to see whether any messages have faulted or if all groups are processing messages normally. 6.3.1 Monitoring Resequencing Groups and Messages Information you can monitor for resequenced messages includes the group and message ID, the service processing the message and the project to which it belongs, the current message status, and the name of the WSDL operation, if any. The following figure shows the Resequence Messages page. Figure 6-1 Resequence Messages Page To monitor resequencing groups and messages: 1. In Fusion Middleware Control, expand SOA and select service-bus. 2. Click the Resequence Messages tab. 3. To list only specific groups, enter any of the following search criteria: • In the Resequencing Group field, enter the name of the group whose messages you want to monitor. 6-4 Administering Oracle Service Bus Monitoring Resequencing Groups and Messages • In the Name field, click the Browse icon to search for and select a Service Bus pipeline whose associated resequencing messages you want to monitor. • In the State field, select one or more states from the drop-down list of options. Note: By default, Faulted and Running are both selected. You can only view completed messages if Purge Completed Messages is not selected on the Global Settings page. Any messages that were completed while the purge option was selected cannot be viewed here. • Click Reset to remove the search filters and display all resequencing messages. 4. Click Search. A list of resequencing messages matching your criteria appears in the Resequencing Messages table. For information about the fields shown, see the online help for this page. For information about message states, see Oracle Service Bus Resequencing Message States. 5. Perform any of these additional steps: • Viewing Information About a Resequencing Group • Skipping Message Sequence IDs • Recovering when a Resequencing Group Times Out • Recovering from Resequencing Faults 6.3.2 Viewing Information About a Resequencing Group Clicking a group ID in the Resequencing Messages table opens a Resequencing Group dialog, which displays a message indicating whether the group is processing messages successfully. The Resequencing Group dialog provides the following information about a group and varies based on the state of the group: • Whether the group is timed-out or faulted • The blocking message in the group, if any • The next message to be processed after the group is unlocked • The time after which the processing of the messages in the group stopped • The instruction text to unlock the group To view information about a resequencing group: 1. Display the Resequence Messages tab, as described in Monitoring Resequencing Groups and Messages. 2. Click the name of the group with the message ID you want to view. The Resequencing Group dialog appears. Monitoring Resequencing Groups 6-5 Managing Resequencing Groups at Runtime 3. Perform any of the tasks described in Managing Resequencing Groups at Runtime to handle resequencing issues. If the selected message is being processed, the dialog simply states that the groups is now processing messages. 6.4 Managing Resequencing Groups at Runtime When resequencing groups experience message errors, database errors, or time outs, Service Bus provides ways to recover from, and in some cases fix, the issues. You can skip messages in a group that are stuck and are blocking the group from processing additional messages, and you can modify the payload for faulted messages and attempt to reprocess them. The following sections describe ways to fix and recover from resequencing issues. 6.4.1 Skipping Message Sequence IDs For standard resequencer groups, the Resequencing Group dialog provides an option to skip the next sequence ID and resume processing from the following message in the sequence. This is useful when a group is still running, but might be waiting for a message that will never arrive. The standard resequencer holds back messages in the database until it can produce the right sequence for the different groups. If the message with the next sequence ID for a given group never arrives, the pending messages for that group are held back until someone manually unlocks the group and skips to the next message. Note: When you manually skip a sequence ID and the missing message with that ID subsequently arrives, you need to manually execute the message in Fusion Middleware Control if you want to process it. The message is not automatically recovered. To skip a message in a resequencing group: 1. Display the Resequence Messages tab, as described in Monitoring Resequencing Groups and Messages. 2. Click the name of a standard resequencing group. The Resequencing Group dialog appears. 3. To skip the current sequence ID and start processing the next available instances in the group, click Skip. 6.4.2 Recovering when a Resequencing Group Times Out A group is in the timed-out state when processing of the group stops while waiting for an expected message, blocking any remaining messages in the group. You can skip to the next sequence ID to unblock the group. The following information is displayed for a timed-out group: • The sequence ID of the last processed message • The sequence ID of the next message to be processed, along with its instance ID 6-6 Administering Oracle Service Bus Managing Resequencing Groups at Runtime Note: When you manually skip a sequence ID and the missing message with that ID arrives after the timeout, you need to manually execute the message in Fusion Middleware Control. It is not automatically recovered. To recover from a group time out: 1. Display the Resequence Messages tab, as described in Monitoring Resequencing Groups and Messages. 2. Click the name of a group that has timed out. The Resequencing Group dialog appears, as shown in Figure 6-2. Figure 6-2 Resequencing Group is Timed Out 3. To unlock the group and start processing the next available instances in the group, click Skip. 6.4.3 Recovering from Resequencing Faults A group is in the faulted state when one of its messages throws an error while being processed. When a fault occurs, you can fix and retry the message, or you can cancel processing of the message. For resequencing groups with faults, the Resequencing Group dialog lists the following information for a faulted group: • The last time a message was processed • The sequence ID of the faulted message • The sequence ID of the next message to processed, along with its instance ID • Payload To recover from a resequencing fault: 1. Display the Resequence Messages tab, as described in Monitoring Resequencing Groups and Messages. 2. Click the name of a group with a status of Faulted. The Resequencing Group dialog appears, as shown in Figure 6-3. Monitoring Resequencing Groups 6-7 Managing Resequencing Groups at Runtime Figure 6-3 Resequencing Group Is Faulted 3. Do one of the following: • To recover the message, modify the text of the payload to correct the error and then click Recover. • To cancel processing of the message and move on to the next, click Abort. 6-8 Administering Oracle Service Bus 7 Configuring and Monitoring Log Files This chapter describes how to monitor your Oracle Service Bus services using diagnostic log files. Service Bus logging is based on Oracle Diagnostic Logging (ODL). This chapter includes the following sections: • Introduction to Oracle Service Bus Logging • Configuring Diagnostic Logging for Oracle Service Bus • Viewing Diagnostic Log Files for Oracle Service Bus • Oracle Service Bus Loggers • Log Configuration After Upgrading from 11g For information about ODL and diagnostic log files, see "Managing Log Files and Diagnostic Data" in Administering Oracle Fusion Middleware. For information about the messages that Service Bus generates, see Error Messages. 7.1 Introduction to Oracle Service Bus Logging Service Bus components generate log files containing messages that record all types of events, including startup and shutdown information, errors, warning messages, access information on HTTP requests, and additional information. Service Bus uses Oracle Diagnostic Logging (ODL) to define the standard format, content, and file-handling of diagnostic log files. In addition to logging standard actions, Service Bus adds entries to the diagnostic log file for any pipelines and split-joins that have log actions and that have logging enabled. ODL allows you to limit the amount of diagnostic information saved, including the maximum log file size. It provides several log handlers to manage log messages for individual product components, and also provides a standard log message format. 7.1.1 ODL Log Files The ODL framework writes diagnostic log messages to domain_name/servers/ server_name/logs/server_name-diagnostic.log This file is the default log file for all ODL loggers. You can create new log files and change the location of the log files. Once a log file reaches a specified size, it is renamed and a new log file is created. Once total log file storage reaches a specified size, the oldest log file is removed. 7.1.2 ODL Logging Levels The ODL logging level specified for a log handler determines the amount of information written to the log files. Log levels include a message type and a message level. Enabling logging at a specific level also enables logging at all higher levels. The following message types are defined for ODL: Configuring and Monitoring Log Files 7-1 Introduction to Oracle Service Bus Logging • INCIDENT_ERROR • ERROR • WARNING • NOTIFICATION • TRACE The message level further qualifies the message type, indicating the degree of severity of the message. The value is an integer from 1, indicating the highest severity, to 32, indicating the lowest severity. The message type and level together then map to levels defined in java.util.logging.Level. For example, TRACE:32 maps to FINEST, NOTIFICATION:1 maps to INFO. Fusion Middleware Control displays the mapping on the Log Configuration page. Logging levels are described in greater detail in "Setting the Level of Information Written to Log Files" in Administering Oracle Fusion Middleware. 7.1.3 ODL Message Format All products write ODL log messages in a standard format for easier readability. The format is: [timestamp] [component id] [messagetype:level] [message-id] [module id] ([fieldname: field-value])* message-text [supplemental-detail] For more information about the log entry format, including descriptions of all message components, see "Understanding ODL Messages and ODL Log Files" in Administering Oracle Fusion Middleware. 7.1.4 ODL Log Configuration You can configure the ODL log files and log levels using Fusion Middleware Control, WLST commands, or by modifying logging.xml directly (the last method is not recommended). When you update the log configuration, the changes take effect immediately with no server restart required. Using Fusion Middleware Control or WSLT commands, you can view and search log files, create new log files, change the location of log files, change the severity of each logger, and so on. The logging.xml file is located in domain_name/config/fmwconfig/servers/ server_name. By default, there are no logger entries in this file specific to Service Bus, so if you choose to modify logging using this method, you need to add in the Service Bus loggers manually. For lists of loggers, see Oracle Service Bus Loggers. 7.1.5 Oracle Service Bus Loggers Service Bus includes a variety of loggers to handle messages for various modules. These loggers are all located in the oracle.osb parent logger. You cannot configure the oracle.osb logger; it inherits its configuration from the oracle parent logger. You can view and configure these loggers in Fusion Middleware Control or using WLST commands. For a complete list of Service Bus loggers, see Oracle Service Bus Loggers. 7-2 Administering Oracle Service Bus Configuring Diagnostic Logging for Oracle Service Bus Note: Service Bus provides debug loggers in the oracle.osb parent logger for backwards compatibility only. 7.2 Configuring Diagnostic Logging for Oracle Service Bus The easiest ways to configure the Service Bus loggers are using Fusion Middleware Control or using WLST commands. • About Service Bus Logging in Fusion Middleware Control • Configuring Log Levels and Log Files for Service Bus • Configuring Oracle Service Bus Logging using WLST Commands • Setting Logging Levels for Debugging in Fusion Middleware Control • Setting the Prefix for Oracle Service Bus Error Messages • Configuring Oracle Service Bus for Offline Logging 7.2.1 About Service Bus Logging in Fusion Middleware Control The Log Levels tab on the Log Configuration page in Fusion Middleware Control displays the following information: • A View list for selecting the type of loggers for which to view information. Choose from runtime or persistent state loggers. • A table that displays the logger name, the Oracle Diagnostic Logging (ODL) level for setting the amount and type of information to write to a log file, the log file, and the log level state. The Log Files tab displays the log handlers, the log file paths and names, the format of the log messages, the rotation policies used, and other parameters based on the log file configuration class. 7.2.2 Configuring Log Levels and Log Files for Service Bus You configure log levels and log files for Service Bus using Fusion Middleware Control. To configure log levels and log files: 1. Do one of the following: • From the Service Bus menu, select Logs > Log Configuration. • From the SOA folder in the Target Navigator, right-click service-bus, point to Logs, and select Log Configuration. The Log Configuration page appears. 2. Click the Log Levels tab. 3. In the Logger Name column, expand Root Logger > oracle > oracle.osb. Configuring and Monitoring Log Files 7-3 Configuring Diagnostic Logging for Oracle Service Bus 4. In the Oracle Diagnostic Logging Level (Java Level) column for the Service Bus logger you want to edit, select the level of information to write to the log file. For more information about ODL logging levels, see "Setting the Level of Information Written to Log Files" in Administering Oracle Fusion Middleware. 5. To persist updated log levels so your changes remain after restarting Service Bus, select Persist log level state across component restarts. 6. When you are done making log level changes, click Apply. 7. To create and edit log file configurations, click the name of the log file in the Log File column or click the Log Files tab. The Log File page appears. Changes you make here are not specific to Service Bus. For information about editing log file configurations, see "Configuring Settings for Log Files" in Administering Oracle Fusion Middleware. 7.2.3 Configuring Oracle Service Bus Logging using WLST Commands WLST provides commands for updating the logging configuration for a single server. For information about these commands and how to use them, see "Configuring Settings for Log Files" in Administering Oracle Fusion Middleware. A reference of WLST logging commands is provided in "Logging Custom WLST Commands" in WLST Command Reference for Infrastructure Components. 7.2.4 Setting Logging Levels for Debugging in Fusion Middleware Control Although debugging should be disabled during normal Service Bus operation, you may find it helpful to specify debug logging for specific modules while you are developing and experimenting with your solution. For example, you may want to turn on the alert debugging flag when you are developing alerts and want to investigate how the alert engine works. For more information about debugging Service Bus services, see "Using the Oracle Service Bus Debugger" in the Developing Services with Oracle Service Bus. To set logging levels for debugging: 1. In the Target Navigator, expand SOA, right-click service-bus, point to Logs, and then select Log Configuration. 2. On the Log Configuration page, select the Log Levels tab if it is not already displayed. 3. To debug all Service Bus modules, expand Root Logger > oracle and set the oracle.osb logger to TRACE:32 FINEST in the Oracle Diagnostic Logging Level (Java Level) column 4. To debug only specific Service Bus modules, expand oracle.osb and set any of the Service Bus loggers to one of the following levels: • TRACE:1 (FINE) • TRACE:16 (FINER) • TRACE:32 (FINEST) - Most verbose level (recommended for troubleshooting) 5. Click Apply, and then click Close on the confirmation dialog. 7-4 Administering Oracle Service Bus Viewing Diagnostic Log Files for Oracle Service Bus The change takes effect immediately and does not require the server to be restarted. For information about available loggers, see Loggers. 6. When you are done troubleshooting, set the log levels back to their original values. 7.2.5 Setting the Prefix for Oracle Service Bus Error Messages Service Bus generates message IDs prefixed by "OSB" followed by a dash and a 6-digit number; for example, OSB-381202. Previous versions of Service Bus prefixed log messages with "BEA" instead. If you monitor log files or services using third-party tools that expect to find "BEA" in log messages and SOAP faults, those tools may no longer work as expected. To continue using the "BEA" prefix in Service Bus messages, set the following system property at runtime: -Dcom.oracle.sb.MsgIdPrefixCompatibilityModeEnabled=true You can set this property in the WebLogic Server Administration Console on the Configuration > Server Start page for the Service Bus server. 7.2.6 Configuring Oracle Service Bus for Offline Logging When you are working with Service Bus offline instead of running in an application server, the logging environment is not automatically configured. To configure offline logging, you need to configure the logging.xml file manually and set the following two system properties: -Djava.util.logging.config.class=oracle.core.ojdl.logging.LoggingConfiguration -Doracle.core.ojdl.logging.config.file=logging.xml logging.xml is the path and name of the logging.xml file that you configured for offline logging. 7.3 Viewing Diagnostic Log Files for Oracle Service Bus You can view log files using Fusion Middleware Control or the WLST displayLogs command, or you can download log files to your local client and view them using another tool (for example, a text editor or another file viewing utility). 7.3.1 Viewing Oracle Service Bus Log Files in Fusion Middleware Control For more information about viewing server and domain log files in Fusion Middleware Control, see "Viewing and Searching Log Files" in Administering Oracle Fusion Middleware. To view Service Bus log messages: 1. Do one of the following: • From the Service Bus menu, select Logs > View Log Messages. • From the SOA folder in the Target Navigator, right-click service-bus, point to Logs, and select View Log Messages. The Log Messages page appears. 2. In the Search section, filter the log messages you want to view by date, message type, or message content, and then click Search. Configuring and Monitoring Log Files 7-5 Viewing Diagnostic Log Files for Oracle Service Bus A list of log messages matching the criteria appears in the table. For more information about the search criteria on this page, see the online help for the page and "Searching Log Files" in Administering Oracle Fusion Middleware. 3. Select a message in the table to view more information in the lower panel of the page. 4. Do any of the following: • To group messages by message attributes, such as ECID, message type, or target, select the combination of attributes in the Show field. • To group messages by the time they were processed, click View Related Messages and select By Time. • To group messages by ECID, click View Related Messages and select By ECID. • To export the messages to a file, click Export Message to File and then select the type of file (text, XML, or comma-separated). • To change the refresh rate for messages, click in the refresh field and select a 30second refresh rate, 1-minute refresh rate, or manual refresh. 7.3.2 Customizing the Log Message View The View menu above the log file entries lets you select which columns to display and in what order. You can also define how to sort the displayed messages. To customize the view of log messages: 1. 2. 3. To select additional columns to display for each message, do the following: a. Click the View menu, point to Columns, and then select a column name to display. b. Repeat the above step for each column to display. To remove columns from the table, do the following: a. Click the View menu, point to Columns, and then deselect a column name to remove it. b. Repeat the above step for each column to remove. To define how messages are sorted in the list, do the following: a. Click the View menu, point to Sort, and then select Advanced. The Advanced Sort dialog appears, where you can sort by up to three columns. 4. b. Select the first column to sort by and whether to sort in ascending or descending order. c. Repeat the above step for any additional columns to sort by, and then click OK. To display columns in a different order, do the following: a. Click the View menu and select Reorder. 7-6 Administering Oracle Service Bus Oracle Service Bus Loggers The Reorder Columns dialog appears. b. Select a column to reorder and then move it up or down in the list using the arrow buttons on the right. c. Repeat the above step for any additional columns to move, and then click OK. 7.3.3 Viewing Oracle Service Bus Log Files Using WLST Commands WLST provides commands for searching and viewing log messages. For information about these commands and how to use them to view log files, see "Viewing Log Files and Their Messages Using WLST" in Administering Oracle Fusion Middleware. For a reference of WLST logging commands, see "Logging Custom WLST Commands" in WLST Command Reference for Infrastructure Components. 7.4 Oracle Service Bus Loggers The topics in this section list the standard loggers provided with Service Bus and list the debug loggers along with their correspondence to the debug loggers from the previous version. This section contains the following topics: • Service Bus Standard Loggers • Service Bus Debug Loggers in 11g and 12c 7.4.1 Service Bus Standard Loggers The following table lists the standard loggers provided with Service Bus. Table 7-1 Service Bus Standard Loggers oracle.osb.configfwk oracle.osb.mgmt.view.resequencer.ServiceNamesLovM odel oracle.osb.fmwemplugin.core oracle.osb.mgmt.view.resource.ResourceMetricsDetails ViewHandler oracle.osb.mgmt.base.OSBContext oracle.osb.mgmt.view.util.AdfUtil oracle.osb.mgmt.model.OSBModel oracle.osb.owsm.resource.owsm oracle.osb.mgmt.model.monitor.alerts.AlertsHistoryM odel oracle.osb.resources.core.resourcemanagement oracle.osb.mgmt.model.monitor.metrics.ServiceMetrics Helper oracle.osb.security.api.security oracle.osb.mgmt.model.monitor.metrics.ServiceMetrics Model oracle.osb.services.core.initialization oracle.osb.mgmt.model.operations.global.GlobalOperat ionalSettingsModel oracle.osb.statistics.alsbstatistics oracle.osb.mgmt.model.resequencer.ResequencerMode l oracle.osb.transports.dsp.dsptransportmessages oracle.osb.mgmt.model.resource.ResourceMetricsDetail sModel oracle.osb.transports.jca Configuring and Monitoring Log Files 7-7 Oracle Service Bus Loggers oracle.osb.mgmt.model.resource.ResourceOperationalS ettingsModel oracle.osb.transports.mq.mqtransport oracle.osb.mgmt.model.resource.Service oracle.osb.uddi.services.uddiconfiguration oracle.osb.mgmt.model.resource.businessService.Busin essService oracle.soa.resequencer.OSB oracle.osb.mgmt.model.resource.pipeline.Pipeline oracle.soa.resequencer.OSB.container oracle.osb.mgmt.model.resource.proxyService.ProxySe rvice oracle.soa.resequencer.OSB.dao.toplink.service oracle.osb.mgmt.model.resource.splitJoin.SplitJoin oracle.soa.resequencer.OSB.dao.toplink.session oracle.osb.mgmt.model.util.DateUtil oracle.soa.resequencer.OSB.infra.deployment oracle.osb.mgmt.model.util.JMXUtil oracle.soa.resequencer.OSB.management oracle.osb.mgmt.view.common.query.SavedSearchDefi nition oracle.soa.resequencer.OSB.service oracle.osb.mgmt.view.monitor.alerts.AlertsHistoryVie wHandler oracle.soa.resequencer.OSB.service.event oracle.osb.mgmt.view.monitor.metrics.ServiceMetricsV iewHandler oracle.soa.resequencer.OSB.threadpool oracle.osb.mgmt.view.operations.global.GlobalOperati onalSettingsViewHandler oracle.soa.resequencer.OSB.utils oracle.osb.mgmt.view.resequencer.ResequencerViewH andler 7.4.2 Service Bus Debug Loggers in 11g and 12c The following table shows the mapping between the debug loggers previously configured in alsbdebug.xml and configfwkdebug.xml, along with the new ODL debug logger names. Note: The debug loggers listed in the following table are included for backwards compatibility only, and will be deprecated in later releases. Table 7-2 Service Bus Debug Loggers in 11g and 12c 12c Log Handler 11g Log Handler Description oracle.osb.debug.alert-manager alsb-alert-manager-debug Prints an evaluation of alerts. oracle.osb.debug.bpel alsb-bpel-debug oracle.osb.debug.codec alsb-codec-debug oracle.osb.debug.configfwk.compon ent config-fwk-component-debug 7-8 Administering Oracle Service Bus Logs low level debug information about create, update, delete, and import operations. Oracle Service Bus Loggers 12c Log Handler 11g Log Handler Description oracle.osb.debug.configfwk.core config-fwk-debug Logs information on general aspects of Service Bus configuration. oracle.osb.debug.configfwk.deploy ment config-fwk-deployment-debug Logs debug information on session creation, activation, and distribution of configuration in a cluster. oracle.osb.debug.configfwk.persiste nce config-fwk-persistence-debug oracle.osb.debug.configfwk.security config-fwk-security-debug Logs debug information on encryption and decryption during importing and exporting. oracle.osb.debug.configfwk.transact ion config-fwk-transaction-debug Logs low-level debug information about changes made to in-memory data structures and files. This debug flag also generates server startup recovery logs. oracle.osb.debug.configfwk.validati on config-fwk-validation-debug oracle.osb.debug.console alsb-console-debug oracle.osb.debug.custom-resource alsb-custom-resource-debug oracle.osb.debug.debugger alsb-debugger-debug oracle.osb.debug.flow-deployment alsb-flow-deployment-debug oracle.osb.debug.flow-resource alsb-flow-resource-debug oracle.osb.debug.flow-transports alsb-flow-transport-debug oracle.osb.debug.jca-frameworkadapter alsb-jca-framework-adapter-debug oracle.osb.debug.jms-reportingprovider alsb-jms-reporting-provider-debug Logs information on the out of the box, JMS-based reporting provider. oracle.osb.debug.management alsb-management-debug Logs information on user and group management in the console. oracle.osb.debug.managementdashboard alsb-management-dashboard-debug oracle.osb.debug.message-tracing alsb-message-tracing-debug Logs message tracing information. alsb-monitoring-aggregator-debug No longer used. oracle.osb.debug.monitoring alsb-monitoring-debug Logs information on the statistics system. oracle.osb.debug.mqconnection alsb-mqconnection-debug Logs information on MQ connection resources. Logs information on custom resources. Logs information on errors generated in split-joins. Configuring and Monitoring Log Files 7-9 Oracle Service Bus Loggers 12c Log Handler 11g Log Handler Description oracle.osb.debug.pipeline alsb-pipeline-debug Logs information on errors generated in pipelines. oracle.osb.debug.proxy-servermanager alsb-proxy-server-manager-debug Logs information on proxy servers. oracle.osb.debug.resequencer Logs information on message resequencing. oracle.osb.debug.result-caching alsb-result-caching-debug oracle.osb.debug.security-module alsb-security-module-debug oracle.osb.debug.security-wss alsb-security-wss-debug oracle.osb.debug.security-wssowsm-debug alsb-security-wss-owsm-agentdebug oracle.osb.debug,security-wssowsm alsb-security-wss-owsm-debug Logs information on business service result caching. alsb-security-wss-owsm-pm-debug No longer used. oracle.osb.debug.service-accountmanager alsb-service-account-managerdebug Logs information on service accounts. oracle.osb.debug.service-bindinglayer alsb-service-binding-layer-debug oracle.osb.debug.service-providermanager alsb-service-provider-managerdebug Logs information on service providers. oracle.osb.debug.service-repository alsb-service-repository-debug Logs information on various service-related configuration operations. oracle.osb.debug.service-securitymanager alsb-service-security-managerdebug Logs information on access control. alsb-service-validation-debug No longer used. oracle.osb.debug.sources alsb-sources-debug oracle.osb.debug.stages-transformruntime alsb-stages-transform-runtimedebug Logs information on transaction related actions. oracle.osb.debug.test-console alsb-test-console-debug Logs information on test console activities. oracle.osb.debug.throttling alsb-throttling-debug Logs information on the throttling feature. oracle.osb.debug.transports alsb-transports-debug Logs transport-related debug information, including transport headers, printed per-message. oracle.osb.debug.uddi alsb-uddi-debug Logs information on UDDI registries. 7-10 Administering Oracle Service Bus Log Configuration After Upgrading from 11g 12c Log Handler 11g Log Handler Description oracle.osb.debug.wadl-repository NA Logs information on WADL related configuration operation. oracle.osb.debug.ws-policy alsb-wspolicy-repository-debug Logs information on WS policy. oracle.osb.debug.wsdl-repository alsb-wsdl-repository-debug Logs information on WSDL-related configuration operation. 7.5 Log Configuration After Upgrading from 11g When upgrading from Oracle Service Bus 11g, the upgrade process removes the alsbdebug.xml file. If the server was previously configured to enable debug logging through alsbdebug.xml, you need reconfigure logging to enable debug logging again. Table 7-2 lists the new loggers to use. In addition, Service Bus now writes log entries to the diagnostic log file instead of the server log file, so any custom tools used to inspect the log files in version 11g need to be updated. The old file name is server_name.log; the new file name is server_name-diagnostic.log. 7.5.1 Logging Levels Upgrading Service Bus from 11g automatically updates the logging levels in existing Service Bus log messages. The following table describes how the previous log levels map to the new log levels. Table 7-3 Mapping of 11g Log Levels to 12c WLS Severity ODL Message Type: Message Level Integer value trace TRACE:32 295 debug TRACE:1 500 (Level.FINE) info NOTIFICATION:1 800 (Level.INFO) notice WARNING:7 880 warning WARNING:1 900 (Level.WARNING) error ERROR:1 1000 (Level.SEVERE) critical INCIDENT_ERROR:24 1030 alert INCIDENT_ERROR:14 1060 emergency INCIDENT_ERROR:4 1100 7.5.2 Log Message Formatting Logging with ODL means that log messages are formatted differently than in previous versions. The new format is: [timestamp] [component id] [messagetype:level] [message-id] [module id] ([field-name: field-value])* message-text [supplemental-detail Configuring and Monitoring Log Files 7-11 Log Configuration After Upgrading from 11g Table 7-4 shows how previous versions of Service Bus log messages map to the new ODL format. For more information about the log message format, see "Understanding ODL Messages and ODL Log Files" in Administering Oracle Fusion Middleware. Table 7-4 Message Format Mapping to ODL WebLogic Server Format ODL Format Timestamp Timestamp Severity Message Type:Level Subsystem NA Hostname Field-name:field-value (Host ID) Server Name Component ID Thread Field-name:field-value (Thread ID) User ID Field-name:field-value (User ID) Transaction ID NA Diagnostic Context ID Field-name:field-value (Execution Context ID) Raw Time Value NA Message ID Message ID Message Text Message Text 7-12 Administering Oracle Service Bus Part III Managing the Oracle Service Bus Runtime This part describes how to manage running Service Bus services, including updating operational settings, importing and exporting Service Bus configurations, customizing environment variables, and defining security. This part contains the following chapters: • Configuring Operational and Global Settings • Customizing Oracle Service Bus Environments • Importing and Exporting Oracle Service Bus Resources • Defining Access Security for Oracle Service Bus 8 Configuring Operational and Global Settings This chapter describes the settings that control the operation of Oracle Service Bus services in the runtime, including monitoring, alerts, message tracing, execution tracing, alerts, reporting, logging, and business service performance tuning. Certain operational settings are set at the service level, some are set at the global level, and some need to be set at both the service and global level in order to take effect. This chapter includes the following sections: • Introduction to Operational Settings • Viewing and Configuring Operational Settings • Making Bulk Updates to Operational Settings • Preserving Operational Settings During Resource Imports 8.1 Introduction to Operational Settings By configuring operational settings in Fusion Middleware Control, you can control the state of each individual service and of all services globally. Along with controlling the state of each service and all services in a domain, operational settings let you enable and disable monitoring, alerting, reporting, and logging features. You can also manage business services by specifying how to handle offline endpoint URIs, limiting the message flow, and enabling result caching. Global operational settings override service-level settings. 8.1.1 Available Operational Settings Operational settings let you configure things like monitoring, alerts, reporting, logging, message tracing, and business service result caching. You can specify operational settings for all services, at the service and global level, and use the global settings to turn on and off monitoring, SLA alerts, pipeline message reporting, and pipeline message logging. The available settings are described in the following sections. 8.1.1.1 State This operational setting enables or disables a service. By default, the state of all services is enabled. 8.1.1.2 Monitoring This operational setting enables or disables service monitoring. For pipelines and splitjoins, you can also configure the level at which monitoring is performed. Certain other Configuring Operational and Global Settings 8-1 Introduction to Operational Settings operational settings, such as logging and alerts, rely on monitoring being enabled. By default, monitoring is disabled for all services. For pipelines, monitoring can be enabled at the following levels. • Action (A) • Pipeline (P) • Service (S) For split-joins, monitoring can be enabled at the following levels. • Activity (A) • Branch (B) • Service (S) You configure the level on the pipeline or split-join Properties page, and the level indicator is displayed on the Service Bus and Service Bus Project Operations pages. 8.1.1.3 Aggregation Interval This operational setting defines the aggregation interval for the service in hours and minutes. The aggregation interval is the time period over which statistical data is collected and displayed. The default interval is 10 minutes. 8.1.1.4 Service-Level Agreement Alerts This operational setting enables service-level agreement (SLA) alerting for services at a specific severity level or above. You can also use this to disable SLA alerting for a service. By default, SLA alerting is enabled for all services. SLA alerting can be enabled at the following levels. You configure the alerting level on the service's Properties page, and the level indicator is displayed on the Service Bus and Service Bus Project Operations pages. • Normal (N) • Warning (W) • Minor (Mn) • Major (Mj) • Critical (C) • Fatal (F) 8.1.1.5 Pipeline Alerts This operational setting enables alerting for pipelines at a specific severity level or above. You can also use this to disable pipeline alerting. By default, pipeline alerts are enabled at the Normal level or higher. For more information about monitoring pipeline alerts, see Monitoring Oracle Service Bus Alerts. For information about configuring alerts, see Reporting Actions and Adding Alert Actions in Developing Services with Oracle Service Bus. Pipeline alerting can be enabled at the following levels. You configure the level on the pipeline's Properties page, and the level indicator is displayed on the Service Bus and Service Bus Project Operations pages. 8-2 Administering Oracle Service Bus Introduction to Operational Settings • Normal (N) • Warning (W) • Minor (Mn) • Major (Mj) • Critical (C) • Fatal (F) 8.1.1.6 Reporting This operational setting enables or disables message reporting for pipelines. In Service Bus, message data can be captured from the message body and other message variables. This data is then delivered to one or more reporting providers. Information about SLA violations is also included in the reporting data. By default, reporting is enabled at the Normal level or higher. 8.1.1.7 Logging This operational setting enables logging at a specific severity level or above for pipelines and split-joins. The severity level of the log actions in the pipeline or splitjoin must match the Logging severity level on that pipeline's or split-join's operational settings. By default, logging is enabled at the Debug level or higher. Logging can be enabled at the following levels. You configure the level on the Properties page for the pipeline or split-join, and the level indicator is displayed on the Service Bus and Service Bus Project Operations pages. • Debug (D) • Info (I) • Warning (W) • Error (E) To see log data in the log file or standard out (server console), Oracle WebLogic Server logging must be set to specific severity levels. For more information, see Configuring Message Tracing for a Service. 8.1.1.8 Execution Tracing This operational settings enables or disables execution tracing for pipelines and splitjoins. Service Bus lets you trace messages without having to shut down the server, making it easier to troubleshoot and diagnose a message flow. By default, execution tracing is disabled. After you enable execution tracing, the system logs various details culled from the pipeline context and the message context. These details include: stage name; pipeline or route node name; and the current message context. For tracing to appear in the log file or standard out (server console), Oracle WebLogic Server logging must be set to the Info severity level. For more information about execution tracing, see Using Execution Tracing to Diagnose Problems. 8.1.1.9 Message Tracing This operational setting enables or disables message tracing for services at a specific detail level or above. You can also set the payload limit (in kilobytes) and the default encoding. By default, message tracing is disabled. Configuring Operational and Global Settings 8-3 Introduction to Operational Settings For tracing to appear in the log file or standard out (server console), Oracle WebLogic Server logging must be set to the Info severity level. For instructions on configuring message tracing, see Configuring Message Tracing for a Service. Additionally, you must provide the default encoding of the payload. For example, if the payload is in Shift_JIS encoding, specify that in the Default Encoding field to ensure that those bytes are converted to UTF8 in the log file. 8.1.1.10 Offline Endpoint URIs This operational setting enables or disables non-responsive endpoints for business services. When you select this option, the business service removes non-responsive endpoint URIs (takes them offline), at runtime, so that only the responsive URIs are used for retry attempts and for processing subsequent requests. You can specify the interval of time to wait before retrying the offline endpoint URI. You can enable or disable offline URIs for business services only. By default, offline endpoint URIs are disabled. For more information about offline endpoint URIs, see Monitoring and Managing Endpoint URIs for Business Services For instructions on marking endpoint URIs offline, see Configuring Service Bus to Take Unresponsive Endpoint URIs Offline. 8.1.1.11 Throttling Settings You can restrict the flow of messages through a business service by enabling throttling for the service and configuring concurrency, the throttling queue, and a time to live (TTL) for queued messages. Throttling properties include the following: • Throttling State: This operational setting enables or disables throttling for a business service. By default, throttling is disabled. • Maximum Concurrency: This operational setting restricts the number of messages that can be concurrently processed by a business service. The default number of messages is 0 (zero), indicating no limit. • Throttling Queue: This operational setting restricts the maximum number of messages in the throttling queue. The default number of messages is 0 (zero), indicating no limit. • Message Expiration: The maximum time interval (in milliseconds) for which a message can be placed in throttling queue. The default number of messages is 0 (zero), indicating no limit. For more information about throttling business services, see Configuring Business Services for Message Throttling. 8.1.1.12 Result Caching State This operational setting enables or disables result caching for a business service. By default, result caching is enabled globally. For more information about result caching, see "Improving Performance by Caching Business Service Results" in Developing Services with Oracle Service Bus. 8-4 Administering Oracle Service Bus Introduction to Operational Settings 8.1.1.13 Automatic Service Migration Automatic Service Migration (ASM) leverages the WebLogic service migration framework to migrate services from servers that are down due to failure or maintenance to other available servers in the cluster. Note: This SOA Suite feature is part of Oracle Integration Continuous Availability. Please refer to the Oracle Fusion Middleware Licensing Information User Manual for more details on Oracle SOA Suite for Middleware Options. Service Bus supports ASM for the following: • Singleton services, such as the Aggregator and the SLA Alert Manager • The File, FTP, SFTP, and Email poller transports. These transports are cluster singleton services that run on only one managed server in a cluster. Note: ASM is only available for clustered domains. It has no effect in single-node domains. See Prerequisites to Enabling Automatic Service Migration for prerequisites to enabling ASM. Refer to Configuring Operational Settings at the Global Level to enable ASM. When the ASM option is enabled, Service Bus deploys an app-scoped singleton service for the Aggregator service and each poller proxy service with a target of the preferred managed server first and the cluster second. Both the Aggregator service and the poller proxy services are eligible for migration to any server in a cluster; there are no sub-sets of servers in the cluster for service migration. A service’s polling will start on the preferred managed server initially. When the preferred managed server goes down, the services target managed servers available in the cluster sequentially. Even if the preferred managed server comes up in between, polling may not start on that server. All servers must be restarted after enabling ASM before processing messages. Tip: It is best practice to ensure that all managed servers are not running before enabling ASM. This avoids any ambiguous situations for message processing, particularly for poller transports. After the ASM option is selected and the managed servers are restarted, performing these actions on poller proxy services in the Service Bus console has the following results: • Create: A new app-scoped singleton service is created for the new service. • Update/Rename/Move: A new app-scoped singleton service is created for that service and; the old singleton is undeployed and its files are deleted. • Delete: The singleton for that service is undeployed and its files are deleted. Configuring Operational and Global Settings 8-5 Introduction to Operational Settings • Clone: A new app-scoped singleton service is created for the cloned service; the singleton for original service still exists. • Undo: Undoes the most recent change. When the ASM option is disabled (after previously being enabled), Service Bus undeploys the singleton services that were created for the poller transports and deletes all files associated with them. All servers must be restarted after disabling ASM before these changes take effect. ASM does not affect synchronous services, such as EJB, JEJB, and HTTP services. In these cases, the client receives and exception during invocation if the service is not available; the client must send the request again or the retry option must be configured, if available. See Service Migration in Administering Clusters for Oracle WebLogic Server for additional information about the WebLogic Server service migration framework. 8.1.1.13.1 Prerequisites to Enabling Automatic Service Migration Before enabling Automatic Service Migration in Enterprise Manager, update the Migration Basis for services and configure the alert store to use a WLDF JDBC-based store. To complete the prerequisite tasks: 1. Update the Migration basis in the WebLogic Administration Console, as described in the Leasing for Migratable Services topic in Administering Clusters for Oracle WebLogic Server. For production environments, Database leasing is recommended. 2. Configure the Alert store to use a WLDF JDBC-based store instead of a file-based store. Note: If this store is not migrated, SLA and pipeline alerts will not be visible in the event that the Aggregator is migrated to a new server. For example, if the Aggregator singleton is migrated from Server 1 to Server 2, and then back to Server 1, the alerts from Server 1 are visible again, but the alerts from Server 2 are not visible. 8.1.1.14 JavaScript Timeout The JavaScript timeout is a value defining the time interval after which any JavaScript execution will be aborted with an error. The default value is 30 seconds. 8.1.1.15 Resequencer Settings For services that use the resequencer to put messages in sequence, you can configure the resequencer settings, including the length of time the locker thread waits when it is unable to find a group with messages to process and the maximum number of resequencer groups to retrieve at one time. You can also configure the resequencer to purge messages that have been processed from the resequencer database. 8.1.2 Global and Service-Level Operational Settings The runtime effects of the service-level settings depend on their corresponding global settings. You must enable both the global and service-level settings for a service to be completely enabled at runtime. The service state must also be enabled. You can change 8-6 Administering Oracle Service Bus Viewing and Configuring Operational Settings and save monitoring configuration settings even if the service will be not be enabled at runtime. For example, you can change and save the aggregation interval even if service monitoring is disabled. In this manner, you can edit settings and later enable them. When you enable or disable monitoring at the global level, it enables or disables monitoring for all services that have individually been enabled for monitoring. If monitoring for a particular service has not been enabled, you must first enable it and set the aggregation interval for that specific service before the system starts collecting statistics for that service. Enable or disable these settings at the global level in conjunction with the settings at the service level to effectively enable or disable them. The operational settings at the global level supersede the operational settings at the service level. The following settings must be enabled at the global level in order to be enabled for a specific service: • Monitoring • SLA Alerting • Pipeline Alerting • Reporting • Logging • Result Caching • Automatic Service Migration • JavaScript Timeout 8.2 Viewing and Configuring Operational Settings Use the Operations pages to easily locate proxy services, business services, pipelines, and split-joins, and to specify service-specific operational settings. On the Service Bus or Service Bus Project Operation pages, you can set the aggregation interval, enable settings, and disable settings for multiple services. You can configure operational settings for a single service on that service's Properties page. When you update operational settings from the Service Bus or Service Bus Project Operations pages, you cannot specify an alerting or logging severity level, configure message tracing properties, or configure throttling or endpoint URIs for business services. Keep in mind the following guidelines when configuring operational settings: • In general, properties must be enabled at both the service level and the global level in order to take effect. • Although you can configure SLA Alerts independently from Monitoring, there is an interaction between the two settings at runtime. If global monitoring is enabled, SLA alerts can be enabled or disabled. However, if global monitoring is disabled then SLA alerts are also effectively disabled because SLA alert rule conditions depend on monitoring statistics being evaluated. • If you disable monitoring for all services, all statistics collected so far for those services are deleted as well and the deletion of the statistics is irreversible. Configuring Operational and Global Settings 8-7 Viewing and Configuring Operational Settings Some operational settings such as service state, monitoring, SLA alerting, and pipeline alerting can also be enabled or disabled using public APIs. For more information, see Java API Reference for Oracle Service Bus. 8.2.1 Configuring Operational Settings at the Global Level When you configure an operational setting at the global level (also called global settings), it affects all applicable services in the domain. Most settings must be enabled at both the service and global levels in order to take effect at runtime. Use the Global Settings tab of the Service Bus home page to update settings at the global level. The following figure shows the Global Settings tab. 8-8 Administering Oracle Service Bus Viewing and Configuring Operational Settings Figure 8-1 Global Settings Page To configure operational settings at the global level: 1. In the Target Navigator, expand SOA and then select service-bus. The Service Bus Dashboard appears. 2. Click the Global Settings tab. The Service Bus settings for the domain appears. Configuring Operational and Global Settings 8-9 Viewing and Configuring Operational Settings 3. To enable a setting, select its check box; to disable a setting, clear the check box. Each global setting is described in Table 8-1 4. To revert all unapplied changes back to the saved settings, click Revert. 5. When you are done configuring operation settings, click Apply to save your changes to the runtime. 8.2.2 Operational Settings at the Global Level The following table describes operational settings at the global level. Table 8-1 Operational Settings at the Global Level Operational Settings Usage Monitoring Enabled Enables or disables monitoring for all services in a domain. This option also controls SLA alerting at a global and service level. SLA Alerting Enabled Enables or disables SLA alerting for all services in a domain. To enable SLA alerts, you must also enable global monitoring. Pipeline Alerting Enabled Enables or disables pipeline alerting in a domain. Reporting Enabled Enables or disables message reporting for all pipelines in a domain. Logging Enables or disables logging for all pipelines and split-joins in a domain. Result Caching Enables or disables result caching for business services in a domain. Even though you can configure business services to use result caching, you must enable this global option for result caching to work. If you disable result caching globally, cached results for all business services enabled with result caching are flushed. Automatic Service Migration Enabled Select this check box to enable Automatic Service Migration (ASM). When selected, Service Bus creates and deploys an app-scoped singleton service as an EAR, one for each poller proxy service and the aggregator service, targeted to the preferred managed server and cluster. When the preferred managed server goes down, the poller and the aggregator service target any available server in the cluster sequentially. All servers must be restarted after enabling ASM. Clear this check box and apply the change to undeploy and delete all appscoped singleton services. All servers must be restarted for this change to take effect. JavaScript Timeout Specify the time interval (in seconds) after which any JavaScript execution terminates with an error. The default value is 30 seconds. Resequencer Locker Thread Sleep Specifies the sleep interval for the locker threads in seconds. When the resequencer is unable to find a group with messages that can be processed, the locker thread sleeps for the specified duration. The locker thread does not sleep between each iteration of a database seek, as long as it finds groups with messages that can be processed. The default value is 10. 8-10 Administering Oracle Service Bus Viewing and Configuring Operational Settings Operational Settings Usage Resequencer maximum Groups Locked Specifies the maximum number of resequencer groups that can be retrieved for processing in a single iteration of a database seek. Once retrieved, the groups are assigned to worker threads for processing. Purge Completed Messages Select this option to purge resequenced messages that have completed processing from the resequencer database. 8.2.3 Searching for Services to Configure Their Operational Settings Fusion Middleware Control provides several options for configuring operational settings, but all begin with performing a search for the services you want to configure. Note: The following steps describe how to view and update operational settings for multiple services. You can also view and update settings for a single service on that service's Properties page. To search for services to configure their operational settings: 1. Do one of the following: • To search for services across the domain, in the Target Navigator expand SOA and select service-bus. • To search for services in a Service Bus project, in the Target Navigator expand SOA, expand service-bus, and select the name of the project in which to search. 2. Click the Operations tab. 3. Specify the search criteria to use to locate the services who settings you want to modify. You can specify the following criteria, all of which are optional except Type: • Type: Select from the list of available options, which includes all services, both business and proxy services, business services, proxy services, pipeline, or splitjoins. • Name: Enter the name of the services to locate. • Path: The path (project name and folder names, if any) to the services to locate. If you are on the Service Bus Project Operations tab, the path is already filled in for you. 4. Click Search. A list of services matching your criteria appears in the Operations table, as shown below. For more information about these settings, see Available Operational Settings and the online help provided with Fusion Middleware Control. Configuring Operational and Global Settings 8-11 Viewing and Configuring Operational Settings Figure 8-2 Operations Page 5. To configure operational settings, continue to Enabling and Disabling Operational Settings for Multiple Services 8.2.4 Enabling and Disabling Operational Settings for Multiple Services The settings you can configure for a service vary depending on whether you are configuring a business service, proxy service, pipeline, or split-join. When you configure settings for multiple services, you do so on the Operations tab of the Service Bus or Service Bus Project page. The Operations list on these pages only includes enabling and disabling operational settings. Any settings that require specific configuration, like throttling or offline endpoint URI management, can only be configured on a specific service's Properties page. For information about configuring specific operational settings, see Available Operational Settings and the online help provided with Service Bus. To configure operational settings for multiple services: 1. Perform a search for services, as described in Searching for Services to Configure Their Operational Settings. 2. For any service in the results list, select a check box to enable the corresponding operational setting, or clear a check box to disable the operational setting. 3. To enable or disable an operational setting for all the services in the list, select or clear the check box in the column header for that setting. 8-12 Administering Oracle Service Bus Viewing and Configuring Operational Settings For information about the settings and notations in the Operations list, see Available Operational Settings and the online help provided with Fusion Middleware Control. 4. To revert all unapplied changes back to the saved settings, click Revert. 5. When you are done configuring operation settings, click Apply to save your changes to the runtime. 8.2.5 Enabling and Disabling Operational Settings for a Single Service In addition to enabling and disabling operational settings from the Operations page of the Service Bus or Service Bus Project page, you can also enable and disable settings for a service from its Properties page. For most services, you can also configure the operational settings in more detail, such as setting logging and monitoring levels. For information about configuring specific operational settings, see Available Operational Settings and the online help provided with Service Bus. The following figure shows the Properties page for a service. Figure 8-3 Service Bus Service Properties To enable or disable operational settings for a single service: 1. Perform a search for services, as described in Searching for Services to Configure Their Operational Settings. 2. In the Operations table, click the service you want to configure. The Properties page for that service appears. Configuring Operational and Global Settings 8-13 Viewing and Configuring Operational Settings 3. To enable a setting, select the Enabled check box for that setting. 4. To disable a setting, clear the Enabled check box for that setting. 5. To revert all unapplied changes back to the saved settings, click Revert. 6. When you are done configuring operation settings, click Apply to save your changes to the runtime. 8.2.6 Setting the Aggregation Interval for a Service Use a service's Properties page to set the aggregation interval for that service. The aggregation interval is the period over which aggregated statistics are computed for display in Fusion Middleware Control. The default aggregation interval setting is 10 minutes. To set the aggregation interval for a service: 1. Perform a search for services, as described in Searching for Services to Configure Their Operational Settings. 2. In the Operations table, click the service you want to configure. The Properties page for that service appears. 3. In the Aggregation Interval field under Monitoring, select the number of hours or minutes for the interval. If your selection for hours exceeds 1, then the default selection for minutes is always zero. However, if your selection for hours is 0 or 1, then you can configure intervals in terms of minutes. 4. When you are done configuring operation settings, click Apply to save your changes to the runtime. 8.2.7 Configuring the Monitoring Level for a Pipeline or Split-Join For pipelines and split-joins, you can specify the level at which the services are monitored. For more information, see Monitoring and the online help provided with Service Bus. To configure the monitoring level for a service: 1. Perform a search for services, as described in Searching for Services to Configure Their Operational Settings. 2. In the Operations table, click the pipeline or split-join you want to configure. The Properties page for that service appears. 3. In the Monitoring Level field under Monitoring, do the following: • For a pipeline, select Service, Pipeline, or Action to indicate the level. • For a split-join, select Service, Branch, or Activity to indicate the level. 4. To revert all unapplied changes back to the saved settings, click Revert. 5. When you are done configuring operation settings, click Apply to save your changes to the runtime. 8-14 Administering Oracle Service Bus Viewing and Configuring Operational Settings 8.2.8 Configuring Message Tracing for a Service After you enable message tracing for a proxy service, the system logs messages exchanged between the pipeline and the proxy service, including inbound request and response as well as outbound request and response messages. After you enable message tracing for a business service, the system logs messages exchanged between the pipeline and the business service (outbound request and response messages). When applicable, logged outbound messages can also include the retry number, error code, and error message. In order for the tracing information to be logged to the server log file or server console, you must also configure the severity level for Oracle WebLogic Server logging. To set Oracle WebLogic Server log levels: To see tracing in the log file or standard out (server console), Oracle WebLogic Server logging must be set to the following severity levels: • Minimum severity to log: Info • Log file: Info • Standard out: Info For information on setting log severity levels, see "Using Log Severity Levels" in Configuring Log Files and Filtering Log Messages for Oracle WebLogic Server. To enable message tracing for a service: 1. Perform a search for services, as described in Searching for Services to Configure Their Operational Settings. 2. In the Operations table, click the service you want to configure. The Properties page for that service appears. 3. Next to Message Tracing, select Enabled. 4. From the Tracing Detail Level list, select the level of detail from among the following: • Terse: Display the date, time, service type, service name, and URI. • Headers: Display terse information along with the XML representation of the message metadata. • Full: Display the headers information along with the raw payload, including attachments if any. 5. If you selected Full from the Detail Level list, do the following: • In the Payload Tracing Unit field, specify the maximum size (in kilobytes) for the message payload. • In the Default Encoding field, specify the default encoding for logging the payload. This can be useful when logging binary payloads or SOAP messages with binary attachments.The default encoding value can be Base64 or any Javasupported encoding. Configuring Operational and Global Settings 8-15 Viewing and Configuring Operational Settings Note: If you leave the Default Encoding field empty, Service Bus uses the host's default encoding for the payload. The default encoding depends on a combination of the JVM, the underlying operating system (OS), and OS-level locale settings. If the setting specified in the Default Encoding field cannot be used (for example, it is not a valid option for the configuration), Service Bus uses Base64 encoding for the payload. • Click Apply. 8.2.9 Configuring the SLA Alert Level for a Service You can configure the alert level for SLA alerts for a service. For more information, see Service-Level Agreement Alerts and the online help provided with Service Bus. To configure the SLA alerting level for a service: 1. Perform a search for services, as described in Searching for Services to Configure Their Operational Settings. 2. In the Operations table, click the service you want to configure. The Properties page for that service appears. 3. In the SLA Severity field under SLA Alerting, select the level at which you want to start generating alerts. 4. To revert all unapplied changes back to the saved settings, click Revert. 5. When you are done configuring operation settings, click Apply to save your changes to the runtime. 8.2.10 Configuring the Pipeline Alert Level You can configure the alert level for pipeline alerting for a service. For more information, see Pipeline Alerts and the online help provided with Service Bus. To configure the pipeline alerting level for a service: 1. Perform a search for services, as described in Searching for Services to Configure Their Operational Settings. 2. In the Operations table, click the service you want to configure. The Properties page for that service appears. 3. In the Pipeline Severity field under Pipeline Alerting, select the level at which you want to start generating alerts. 4. To revert all unapplied changes back to the saved settings, click Revert. 5. When you are done configuring operation settings, click Apply to save your changes to the runtime. 8-16 Administering Oracle Service Bus Making Bulk Updates to Operational Settings 8.2.11 Configuring the Logging Level for a Service You can configure the logging level for pipelines and split-joins. For more information, see Logging and the online help provided with Service Bus. To configure the logging level for a service: 1. Set the Oracle WebLogic Server log levels, as described in To set Oracle WebLogic Server log levels: 2. Perform a search for services, as described in Searching for Services to Configure Their Operational Settings. 3. In the Operations table, click the service you want to configure. The Properties page for that service appears. 4. In the Logging Level field under Logging, select the level at which you want generate log entries. 5. To revert all unapplied changes back to the saved settings, click Revert. 6. When you are done configuring operation settings, click Apply to save your changes to the runtime. 8.2.12 Configuring Throttling for a Business Service Business service throttling is described in Configuring Business Services for Message Throttling. For information and instructions on configuring throttling, see Configuring Throttling for a Single Business Service. 8.2.13 Configuring Offline Endpoint URI Handling for a Business Service Managing offline endpoint URIs is described in Monitoring and Managing Endpoint URIs for Business Services. For information and instructions on configuring endpoint URI handling, see Configuring Service Bus to Take Unresponsive Endpoint URIs Offline. 8.3 Making Bulk Updates to Operational Settings Service Bus lets you create configuration files that you can use to update certain environment values that are likely to change when you move a project from one domain to another, such as moving from a development to a testing environment. This includes updating operational settings at both the global and service levels. For information about creating and executing configuration files, see Configuring Service Bus to Take Unresponsive Endpoint URIs Offline. 8.4 Preserving Operational Settings During Resource Imports When you import Service Bus configuration JAR files in Oracle JDeveloper, the Oracle Service Bus Console, or Fusion Middleware Control, the domain-level settings can be overwritten if the configuration being imported also contains the global settings of the domain from which it is being imported. Select the Preserve Operational Settings flag when importing the service to retain the global settings in the configuration being imported. This overwrites the global settings of the existing system. The same applies for the operational settings for individual services when the service is updated by an import process. Configuring Operational and Global Settings 8-17 Preserving Operational Settings During Resource Imports You can also preserve operational settings when importing Service Bus configurations using APIs. For more information, see the ALSBConfigurationMBean documentation in the Java API Reference for Oracle Service Bus. Modify the MBean as shown in the following example to preserve the settings during the import. Example - Preserve Operational Settings During the Import of Oracle Service Bus Configurations Through APIs /** // Imports a configuration jar file, applies customization, activates it and exports the resources again // @throws Exception / static private void simpleImportExport(String importFileName, String passphrase) throws Exception { SessionManagementMBean sm = ... // obtain the mbean to create a session; // obtain the raw bytes that make up the configuration jar file File importFile = new File(importFileName); byte[] bytes = readBytes(importFile); // create a session String sessionName = "session." + System.currentTimeMillis(); sm.createSession(sessionName); // obtain the ALSBConfigurationMBean that operates on the // session that has just been created ALSBConfigurationMBean alsbSession = getConfigMBean(sessionName); // import configuration into the session. First we upload the // jar file, which will stage it temporarily. alsbSession.uploadJarFile(bytes); // then get the default import plan and modify the plan if required ALSBJarInfo jarInfo = getImportJarInf(); ALSBImportPlan importPlan = jarInfo.getDefaultImportPlan(); // preserve operational values importPlan. setPreserveExistingOperationalValues(true); // Modify the plan if required and pass it to importUploaeded method ImportResult result = alsbSession.importUploaded(importPlan); // Pass null to importUploaded method to mean the default import plan. //ImportResult result = alsbSession.importUploaded(null); // print out status if (result.getImported().size() > 0) { System.out.println("The following resources have been successfully imported."); for (Ref ref : result.getImported()) { System.out.println("\t" + ref); } } if (result.getFailed().size() > 0) { System.out.println("The following resources have failed to be imported."); for (Map.Entry e : result.getFailed().entrySet()) { Ref ref = e.getKey(); // Diagnostics object contains validation errors // that caused the failure to import this resource Diagnostics d = e.getValue(); System.out.println("\t" + ref + ". reason: " + d); } // discard the changes to the session and exit System.out.println("Discarding the session."); sm.discardSession(sessionName); System.exit(1); } // peform the customization to assign/replace environment values and // to modify the references. 8-18 Administering Oracle Service Bus Preserving Operational Settings During Resource Imports ... // activate the session sm.activateSession(sessionName, "description"); // export information from the core data ALSBConfigurationMBean alsbcore = getConfigMBean(null); //export the information at project level, pass only a collection of project refs to this method byte[] contentsProj = alsbcore.exportProjects(Collections.singleton(Ref.DEFAULT_PROJECT_REF),null); // the byte contents can be saved as jar file } Configuring Operational and Global Settings 8-19 Preserving Operational Settings During Resource Imports 8-20 Administering Oracle Service Bus 9 Customizing Oracle Service Bus Environments This chapter provides details on customizing a Service Bus environment by finding and replacing the values of environment variables associated with different resources, and by creating configuration files that make automated changes to resources and environment values when moving a Service Bus configuration from one environment to another. This chapter includes the following sections: • About Environment Values • Finding and Replacing Environment Values Using the Oracle Service Bus Console • Using Configuration Files to Update Environment Values and Operational Settings • Available Environment Values • Environment Values for Operational Settings • Sample Configuration Files 9.1 About Environment Values Environment values represent data in the Service Bus configuration that are likely to change when you move your configuration from one domain to another (for example, from test to production). These are predefined fields, and environment values correspond to the properties you configure when you create a service or resource for Service Bus. Environment values represent entities such as URLs, URIs, file and directory names, server names, email servers, and so on. A good example is the URL of a proxy service, which changes depending on the physical location of the domain. Environment values can be found in alert destinations, proxy services, business services, SMTP Server and JNDI Provider resources, UDDI Registry entries, and transports. As part of deployment, you must update environment values to reflect the values that are relevant to the target system. You can either use the Find and Replace dialog on the Oracle Service Bus Console to update environment values in a domain or you can create and execute a configuration file. The Find and Replace dialog lets you replace entire environment values or just substrings of the values, and it is useful for making minor or small changes. Configuration files let you modify all the environment variables directly, find and replace strings or substrings, update operational settings at the global and service levels, and update references between resources. Customizing Oracle Service Bus Environments 9-1 About Environment Values 9.1.1 Find and Replace Using the Find and Replace dialog in the Oracle Service Bus Console, you can search for environment values in a domain and view a list of matching values. You can also replace a value or part of a value. For example, if you only need to change the server name and port number in all environment values, you can search for old_hostname:old_port and replace it with new_hostname:new_port in all environment values at one time. The Find and Replace dialog does not search operational settings values. Certain environment values are complex XML objects that cannot be found and replaced using the Find and Replace option. However, you can still set these environment values using configuration files. You can also set them directly by using the ALSBConfigurationMBean from a script. For detailed information about ALSBConfigurationMBean, see the Java API Reference for Oracle Service Bus. 9.1.2 Configuration Files Configuration files provide a convenient way to modify your environment during deployment, from development to staging, from staging to production, or during design time. Configuration files are XML-based files that define environment values, operational settings, and reference mappings used by Service Bus. Because they are XML-based, you can easily modify a generated configuration file using an XML editor. By creating and executing a configuration file against a Service Bus instance, you can quickly update the properties that are specific to the environment in which the projects are running without having to update the properties one at a time. You can use a configuration file to perform the following actions against environment variable values: • Replace: When an environment value is replaced, the new environment value replaces the existing value, even if the new value is null. This is the default action if no other action is specified. This action is supported by all environment values. See “Example - Updating Global Operational Settings Using the Replace Action” in Sample Configuration Files for a sample configuration file using the replace action. • Update: When an environment value is updated, the new environment value updates the existing value except if the new value is not specified. If a new value is not specified, the existing value is retained. As the update action replaces only the values you specify, use it instead of the replace action if you want to change only one setting and want to retain the current value for the remaining settings. The update action is only supported by the operational settings environment values (listed in Table 9-2. See “Example - Updating Operational Settings using the Update Action” in Sample Configuration Files for a sample configuration file using the update action. • Add: This adds a new environment value, and typically only applies to environment values that include multiple entries, such as business service endpoint URIs. This action is supported for the Service SLA Alert Rule values. See “Example - Adding and Deleting SLA Alert Rules” in Sample Configuration Files for a sample configuration file using the add action. • Delete: This deletes an existing environment value, and typically only applies to environment values that include multiple entries, such as business service endpoint URIs. This action is supported for the Service SLA Alert Rule values. 9-2 Administering Oracle Service Bus About Environment Values See “Example - Adding and Deleting SLA Alert Rules” in Sample Configuration Files for a sample configuration file using the delete action. • Find and Replace: Define find and replace operations to replace entire environment values or substrings of values. See “Example - Updating Values using the Find and Replace Action” in Sample Configuration Files for a sample configuration file using the find and replace action. You can also define new mappings for references in the configuration file. For example, you can map a proxy service to a different pipeline in the new environment. See “Example - Updating Resource References” in Sample Configuration Files for an example. 9.1.2.1 Schema Files The configuration file is based on several schema files that define the required formatting for the file. The main schema file (Customization.xsd) defines the general format of the configuration file. When you create a configuration file in the Oracle Service Bus Console, most of the necessary syntax is automatically generated for you. The exception to this is if you want to add alert rules using a configuration file. In that case, you can refer to the following schemas: • AlertRule.xsd • AlertRuleCondition.xsd The following files define operational settings for services: • BusinessOperations.xsd • FlowOperations.xsd • PipelineOperations.xsd • ProxyOperations.xsd • DomainConfig.xsd: Describes the global operational settings format. • EnvValues.xsd • JmsEnvValues.xsd The XML schemas are available from the following location in your Service Bus installation: OSB_ORACLE_HOME\lib\servicebus-schemas.jar 9.1.2.2 Operational Settings Operational settings control certain behaviors for Service Bus services at runtime both globally and at the service level. Operational settings include enabling and disabling administrative features, such as monitoring, logging, reporting, and alerts. They also include configuring properties specific to a service, such as throttling and result caching for business services. For more information about operational settings, see Configuring Operational and Global Settings. Operational settings are defined by two environment values, which are included in the configuration file but not in the Find and Replace dialog. The Global Operational Customizing Oracle Service Bus Environments 9-3 Finding and Replacing Environment Values Using the Oracle Service Bus Console Settings variable defines the settings for all Service Bus services. The Service Operational Settings variable defines the settings for a specific service. 9.1.2.3 Environment Values The EnvValueActionsCustomizationType element in the configuration file defines new values for specific properties in each resource. The environment variables you can configure vary depending on the types of resources in the Service Bus environment. 9.1.2.4 Find and Replace The FindAndReplaceCustomizationType element in the configuration file defines find and replace operations for specific environment values. This element defines the query for environment values and then specifies the replacement string for those values. You can further filter your search by the type of resources, environment values, and references to consider, as well as whether to include only modified resources. If you specify a search string and set the isCompletematch flag to false, the matching substring in existing environment values is replaced. If you do not specify a search string, the entire environment value is replaced. This element only supports simple types, such as boolean and string. 9.1.2.5 Reference Mapping The ReferenceCustomizationType element in the configuration file updates references to specific resources. This element lists an existing reference and its path, and then specifies a new reference and path to update any resources that refer to the existing reference. 9.2 Finding and Replacing Environment Values Using the Oracle Service Bus Console Use the Find and Replace feature in the Oracle Service Bus Console to search for environment values in a domain and optionally replace a value with a new value. This feature behaves differently based on whether or not you are in a session. If you are in a session, you can find and replace environment values. However, if you are outside a session, you can only find environment values; Replace All is disabled. Note: Certain environment values are complex XML objects that cannot be found and replaced using the Oracle Service Bus Console. However, you can still set these environment values directly by using the ALSBConfigurationMBean from a script. For detailed information about ALSBConfigurationMBean, see the Java API Reference for Oracle Service Bus. Operational settings also cannot be found and replaced using the console. In addition to setting them through the API, you can set complex type environment values using configuration files. See Using Configuration Files to Update Environment Values and Operational Settings. 9-4 Administering Oracle Service Bus Finding and Replacing Environment Values Using the Oracle Service Bus Console 9.2.1 Finding Environment Values You can perform a search for environment values either from within a session or outside of a session. You can filter your search by a variety of criteria, including the actual value, a variable type, a specific project, and current session or all sessions. To find environment values in the Oracle Service Bus Console: 1. On the Oracle Service Bus Console, click the Admin tab, and then click Find and Replace. The Find and Replace dialog appears. Figure 9-1 Find and Replace Dialog 2. In the Find Value field, enter the environment value that you want to find. You can enter a partial value in this field. For example, entering "fal" displays all environment values that are set to false as well as any other values that contain the string "fal." 3. To locate only items changed in your current session, select Current Session Only. 4. In the Variable Type list, select the type of environment value for which to search. Table 9-1 lists and describes the available types. 5. To locate environment values located in a particular project, select the project name from the Project list. 6. Click Find. A list of matching values appears on the Find and Replace Results tab at the bottom of the page. Customizing Oracle Service Bus Environments 9-5 Finding and Replacing Environment Values Using the Oracle Service Bus Console 9.2.2 Replacing Environment Values When you replace environment values, Service Bus replaces the exact value you enter in the Find Value field with the value you enter in the Replace with field in the values that result from the search. To replace environment values in the Oracle Service Bus Console: 1. Launch the Oracle Service Bus Console. 2. If you want to replace and not just find values, make sure you are in a session. Click Create to create a new session or click Edit to enter an existing session. 3. Click the Admin tab, and then click Find and Replace. The Find and Replace dialog appears. 4. Enter the search criteria for the environment value you want to find, as described in Finding Environment Values. Make sure to enter the exact value you want to replace in the Find Value field. 5. To display a list of environment values in your configuration that match your criteria, click Find. A list of matching values appears on the Find and Replace Results tab at the bottom of the page. 6. In the Replace with field, enter the new environment value that will replace the value you entered in the Find Value field. Figure 9-2 Find and Replace Dialog with Replacement Value 7. To replace the original environment value with the new value in all the search results, click Replace. All occurrences of the value you entered in the Find Value field are replaced with the environment value you entered in the Replace with field in the current session. 9-6 Administering Oracle Service Bus Using Configuration Files to Update Environment Values and Operational Settings 8. To end the session and deploy the configuration to the runtime, click Activate. 9.3 Using Configuration Files to Update Environment Values and Operational Settings Use the Oracle Service Bus Console to generate a configuration file based on your current configuration. Typically, you import Service Bus resources to the new domain, create a configuration file based on just those resources you imported, update the values in the configuration file, and then execute the updated configuration file against the new domain. Configuration files can include customizations for all the environment values found in the resources you selected, including complex environment value types defined in the EnvValueTypes class. The actions you can perform are defined in the EnvValueAction class. In addition, configuration files include a reference customization type for changing resource references within resources with dependencies. For more information about configuration files, see Configuration Files. For information about EnvValueTypes and EnvValueAction, see the Java API Reference for Oracle Service Bus. 9.3.1 Creating a Configuration File The Oracle Service Bus Console provides a convenient way to generate a configuration file for a set of resources or projects that you select. You can then use this file as a starting point for making any needed modifications by specifying the actual values for a specific Service Bus environment. The configuration file generated by Service Bus only includes replace actions. If you want to perform an update, add, or delete action instead, you need to manually update the generated file with the new action. To create a configuration file: 1. On the Oracle Service Bus Console, select the Admin tab, and then click Create Configuration File. The Create Configuration File page appears with a list of objects in your configuration. 2. Select the projects or resources you want to include in the configuration file. a. Click the right arrows to expand the project folders. The name and type for each resource contained in the project appears. b. Select the check boxes associated with the projects or resources you want to include in the configuration file. c. Clear the check boxes associated with the projects or resources that you do not want to include in the configuration file. 3. Click Create. 4. In the File Download dialog box, click Open to open the file or click Save to save the file to your local machine. Customizing Oracle Service Bus Environments 9-7 Available Environment Values 5. In an XML editor, use the customization schema in conjunction with the base configuration file you created to make the necessary modifications to resources and environment variables. Your base configuration file may already be populated with environment variables. Table 9-1 lists the environment variables that are automatically included with different resources. 9.3.2 Executing a Configuration File Once you create a configuration file and update the values for the new domain, you can execute the file that was previously saved on your system. You must be in a session to execute a configuration file. To execute a configuration file: 1. Launch the Oracle Service Bus Console in the environment where you want to apply the environment value updates. 2. If you have not already done so, click Create to create a new session or click Edit to enter an existing session. 3. Click the Admin tab, and then click Execute Configuration File. 4. Click Browse, and navigate to and select a configuration file to execute. 5. Click Next. A summary of changes that will be made by executing the configuration file appears. 6. To configure only resources, services, projects, or folders changed in the current session, select Show Only Items Edited in the Current Session. If you limit configuration to only resources modified in the current session, the Apply To column is updated with the resources modified in current session. If you limit customizations of a project or folder, then the resources modified in current session within that project or folder are displayed in Apply To column. 7. Review all changes listed in the summary to be sure they are correct. 8. Click Finish to commit the updates in the current session. To view configuration details, within the session, the History tab at the bottom of the page, and then click the Customization task. 9. To end the session and deploy the configuration to the runtime, click Activate. 9.4 Available Environment Values The following table lists the environment values you can find, replace, and update in an environment. Environment variables appear on the Find and Replace dialog and in the configuration files you create to update environment properties. In the configuration file, some variables include a location, which is a non-negative integer that represents the index to that value in a list of values. For example, the location for a URI value might specify a particular URI that is associated with a business service with several endpoint URIs. For information about EnvValueTypes, see the Java API Reference for Oracle Service Bus. The Java types and location values of these environment values are described in 9-8 Administering Oracle Service Bus Available Environment Values the API reference. For more information about the values for any of the environment value types, see the online help for the component in which they are found. Table 9-1 Environment Values for Resources Environment Value Found In Description Alert SNMP Trap Alert destination An indicator of whether SNMP trap is enabled for an alert destination. Alert to Log Alert destination An indicator of whether alert logging is enabled for an alert destination. Alert To Reporting Data Alert destination An indicator of whether alert reporting is enabled for an alert destination. Dynamic Queue Pooling MQ connection Email Archive Directory Email proxy service The archive directory for an email proxy service. Email Destination URI Alert destination The URI in an email alert destination. This variable includes a location in the configuration file. Email Download Directory Email proxy service The download directory for an email proxy service. Email Error Directory Email proxy service The error directory for an email proxy service. File Archive Directory File proxy service The archive directory for a file proxy service. File Error Directory File proxy service The error directory for a file proxy service. File Stage Directory File proxy service The stage directory for a file proxy service. FTP Archive Directory FTP proxy service The archive directory for an FTP proxy service. FTP Download Directory FTP proxy service The download directory for an FTP proxy service. FTP Error Directory FTP proxy service The error directory for an FTP proxy service. Http Outbound Connection Timeout HTTP business service Connection timeout interval (in seconds) for an HTTP business service. Http Outbound Socket Read Timeout HTTP business service Read timeout interval (in seconds) for an HTTP business service. IMAP Move Folder Email proxy service IMAP Move directory for an email proxy service. Customizing Oracle Service Bus Environments 9-9 Available Environment Values Environment Value Found In Description JCA Always Use WSDL Flag JCA proxy and business service An indicator of whether connection factory properties, activation spec properties (proxy services), and interaction spec properties (business services) are always used from the WSDL file. JCA Connection Mode JCA proxy and business service The mode that determines how a service connects to an associated JCA adapter: managed or non-managed mode. Valid values are managed or non-managed. JCA Overwrite Connection Authentication Flag JCA proxy and business service An indicator of whether authentication credentials in the JCA adapter connection factory are overridden in a development or test environment (in non-managed connection mode). JEJB Proxy Remote Client Timeout JEJB proxy service The RMI client timeout interval (in seconds) for a JEJB proxy service. JMS Alert Destination URI Alert destination The URI in a JMS alert destination. This variable includes a location in the configuration file. JMS Managed Server JMS business service The Managed Server associated with the destination for a JMS business service that has a Message ID response correlation pattern. This variable includes a location in the configuration file. JMS Queue Connection Factory JMS proxy and business service A response queue connection factory for a JMS proxy or business service with a Message ID response correlation pattern. This variable includes a location in the configuration file. The location is null for proxy services. JMS Response Destination JMS business service The destination of a JMS business service with a Message ID response correlation pattern. This variable includes a location in the configuration file. JMS Response URI JMS proxy and business service The URI of the response queue for JMS proxy or business services using a JMS Correlation ID response correlation pattern. This variable includes a location in the configuration file. JNDI Provider URL JNDI provider The URL for the JNDI provider. Managed Server for Polling E-mail, File, FTP, or SFTP proxy service in a clustered domain The managed server for polling in a clustered domain. MQ Connection List MQ connection The list of MQ connections used when Multi-instance Queue Manager support is enabled. 9-10 Administering Oracle Service Bus Available Environment Values Environment Value Found In Description MQ Connection Pool Size MQ connection The size of the MQ connection pool. MQ Connection Timeout MQ connection The time interval after which unused connections are destroyed. MQ Dead Letter URI MQ proxy service The URI of the dead letter queue to which request messages are redirected after a pipeline retries a message a specified number of times. MQ Host Name MQ connection The name of the server hosting the MQ queue manager. MQ Multi-instance QM Enabled MQ connection An indicator of whether MQ Multiinstacne Queue Manager support is enabled. When enabled, the list of connections in MQ Connection List are used. MQ Port Number MQ connection The port number of the MQ queue manager listener. MQ Queue Manager Channel Name MQ connection The MQ queue manager server connection channel name. MQ Queue Manager Name MQ connection The name of the MQ queue manager. MQ Response URI MQ proxy and business service The URI for the proxy or business service response. MQ Unrecognized Response URI MQ business service The URI of the queue to which unrecognized response messages are sent. MQ Version MQ connection The version of WebSphere MQ being used. MQ XA Enabled MQ connection An indicator of whether the transactions handled by the MQ connection are distributed (XA). Proxy Server Host Proxy server The host name of a proxy server in a proxy server resource. This variable includes a location in the configuration file. Proxy Server Port Proxy server The port number of a proxy server in a proxy server resource. This value is an integer. This variable includes a location in the configuration file. Secure Connections to JMS Server JMS proxy and business service An indicator of whether Service Bus uses SSL to connect to the JMS server. If true, Service Bus connects to the JMS server and JNDI tree using SSL (t3s); otherwise, connections occur over a clear text (t3) channel. The location value should be null. Customizing Oracle Service Bus Environments 9-11 Available Environment Values Environment Value Found In Description Service Retry Count Business service The number of times endpoint URIs are retried for a business service; in other words, the number of failover attempts. Service Retry Iteration Interval Business service The length of time that a business service waits before iterating over the entire set of URIs again. Service URI Proxy or business service Proxy or business service URI. This variable includes a location in the configuration file. The location is not defined for proxy services. Service URI Weight Business service The individual weights assigned to business service URIs. This variable includes a location in the configuration file. SFTP Archive Directory SFTP proxy service The archive directory for a SFTP proxy service. If direct-streaming is on, the archive directory is present on the remote SFTP server; otherwise, it is present locally. SFTP Download Directory SFTP proxy service The download directory for a SFTP proxy service. SFTP Error Directory SFTP proxy service The error directory for a SFTP proxy service. If direct-streaming is on, the error directory is present on the remote SFTP server; otherwise, it is present locally. SFTP Preferred Cipher Suite SFTP proxy and business service The cipher suite to use for authentication and encryption in SFTP proxy and business services. SFTP Preferred Compression Algorithm SFTP proxy and business service The compression library to use to compress in-flight data in SFTP proxy and business services. SFTP Preferred Data Integrity Algorithm SFTP proxy and business service The bulk-hashing algorithm to use integrity checks in SFTP proxy and business services. SFTP Preferred Key Exchange Algorithm SFTP proxy and business service The default key exchange protocol for negotiating the session key for encrypting the message in SFTP proxy and business services. SFTP Preferred Public Key Algorithm SFTP proxy and business service The asymmetric key algorithm for publickey cryptography in SFTP proxy and business services. SMTP Server URL SMTP Server The URls for SMTP Servers. Throttling Group Enabled Throttling group An indicator of whether a business service throttling group is enabled. 9-12 Administering Oracle Service Bus Environment Values for Operational Settings Environment Value Found In Description Throttling Group Maximum Concurrency Throttling group The maximum number of messages that can be concurrently processed by the throttling group. Throttling Group Maximum Queue Length Throttling group The maximum number of messages allowed in the throttling queue to restrict the number of messages in the queue. Throttling Group Time to Live Throttling group The maximum time (in milliseconds) a message can be in the throttling queue of the throttling group. Tuxedo Access Point Map Proxy or business service The name and address of the local access points per Managed Server; there is one location per URI. Tuxedo Access Point Name Business service The name of the remote WTC access point associated with the URI. Tuxedo Network Address Business service The network address of the remote WTC access point associated with the URI. UDDI Auto Import UDDI Registry An indicator of whether autosynchronization is enabled for an imported business service from a UDDI Registry. This property is per registry. UDDI Auto Publish Proxy service An indicator of whether auto-publish to a UDDI Registry is enables for a proxy service. UDDI Inquiry URL UDDI Registry The inquiry URL for a UDDI Registry. UDDI Publish URL UDDI Registry The publish URL for a UDDI Registry. UDDI Security URL UDDI Registry The security URL for a UDDI Registry. UDDI Subscription URL UDDI Registry The subscription URL for a UDDI Registry. WS Error Queue URI WS business service The URI of the JMS queue for storing error messages. Work Manager Proxy services and business services The name of the dispatch policy in all proxy and business services. 9.5 Environment Values for Operational Settings You can define operational settings in a configuration file at both the global and service level in order to script updates to these settings in a new environment. The values listed in the following table let you define new values for operational settings. When you generate a configuration file from your Service Bus environment, the operational settings are automatically included in the file. Customizing Oracle Service Bus Environments 9-13 Sample Configuration Files Table 9-2 Environment Values for Operational Settings Environment Value Found In Value Global Operational Settings Proxy and business service, pipeline, splitjoin The global operational settings for proxy services, business services, pipelines, and split-joins. You can specify values for the following global settings: • • • • • • • • Monitoring enabled Reporting enabled Logging enabled SLA alerting enabled Pipeline alerting enabled Result caching enabled Maximum locked groups (resequencer) The locker thread sleep period (resequencer) • Whether to delete completed messages (resequencer) This value supports replacing and updating operational settings. Service Operational Settings Proxy and business service, pipeline, splitjoin The operational settings for a proxy or business service, pipeline, or split-join. The available operational settings vary by service type. This value supports replacing and updating operational settings. Service SLA Alert Rules Proxy and business service, pipeline, splitjoin All alert rules for a proxy or business service, pipeline, or split-join. This value only supports the replace action, and can be used to replace all alert rules for a resource. Service SLA Alert Rule Proxy and business service, pipeline, splitjoin The properties for an alert rule for a proxy or business service, pipeline, or split-join. This value supports replacing, updating, adding, and deleting rules. It includes a location, which determines where the new rule is inserted. When adding a rule, specify one of the following locations: • Null: Inserts the new rule at the end of the list of rules. • The name of an alert rule: Inserts the new rule before the alert rule you entered. When deleting an alert rule, specify the name of the rule to delete in the location. 9.6 Sample Configuration Files This section provides some excerpts from configuration files that show how to perform various updates to a Service Bus domain, including operational settings, SLA alert rules, and references. It also illustrates using the find and replace feature. Example - Updating Global Operational Settings Using the Replace Action 9-14 Administering Oracle Service Bus Sample Configuration Files The following sample replaces the operational settings with the values specified in the <con:operations> child of the <xt:replace> element. Items within the <xt:replace> element without provided values are assigned null values. <cus:customization xsi:type="cus:EnvValueActionsCustomizationType"> <cus:description/> <cus:owners> <xt:owner> <xt:type>Operations</xt:type> <xt:path>System/Operator Settings/GlobalOperationalSettings</xt:path> </xt:owner> </cus:owners> <cus:actions> <xt:replace> <xt:envValueType>Global Operational Settings</xt:envValueType> <xt:value> <con:operations> <con:monitoring>true</con:monitoring> <con:reporting>false</con:reporting> <con:logging>true</con:logging> <con:sla-alerting>true</con:sla-alerting> <con:pipeline-alerting>true</con:pipeline-alerting> <con:result-caching>false</con:result-caching> <con:resequencer-settings> <con:maxGroupsLocked>15</con:maxGroupsLocked> <con:lockerThreadSleep>10</con:lockerThreadSleep> <con:deleteCompletedMessage>true</con:deleteCompletedMessage> </con:resequencer-settings> </con:operations> </xt:value> </xt:replace> </cus:actions> </cus:customization> Example - Updating Operational Settings using the Update Action The following sample updates the Monitoring operational setting to true. Values for the other operational settings are not updated because new values are not provided. <cus:customization xsi:type="cus:EnvValueActionsCustomizationType"> <cus:description/> <cus:owners> <xt:owner> <xt:type>Operations</xt:type> <xt:path>System/Operator Settings/GlobalOperationalSettings</xt:path> </xt:owner> </cus:owners> <cus:actions> <xt:update> <xt:envValueType>Global Operational Settings</xt:envValueType> <xt:value> <con:operations xmlns:con="http://xmlns.oracle.com/servicebus/domain/ config"> <con:monitoring>true</con:monitoring> <con:reporting></con:reporting> <con:logging></con:logging> <con:sla-alerting></con:sla-alerting> <con:pipeline-alerting></con:pipeline-alerting> <con:result-caching></con:result-caching> <con:resequencer-settings> <con:maxGroupsLocked></con:maxGroupsLocked> <con:lockerThreadSleep></con:lockerThreadSleep> Customizing Oracle Service Bus Environments 9-15 Sample Configuration Files <con:deleteCompletedMessage></con:deleteCompletedMessage> </con:resequencer-settings> <con:javaScript-timeout></con:javaScript-timeout> <con:automatic-service-migration></con:automatic-service-migration> </con:operations> </xt:value> </xt:update> </cus:actions> </cus:customization> Example - Adding and Deleting SLA Alert Rules This excerpt shows how to add a new SLA alert rule (ErrorCount) to a business service named bix_transfer in the TicketProcess project. The new rule is added before the AverageResponse rule. The excerpt also shows how to delete an SLA alert from a split-join named sj_transfer. <cus:customization xsi:type="cus:EnvValueActionsCustomizationType"> <cus:description>Add new alert rule to multiple services</cus:description> <cus:owners> <xt:owner> <xt:type>BusinessService</xt:type> <xt:path>TicketProcess/bix_transfer</xt:path> </xt:owner> <xt:ownerQuery> <xt:resourceTypes>ProxyService</xt:resourceTypes> </xt:ownerQuery> </cus:owners> <cus:actions> <xt:add> <xt:envValueType>Service SLA Alert Rule</xt:envValueType> <xt:location>AverageResponse</xt:location> <xt:value> <aler:alertRule enabled="true" name="ErrorCount" xmlns:con="http://xmlns.oracle.com/servicebus/business/config" xmlns:oper1="http://xmlns.oracle.com/servicebus/operations" xmlns:oper="http://xmlns.oracle.com/servicebus/business/operations"> <aler:description>Transport error count limit</aler:description> <aler:frequency>every-time</aler:frequency> <aler:severity>minor</aler:severity> <aler:stopProcessing>true</aler:stopProcessing> <aler:condition aggregation-interval="10"> <con1:monCondExpr xmlns:con1="http://xmlns.oracle.com/servicebus/ monitoring/alert/condition"> <con1:function>count</con1:function> <con1:lhs>Transport.error-count</con1:lhs> <con1:operator>></con1:operator> <con1:rhs>0</con1:rhs> </con1:monCondExpr> </aler:condition> <aler:alertDestination ref="TicketProcess/dest"/> <aler:summary>Transport error count exceeded.</aler:summary> </aler:alertRule> </xt:value> </xt:add> </cus:actions> </cus:customization> <cus:customization xsi:type="cus:EnvValueActionsCustomizationType"> <cus:description>Delete alert rule</cus:description> <cus:owners> <xt:owner> 9-16 Administering Oracle Service Bus Sample Configuration Files <xt:type>FLOW</xt:type> <xt:path>TicketProcess/sj_transfer</xt:path> </xt:owner> </cus:owners> <cus:actions> <xt:delete> <xt:envValueType>Service SLA Alert Rule</xt:envValueType> <xt:location>rule1</xt:location> </xt:delete> </cus:actions> </cus:customization> Example - Updating Values using the Find and Replace Action The following sample searches for environment values that contain localhost:7001 and replace that value or substring with test1500env:7101 in proxy and business services. Items in the <cus:query> element determine the resources, environment values, and paths to search. The <xt:searchString> element contains the search string. The <cus:replacement> element contains the replacement string. <cus:customization xsi:type="cus:FindAndReplaceCustomizationType"> <cus:description/> <cus:query> <xt:resourceTypes>ProxyService</xt:resourceTypes> <xt:resourceTypes>BusinessService</xt:resourceTypes> <xt:envValueTypes>File Error Directory</xt:envValueTypes> <xt:envValueTypes>Service Retry Iteration Interval</xt:envValueTypes> <xt:envValueTypes>UDDI Auto Publish</xt:envValueTypes> <xt:envValueTypes>Service URI Weight</xt:envValueTypes> <xt:envValueTypes>File Stage Directory</xt:envValueTypes> <xt:envValueTypes>Service Retry Count</xt:envValueTypes> <xt:envValueTypes>Service URI</xt:envValueTypes> <xt:envValueTypes>Managed Server for Polling</xt:envValueTypes> <xt:envValueTypes>File Archive Directory</xt:envValueTypes> <xt:refsToSearch xsi:type="xt:ResourceRefType"> <xt:type>ProxyService</xt:type> <xt:path>Order/ps_order</xt:path> </xt:refsToSearch> <xt:refsToSearch xsi:type="xt:ResourceRefType"> <xt:type>BusinessService</xt:type> <xt:path>Order/bs_order</xt:path> </xt:refsToSearch> <xt:includeOnlyModifiedResources>false</xt:includeOnlyModifiedResources> <xt:searchString>localhost:7001</xt:searchString> <xt:isCompleteMatch>false</xt:isCompleteMatch> </cus:query> <cus:replacement>test1500env:7101</cus:replacement> </cus:customization> Example - Updating Resource References The following excerpt updates any references to the business service named bs_order in the Order project to bs_order in the OrderProcess project: <cus:customization xsi:type="cus:ReferenceCustomizationType"> <cus:description/> <cus:refsToBeConsidered xsi:type="xt:ResourceRefType"> <xt:type>ProxyService</xt:type> <xt:path>Order/order_proxy</xt:path> </cus:refsToBeConsidered> Customizing Oracle Service Bus Environments 9-17 Sample Configuration Files <cus:refsToBeConsidered xsi:type="xt:ResourceRefType"> <xt:type>Pipeline</xt:type> <xt:path>Order/ps_orderPipeline</xt:path> </cus:refsToBeConsidered> <cus:externalReferenceMap> <xt:oldRef> <xt:type>BusinessService</xt:type> <xt:path>Order/bs_order</xt:path> </xt:oldRef> <xt:newRef> <xt:type>BusinessService</xt:type> <xt:path>OrderProcess/bs_order</xt:path> </xt:newRef> </cus:externalReferenceMap> </cus:customization> 9-18 Administering Oracle Service Bus 10 Importing and Exporting Oracle Service Bus Resources This chapter provides instructions for importing and exporting Service Bus projects and resources using Fusion Middleware Control. This chapter includes the following topics: • About Importing and Exporting Oracle Service Bus Resources • Exporting Oracle Service Bus Resources in Fusion Middleware Control • Importing Oracle Service Bus Resources in Fusion Middleware Control 10.1 About Importing and Exporting Oracle Service Bus Resources In Fusion Middleware Control, you can import a full configuration JAR file or just a subset of the resources included in the JAR file. You can also export full configuration JAR files from the console. A configuration JAR file contains projects or resources that were previously exported from a Service Bus instance. If a resource you are importing already exists in the importing system, that resource is updated. Resources are only scheduled for deletion when the JAR file being imported contains full projects and there are resources located in the same projects in Fusion Middleware Control that are not present in the imported JAR file. Resources in other projects are not deleted. At the same time you import Service Bus resources, you can also import a configuration file that defines environment values specific to the domain in which you are working. Environment values can include URLs for services, file locations for certain transports, host names, port numbers, and so on. They can also include operational settings at the global and service levels, as well as updates to resource references. For more information about configuration files, see Customizing Oracle Service Bus Environments. The import and export features also apply to JDeveloper and the Oracle JDeveloper and the Oracle Service Bus Console. For information and instructions, see Importing and Exporting Resources and Configurations in Developing Services with Oracle Service Bus. That chapter also provides information about the import and export processes, including how resources are created, updated, or deleted during the import, and how security settings and operational settings are handled. It also includes information on improving the performance of large imports by using the oracle.osb.config.parallelism system property. 10.2 Exporting Oracle Service Bus Resources in Fusion Middleware Control You can export Service Bus projects or individual resources from projects. The export feature lets you select the projects or resources you want to export from a list of all Importing and Exporting Oracle Service Bus Resources 10-1 Exporting Oracle Service Bus Resources in Fusion Middleware Control projects and resources on the server. When you do a project-level export, you can expand the list to view all resources, but you can only select at the project level. For resource-level exports, Service Bus gives you the option of automatically including in the exported file any resources referenced by the resources you select. This way, you can avoid conflicts caused by broken references when you re-import the file. You cannot export the users, groups, or roles associated with the projects and resources to export. Credential maps or other security-provider data created in the WebLogic Server Administration Console are also not exported. Instead, use the WebLogic Server Administration Console to export this data. See Migrating Security Data in Oracle Fusion Middleware Securing Oracle WebLogic Server. When you export projects or resources, you can enter a passphrase to encrypt the user name and password included service account, service key provider, UDDI Registry, JNDI Provider, or SMTP provider resources. When you re-import the JAR file, you need to specify the passphrase again. The following figure shows the Export Resources page. Figure 10-1 Export Resources Page To export Oracle Service Bus resources: 1. In the Target Navigator in Fusion Middleware Control, expand SOA and expand the Service Bus server from which you want to export resources. 2. Right-click the name of the Service Bus server or project in the server and select Export. 10-2 Administering Oracle Service Bus Importing Oracle Service Bus Resources in Fusion Middleware Control Tip: You can also select Export from the Service Bus or Service Bus Project menu. 3. On the Export Resources page, select Projects to export complete projects or select Resources to export individual resources. 4. For a resource-level export, select Include Resource Dependencies to export any additional resources referenced by the selected resources. Clear the check box to only export the resources you select. 5. Expand the list of resources, and make sure only the ones you want to export are selected. 6. To encrypt sensitive data in the exported resources, enter the password to unlock the file in the Pass-phrase and Confirm Pass-phrase fields. For more information, see "Data Encryption During Export" in Developing Services with Oracle Service Bus. 7. Click Export. 8. On the Processing:Export Projects dialog, click Save. 9. On the File Download dialog, click Save, specify a location and filename for the configuration JAR file and click Save again. Service Bus generates the configuration JAR file in the location you specified. 10. To close the Processing: Export Projects dialog, click the "X" in the upper right corner of the dialog. 10.3 Importing Oracle Service Bus Resources in Fusion Middleware Control Use the Fusion Middleware Control import feature to import Service Bus projects or resources that were previously exported from a Service Bus instance. Be sure to verify the import summary to be sure you are only updating or deleting the correct resources. The configuration JAR file you import excludes users, groups, roles, and certificates from the original projects. If these existed in the original projects, recreate them when you import an exported configuration. Importing a project can also update the operational settings. If the configuration JAR file you are importing was exported with a passphrase, meaning any authentication information contained in the resources was encrypted, you need to specify that same passphrase when you import the JAR file. You can import any unencrypted resources if you do not know the passphrase. When you import a configuration JAR file, you also have the option to import a configuration file to set environment values for the imported resources. For more information, see Using Configuration Files to Update Environment Values and Operational Settings. The following figure shows the Import Resources page. Importing and Exporting Oracle Service Bus Resources 10-3 Importing Oracle Service Bus Resources in Fusion Middleware Control Figure 10-2 Import Resources Page To import Oracle Service Bus resources: 1. In the Target Navigator in Fusion Middleware Control, expand SOA and expand the Service Bus server to which you want to import resources. 2. Do one of the following: • To import a project at the domain level, right-click the name of the Service Bus server and select Import. • To import Service Bus resources into a Service Bus project, right-click the name of the project and select Import. Tip: You can also select Import from the Service Bus or Service Bus Project menu. 3. On the Import Resources page, click Browse next to the Jar Source field to navigate to and select the JAR file to import. 4. Optionally, click Browse next to the Configuration File field to navigate to and select a configuration file to import. 5. Click Next. A list of resources included in the selected source appears, along with the type of operation (create, update, or delete) to be performed on each. 10-4 Administering Oracle Service Bus Importing Oracle Service Bus Resources in Fusion Middleware Control 6. Expand the list of resources, and make sure only the ones you want to import are selected. Caution: Make sure that you want to delete any existing resources that are marked for deletion in the list. If you do not want them to be deleted, clear their check boxes. 7. If a resource references other resources, the number of references appears in the References column. Click the number to view details about the referenced resources. 8. For a resource-level import, select Include Dependencies to automatically import any dependent resources. 9. If the imported source is password protected, enter the password in the Pass- phrase field. 10. Select any of the advanced settings to keep in the imported resources. For information about these settings see the online help and "Preserving Security Configuration During Import" in Developing Services with Oracle Service Bus. 11. Click Finish. The selected resources are imported and a summary of the import process appears. Importing and Exporting Oracle Service Bus Resources 10-5 Importing Oracle Service Bus Resources in Fusion Middleware Control 10-6 Administering Oracle Service Bus 11 Defining Access Security for Oracle Service Bus This chapter describes how to create users, groups, and roles for use in Service Bus inbound security and administrative security. Inbound transport-level security and message-level security use the user, group, and role data to authenticate inbound client requests, and apply access control policies to determine which authenticated users are authorized to use proxy services and business services. Administrative security uses the user, group, and role data to determine which authenticated users are authorized to create or modify Service Bus resources or to monitor Service Bus performance. This chapter includes the following sections: • Understanding Oracle Service Bus Application Security • Security Configuration During Exports • Configuring Oracle Service Bus Administrative Security • Securing Oracle Service Bus in a Production Environment 11.1 Understanding Oracle Service Bus Application Security For authentication and authorization, Service Bus uses Oracle Application Development Framework (ADF) security, which is built on Oracle Platform Security Services (OPSS). For more information about OPSS, see Securing Applications with Oracle Platform Security Services. For information about ADF security, see ADF Security Framework in Understanding Oracle Application Development Framework. You define user accounts, groups, application roles, and policies in order to configure security for Service Bus components and to grant specific permissions to each user. To give users access to administrative functions, such as creating proxy services, you assign them to predefined application roles with pre-defined access privileges. You can also create user groups and assign those groups to the predefined roles in order to give the same access permissions to a group of users. You cannot change the access privileges for the application roles, but you can grant individual access permissions to users and groups along with the default roles. 11.1.1 Users Users are single entities that can be authenticated in Service Bus, and can be a person or a software entity, such as a web services client. You must give each user a unique identity (name) within a security realm. Typically, the users that you create fall into one of two categories: • Client users who can access proxy services or business services. If you create a large number of client users, consider organizing them into security groups. Defining Access Security for Oracle Service Bus 11-1 Understanding Oracle Service Bus Application Security • Administrative users who use the Oracle Service Bus Console to create or modify proxy services, business services, and other Service Bus resources. Administrative users also use Fusion Middleware Control to monitor and mange runtime components. Service Bus recommends role-based security for its administrative functions. Although you can grant individual access privileges directly to users or groups, Oracle recommends granting administrative privileges only by assigning them to application roles. 11.1.2 Groups To facilitate administering a large number of users, you can organize users into named groups. Then, instead of giving access privileges or role identities to each user, one at a time, you give privileges or identities to all users in a group. You can create custom security groups to facilitate giving users access to administrative functions such as creating proxy services. In the simplest scenario for configuring administrative security, you create multiple groups, each assigned a unique set of permissions through roles, and then create users and add them to the groups. Each user in a group is automatically always a member of the corresponding roles with all of the pre-defined access privileges. 11.1.3 Roles Service Bus provides several default roles, each with a specific set of access permissions. The role assigned to a user determines the tasks that user can perform. You can assign roles to users or to groups to secure resources and services in the Oracle Service Bus Console and Fusion Middleware Control. This restricts user access to only those actions permitted by the roles you assign. You can also restrict the user interfaces that should be made available to a given role depending on the privileges of the role. For information about the permissions granted by each role, see Role-Based Access in Oracle Service Bus. A user or group can be associated with multiple roles. For example, you create two groups named MyCustomersEast and MyCustomersWest. You create a security role named PrivilegedCustomer and create conditions so that the MyCustomersWest group is in the role from 8am to 8pm EST, while the MyCustomersEast group is in the role from 8pm to 8am EST. Then you create an access control policy for a proxy service that gives the PrivilegedCustomer role access to the service. Different users will have access at different times depending on whether they are in the MyCustomersEast and MyCustomersWest group. 11.1.3.1 Oracle Service Bus Application Roles Service Bus provides eight default application roles, each of which provide a specific set of access permissions that are common to a specific category of user. These roles are listed and described below. 11.1.3.1.1 MiddlewareAdministrator The MiddlewareAdministrator role is an administrative security role, and has complete access to all resources and services in Service Bus. This includes the ability to create, edit, or delete user names, passwords, and credential alias bindings in service accounts and service key providers. The user names and passwords that this role can 11-2 Administering Oracle Service Bus Understanding Oracle Service Bus Application Security create are used only by service accounts for outbound authentication; they are not used to authorize access to Service Bus resources. 11.1.3.1.2 Developer The Developer role is designed for use in development and testing environments only, and is not intended for production. Like MiddlewareAdministrators, Developers have full access to Service Bus features in the Oracle Service Bus Console and Fusion Middleware Control; but unlike MiddlewareAdministrators, Developers cannot add, edit, or delete users or application roles, or see sessions owned by other users. They can view activations. In a shared development environment, Developers cannot publish from JDeveloper to the server. Instead, they can export projects to the Oracle Service Bus Console to activate the resources. 11.1.3.1.3 Composer The Composer role has full access to the monitoring and management features in Fusion Middleware Control, with the exception of importing and exporting resources. This role has view-only access to the Oracle Service Bus Console. The responsibilities of this role will increase in future releases. 11.1.3.1.4 Deployer The Deployer role has full access to the monitoring and management features in Fusion Middleware Control and in the Oracle Service Bus Console, with the exception of updating security policies and resolving resequencing errors. Users with this role are generally responsible for deploying and upgrading applications. 11.1.3.1.5 Tester The Tester role has read-only access to resources in the Oracle Service Bus Console, and to the monitoring and management features in Fusion Middleware Control. This role has full access to the Test Console from both the Oracle Service Bus Console and Fusion Middleware Control. Users with this role typically perform integrated testing on pre-production systems, running their tests with a combination of command-line clients, Fusion Middleware Control, and custom interfaces. 11.1.3.1.6 MiddlewareOperator The MiddlewareOperator role has access to certain monitoring tasks and session management, and has read access to all Service Bus resources. In addition, this role has access to create, view, edit, and delete alert rules and alert destinations, and to view and edit operational settings. The role does not have access to view all sessions, import or export resources, change security policies, or launch the test console. Users with this role are responsible for performing day-to-day operations on Service Bus resources and ensuring operational continuity. 11.1.3.1.7 ApplicationOperator The ApplicationOperator role has read-only access to the Oracle Service Bus Console and Fusion Middleware Control. It has full access to the Resequence Groups tab. Application operators receive notifications on faults and can take corrective action by recovering faults, skipping the message, or aborting a transaction. 11.1.3.1.8 Monitor The Monitor role is granted to users who monitor resources and services in the Oracle Service Bus Console and Fusion Middleware Control. Users assigned to this role have read access to all Service Bus resources, and can also monitor violations to Service Level Agreements (SLAs) and the alerts from the pipeline. Defining Access Security for Oracle Service Bus 11-3 Understanding Oracle Service Bus Application Security 11.1.3.2 WebLogic Server Security Roles The Service Bus roles have permission to modify only Service Bus resources; they do not have permission to modify Oracle WebLogic Server or other resources on Oracle WebLogic Server. To give permission to modify Oracle WebLogic Server resources, add a user to one of the Oracle WebLogic Server security roles. In each Service Bus domain, make sure that you add at least one user to the Administrator role. For more information about security roles, see Users, Groups, and Security Roles in Securing Resources Using Roles and Policies for Oracle WebLogic Server. 11.1.3.3 Compatibility with Previous Releases In release 11g, Service Bus provided four, pre-defined security roles that give administrative privileges. These roles are provided in the current release for backward compatibility. • IntegrationAdmin (similar to Administrator in 12c) • IntegrationDeployer (similar to Deployer in 12c) • IntegrationMonitor (similar to Monitor in 12c) • IntegrationOperator (similar to Operator in 12c) Service Bus also provides default security groups for backwards compatibility. These groups are each in one of the legacy security roles that have been granted administrative privileges. Table 11-1 describes the legacy groups and their roles. Table 11-1 Oracle Service Bus 11g Groups Group Role IntegrationAdministrators IntegrationAdmin IntegrationDeployers IntegrationDeployer IntegrationOperators IntegrationOperator IntegrationMonitors IntegrationMonitor 11.1.4 Access Control Policies An access control policy specifies conditions under which users, groups, or roles can access a proxy service. For example, you can create a policy that always allows users in the GoldCustomer role to access a proxy service and that allows users in the SilverCustomer role to access the proxy service only after 12:00 PM on weekdays. For all proxy services, you can create a transport-level policy, which applies a security check when a client attempts to establish a connection with the proxy service. Only requests from users who are listed in the transport-level policy are allowed to proceed. A message-level access control policy applies a security check when a client attempts to invoke a proxy service with message-level security. You can create a message-level access control policy in the following cases: • For proxy services that are active Web Service Security intermediaries • For proxy services that have message level custom authentication 11-4 Administering Oracle Service Bus Security Configuration During Exports Only users who are listed in the message-level policy are allowed to invoke the operation. 11.1.5 Security Configuration Data and Sessions Users, groups, and roles are persisted in security providers, which are not governed by Service Bus sessions. Therefore, you can create or modify this data using the WebLogic Service Administration Console or Fusion Middleware Control when you are in or out of a session. Any additions or modifications to this data take effect immediately and are available to all sessions. If you discard a session in which you added or modified the data, the security data is not discarded. Access control policies are persisted in authorization providers. And there is a reference to them in the Service Bus repository. Access control policies are managed within a design session and not outside the session. Because the changes are made within a session, you can commit or discard the changes as with other resources. For consistent management, either completely manage access control lists (ACLs) outside of Service Bus sessions (using the authorization provider MBeans or thirdparty authorization provider tools) or completely manage them from within Service Bus sessions. Any combination of the two approaches can result in an inconsistent view of policies. 11.2 Security Configuration During Exports You cannot export users, groups, or roles when you export a configuration because these objects are located in security provider stores. You must create these objects again when you import the exported configuration or use WebLogic Server tools (if available) to export and import them. 11.3 Configuring Oracle Service Bus Administrative Security You create and modify users and groups, and then assign roles to those users or groups, using Fusion Middleware Control. You can assign roles directly to individual users or you can assign users to custom groups to grant the same permissions to multiple users. Any modifications to user and group data take effect immediately and are available to all sessions. You can also create users and groups, and add users to groups, using the WebLogic Server Administration Console; but application roles are assigned using Fusion Middleware Control. This document describes using Fusion Middleware Control. For more information about WebLogic Server Administration Console security, see "Manage users and groups" in Oracle WebLogic Server Administration Console Online Help. 11.3.1 How to Grant Permissions to Individual Users To grant permissions to individual users: 1. Log in to Fusion Middleware Control with a user account that is in the Administrator application role. 2. Create users, and add the users to the Monitors group. See Creating Oracle Service Bus Users and Granting Access Permissions By Assigning Users to Groups. 3. Assign the new users to one or more of the application roles. See Granting Permissions to Individual Users. Defining Access Security for Oracle Service Bus 11-5 Configuring Oracle Service Bus Administrative Security 4. Optionally, grant individual permissions to users (not recommended). See Granting Permissions to Individual Users. 11.3.2 How to Grant Permissions to Users in User Groups To grant permissions to users in user groups: 1. Log in to Fusion Middleware Control with a user account that is in the Administrator application role. 2. Create groups to which you can assign Service Bus users, and make them members of the Monitors parent group. See Creating Oracle Service Bus Groups. 3. Create users and add the users to the appropriate groups. See Creating Oracle Service Bus Users and Granting Access Permissions By Assigning Users to Groups. 4. Assign the new groups to one or more of the application roles. See Granting Permissions to Groups. 5. Optionally, grant individual permissions to groups (not recommended). See Granting Permissions to Groups. 11.3.3 Creating Oracle Service Bus Groups You create Service Bus groups using Fusion Middleware Control. All Service Bus groups must be added to the Monitors parent group. Caution: Group names are case insensitive, but must be unique. Do not use any of the following characters in user names: < > \ , = / ( ) + ? [ ] Do not begin a user name with a pound sign (#) or double quotes ("). Creating a user with any of the preceding invalid characters can corrupt the WebLogic domain. To create a Service Bus group: 1. Log in to Fusion Middleware Control with a user account that has administrator privileges. 2. In the Target Navigator, expand WebLogic Domain, and right-click the name of your domain. 3. Point to Security and select Users and Groups. Click the Groups tab. 4. Above the Groups table click Create. 5. In the Name field of the Create New Group dialog, enter the name of the group. 6. Optionally, in the Description field, enter a short description to help identify the group. 7. In the Provider drop-down list, select the authentication provider for the group. 8. Click Create. The group name appears in the Group table. 11-6 Administering Oracle Service Bus Configuring Oracle Service Bus Administrative Security 9. In the Groups table, click the name of the group you just added, and then click the Membership tab. 10. In the Parent Groups Available list, select Monitors and then click the right arrow to add it to the Chosen list. 11. Click Save. 12. To assign application roles to the group, continue to Granting Permissions to Groups. 11.3.4 Granting Permissions to Groups Once you create a group, you can define the Service Bus permissions to grant the group's users by assigning the group to application roles using Fusion Middleware Control. You can either grant bulk permissions to a group by assigning it to a role, or you can grant individual permissions to a group. 11.3.4.1 Assigning a Group to an Application Role To assign a group to an application role: 1. Log in to Fusion Middleware Control as a user with administrator privileges. 2. In the Target Navigator, expand SOA and click service-bus. 3. In the Service Bus menu, select Security > Application Roles. 4. In the Application Stripe field of the Application Roles page, select Service_Bus_Console. 5. Click the Search icon (the blue arrow) to view the Service Bus application roles. 6. In the roles table, select the role you want to assign the group to, and click Edit. For information about the permissions granted by each role, see Application Security Roles. 7. Above the Members table on the Edit Application Role page, click Add. 8. On the Add Principal dialog, do the following: a. In the Type field, select Group. b. Optionally, enter all or part of the group's principal or display name. You can specify a search string that the name starts with or that it includes. c. Click Search. d. In the search results list, click the name of the group to assign the role to and click OK. e. On the Edit Application Role page, click OK. 11.3.4.2 Granting Individual Permissions to a Group While you can grant permissions to a group individually, this is not the recommended method. Whenever possible, you should grant permissions by assigning the group to a role, as described in Assigning a Group to an Application Role. To grant individual permissions to a group: Defining Access Security for Oracle Service Bus 11-7 Configuring Oracle Service Bus Administrative Security 1. Log in to Fusion Middleware Control as a user with administrator privileges. 2. In the Target Navigator, expand SOA and click service-bus. 3. In the Service Bus menu, select Security > Application Policies. 4. In the Application Stripe field of the Application Policies page, select Service_Bus_Console. The Create button is activated. 5. Click Create above the table. 6. In the Grantee section of the Create Application Grant page, click Add. 7. On the Add Principal dialog, do the following: a. In the Type field, select Group. b. Optionally, enter all or part of the group's principal or display name. You can specify a search string that the name starts with or that it includes. c. Click Search. d. In the search results list, click the name of the group to assign to the role and click OK. 8. In the Permissions section of the Create Application Grant window, click Add. 9. Do the following on the Add Permission dialog: a. To search by Java class, select Permissions and then select oracle.soa.osb.console.common.permissions.OSBPermission in the Permission Class field. b. To search by resource, select Resource Types and then select OSBPermission in the Resource Type field. c. Optionally enter all or part of the resource name. d. Click Search. e. In the search results list, click the name of the permission you want to grant and click Continue. For information about Service Bus permissions, see Application Security Roles. f. In the Permission Actions field, select only those actions you want to grant. If you searched by Java class, enter permission actions in a comma-delimited list; for example, enter create,delete,edit. Available permissions vary depending on your selection on the previous page. g. Click Select. The new permissions appears in the Permissions table. 10. When you are done granting permissions, click OK on the Create Application Grant window. 11-8 Administering Oracle Service Bus Configuring Oracle Service Bus Administrative Security 11.3.5 Creating Oracle Service Bus Users You create Service Bus groups using Fusion Middleware Control. All Service Bus users must be added to the Monitors parent group or to a group that is a member of the Monitors parent group. Caution: Do not use any of the following characters in user names: ; , + = \ (double back-slashes can be used; for example smith\\). Do not begin a user name with a pound sign (#) or double quotes ("). Creating a user with any of the preceding invalid characters can corrupt the WebLogic domain. To create Service Bus users: 1. Log in to Fusion Middleware Control as a user with administrator privileges. 2. In the Target Navigator, expand WebLogic Domain, and right-click the name of your domain. 3. Point to Security and select Users and Groups. Click the Users tab. 4. Above the Users table click Create. 5. In the Name field of the Create New User dialog enter the login ID of the user. 6. Optionally, in the Description field, enter a short description to help identify the user. 7. In the Provider drop-down list, select the authentication provider for the user. 8. In the Password field, enter a password for the user. The password must be 8 characters or more. 9. Re-enter the password for the user in the Confirm Password field. 10. Click Create to save your changes. The user name appears in the User table. 11. Do one of the following: • If you plan to grant access permissions to users by assigning them to groups, continue to Granting Access Permissions By Assigning Users to Groups. • If you plan to grant access permissions to the users individually, continue to Granting Permissions to Individual Users. 11.3.6 Granting Access Permissions By Assigning Users to Groups If you use groups to assign the same permissions to many users, you add the users to the appropriate groups to grant permissions. These users do not need to be members of the Monitors group because the group should already be a member. To add Service Bus users to groups: 1. Log in to Fusion Middleware Control as a user with administrator privileges. Defining Access Security for Oracle Service Bus 11-9 Configuring Oracle Service Bus Administrative Security 2. In the Target Navigator, expand WebLogic Domain, and right-click the name of your domain. 3. Point to Security and select Users and Groups. Click the Users tab. 4. In the Users table, click the name of the user you just added, and then click the Groups tab. 5. Select the groups to which you want to add the user and then click the right arrow to add them to the Chosen list. 6. Click Save when you are done adding groups. 11.3.7 Granting Permissions to Individual Users Once you create a user in the WebLogic Server Administration Console, you can grant them access permissions by assigning them to an application role in Fusion Middleware Control. You can also assign permissions individually, but this is not recommended. 11.3.7.1 Assigning a User to an Application Role To assign a user to an application role: 1. Log in to Fusion Middleware Control as a user with Administrator privileges. 2. Assign the user to the Monitors group as described in Granting Access Permissions By Assigning Users to Groups. 3. In the Target Navigator, expand SOA and click service-bus. 4. In the Service Bus menu, select Security > Application Roles. 5. In the Application Stripe field of the Application Roles page, select Service_Bus_Console. 6. Click the Search icon (the blue arrow) to view the Service Bus application roles. 7. In the roles table, select the role to which you want to add the user and click Edit. For information about the permissions granted by each role, see Application Security Roles. 8. Above the Members table on the Edit Application Role page, click Add. 9. On the Add Principal dialog, do the following: a. In the Type field, select User. b. Optionally, enter all or part of the user's principal and display names. You can specify a search string that the name starts with or that it includes. c. Click Search. d. In the search results list, click the name of the user to assign to the role and click OK. e. On the Edit Application Role page, click OK. 11-10 Administering Oracle Service Bus Configuring Oracle Service Bus Administrative Security 11.3.7.2 Granting Individual Permissions to a User While you can grant permissions to a user individually, this is not the recommended method. Whenever possible, you should grant permissions by assigning the user to a role, as described in Assigning a User to an Application Role. If you assign roles or permissions directly to users, you must also add the users to the Monitors group. To grant individual permissions to a user: 1. Log in to Fusion Middleware Control as a user with administrator privileges. 2. In the Target Navigator, expand SOA and click service-bus. 3. In the Service Bus menu, select Security > Application Policies. 4. In the Application Stripe field of the Application Policies page, select Service_Bus_Console. The Create button is activated. 5. Click Create above the table. 6. In the Grantee section of the Create Application Grant page, click Add. 7. On the Add Principal dialog, do the following: a. In the Type field, select User. b. Optionally, enter all or part of the user's principal or display name. You can specify a search string that the name starts with or that it includes. c. Click Search. d. In the search results list, click the name of the user to grant permissions to and click OK. 8. In the Permissions section of the Create Application Grant window, click Add. 9. Do the following on the Add Permission dialog: a. To search by Java class, select Permissions and then select oracle.soa.osb.console.common.permissions.OSBPermission in the Permission Class field. b. To search by resource, select Resource Types and then select OSBPermission in the Resource Type field. c. Optionally enter all or part of the resource name. d. Click Search. e. In the search results list, click the name of the permission you want to grant and click Continue. For information about Service Bus permissions, see Application Security Roles. f. In the Permission Actions field, select only those actions you want to grant. If you searched by Java class, enter permission actions in a comma-delimited list; for example, enter create,delete,edit. Defining Access Security for Oracle Service Bus 11-11 Securing Oracle Service Bus in a Production Environment Available permissions vary depending on your selection on the previous page. g. Click Select. The new permissions appears in the Permissions table. 10. When you are done granting permissions, click OK on the Create Application Grant window. 11.4 Securing Oracle Service Bus in a Production Environment To prepare a Service Bus installation for production, you must pay special attention to your security needs. The following guidelines are recommended strategies for securing Service Bus in a production environment. • Read and follow the guidelines in Securing a Production Environment for Oracle WebLogic Server. • Create user accounts for the Service Bus administrators and assign them to one or more of the groups you create or to application roles individually. • In your file system, configure access control to the directory that contains Service Bus configuration data. This is the config directory under the domain root. For example: C:\oracle\user_projects\domains\servicebus_domain\config\osb • In your file system, configure access control to the directories used by the FTP, SFTP, file, and email transports. • If necessary, configure access control to the JMS resources used by your Service Bus installation. 11.4.1 Undeploying the Service Bus (SB) Resource Service Bus provides a resource servlet (MW_HOME/OSB_ORACLE_HOME/lib/apps/ sbresourceWar/sbresource.war) that is used to expose the resources registered in Service Bus. The resources registered with Service Bus include the following: • WSDL (a WSDL file registered as a resource in Service Bus) • WADL (a WADL file registered as a resource in Service Bus) • Schema • MFL • WS-Policy • WSDL (an effective WSDL with resolved policies and port information for a proxy service; this effective WSDL is available if the proxy service was created using a WSDL file). However, this servlet provides anonymous HTTP access to metadata, and as such it may be considered a security risk in some high-security environments. If you do not want the Service Bus resources to be available anonymously via HTTP, you can set security roles on sbresources.war to control access to it, or completely undeploy the resource. 11-12 Administering Oracle Service Bus Securing Oracle Service Bus in a Production Environment Note: If you undeploy the SB resource you will no longer be able to use the UDDI subsystem. 11.4.2 Protection of Temporary Files With Streaming body Content As described in "The Message Context Model" in Developing Services with Oracle Service Bus for processing message content, you can specify that a Service Bus pipeline streams the content rather than loading it into memory. When you enable content streaming, you specify whether to buffer the streamed content to memory or a disk file as an intermediate step during the processing of the message. If you use these temporary disk files, you should protect them. To lock-down your Service Bus domain, set the com.bea.wli.sb.context.tmpdir Java system property to specify where these temporary files will be written. Make sure this directory exists and has the right set of access permissions. For more information see the file access permission and file system recommendations in Securing a Production Environment for Oracle WebLogic Server. 11.4.3 Protecting Against Denial of Service Attacks on the Oracle Service Bus Console In a production environment, the Oracle Service Bus Console should not be accessible to users other than administrators. A denial of service attack can take the form of a high volume of requests from a single source or new connections being made to the server once resource constraints have reached a certain point. Following are suggestions for protecting against denial of service attacks on the Oracle Service Bus Console. • In a production environment, make sure the Admin Server, which is the server the Oracle Service Bus Console runs on, is never made public. Only Managed Servers should be available to callers. • Instead of using the default Work Manager for the Oracle Service Bus Console, configure and use a different Work Manager that sets a default limit on the number of users that can access the Oracle Service Bus Console web application (maxthreads-constraint). For information about Work Managers, see "Using Work Managers to Optimize Scheduled Work" in Administering Server Environments for Oracle WebLogic Server. Defining Access Security for Oracle Service Bus 11-13 Securing Oracle Service Bus in a Production Environment 11-14 Administering Oracle Service Bus Part IV Performing Advanced Administration Tasks This part describes advanced administration tasks for Service Bus, including managing business service endpoint URIs, controlling the message flow for business services, and troubleshooting. This part contains the following chapters: • Configuring Reporting for Messages and Alerts • Monitoring and Managing Security Policies • Monitoring and Managing Endpoint URIs for Business Services • Configuring Business Services for Message Throttling • Managing Resequencer Tables 12 Configuring Reporting for Messages and Alerts This chapter describes the reporting framework in Oracle Service Bus, including the default JMS reporting provider and the Message Reports module in Fusion Middleware Control. This chapter contains the following sections: • Introduction to the Service Bus Reporting Framework • About the JMS Reporting Provider • Configuring a Database for the JMS Reporting Provider Store • Enabling Message Reports • Working With Message Reports • Stopping a Reporting Provider • Starting a Reporting Provider • Untargeting a JMS Reporting Provider • Using Oracle Advanced Queueing JMS 12.1 Introduction to the Service Bus Reporting Framework Service Bus includes an extensible framework for creating one or more reporting providers for messages or alerts. You can configure pipelines to generate message and alert reports that can then be exported to reporting streams. Message data can be captured from the message $body and other variables associated with the message, such as the $header or $inbound variables. Alert data contains information about Service Level Agreement (SLA) violations that you can configure to monitor pipelines. You can use the message or alert data delivered to the reporting provider for functions such as tracking messages or regulatory auditing. 12.1.1 Message Report Configuration To enable message reporting you must first create a report action in a pipeline. The Report action allows you to extract information from each message and write it to the Service Bus Reporting Data Stream. You do not need to configure a report action for alert reporting. Alert data is always available in the Reporting Data Stream. For more information, see About the Pipeline Report Action. Configuring Reporting for Messages and Alerts 12-1 Introduction to the Service Bus Reporting Framework 12.1.2 Default Reporting Provider For message reporting, Service Bus includes a JMS reporting provider. The Message Reports page in Fusion Middleware Control displays the information captured from this reporting provider. If you do not wish to use the provided JMS reporting provider, you can untarget it and create your own reporting provider using the Reporting Service Provider Interface (SPI). If you configure your own reporting provider for messages, no information is displayed in Fusion Middleware Control. You must to create your own user interface. To capture SLA alert data, you must create a reporting provider for alerts. 12.1.3 Custom Report Providers Information you need for creating your own reporting provider is located in com.bea.wli.reporting in the Java API Reference for Oracle Service Bus. The Java API Reference provides information about what you need to do for implementing a reporting provider, including how to package it, where it goes, how to deploy it, and the order of deployment. The reporting schema is MessageReporting.xsd, located in OSB_ORACLE_HOME/lib/sb-schemas.jar. 12.1.4 Reporting Workflow As shown in the Figure 12-1, both report messages and alerts are exported to reporting data streams. In the Report stage, information is extracted by the Report action from each message and written to the reporting data stream with metadata that adheres to MessageReporting.xsd. Similarly, the SLA Manager uses Reporting Data Manager APIs to write to the alert reporting stream with metadata that adheres to AlertReporting.xsd. To develop a reporting provider for alerts or your own message reporting provider, you need to implement ReportingDataHandler interface and use the ReportingDataManager class. Figure 12-1 Reporting Framework The ReportingDataHandler interface processes the reporting or alert data stream. It can either process or store a stream, or do both in a relational database, file, JMS queue, and so on. Depending on which stream you want to use, you need to implement the appropriate handle methods to process the data stream: 12-2 Administering Oracle Service Bus About the JMS Reporting Provider • Message Reporting Stream: The Report action in the runtime uses the following two handle methods to write to the message reporting stream: handle(com.bea.xml.XmlObject metadata, String s) handle(com.bea.xml.XmlObject metadata, com.bea.xml.XmlObject data) • Alert Reporting Stream: The Alert Manager uses the following handle method to write to the alert reporting stream: handle(com.bea.xml.XmlObject metadata, String data) The ReportingDataManager is a local server object that keeps a registry of reporting providers. Reporting providers implement the ReportingDataHandler interface. The ReportingDataManager provides operations do perform the following: • Add and remove reporting data handlers. • Export reporting data stream using various handle operations. 12.2 About the JMS Reporting Provider The JMS Reporting Provider provides a pluggable architecture to capture the reporting information from each message using a Report action in a pipeline. The default JMS Reporting Provider is automatically configured when you create a Service Bus domain. All messages across the cluster are aggregated and stored in a JMS Reporting Provider data store in a database specific format. This provider displays information from the JMS Reporting Provider data store. Note: If you do not want to use the default Service Bus JMS Reporting Provider, untarget the reporting provider and its corresponding data source in your domain, as described in Untargeting a JMS Reporting Provider. The JMS Reporting Provider consists of a producer and a consumer, which are decoupled to improve scalability. The producer is a JMS producer and the Message Driven Bean (MDB) acts as the JMS consumer, as shown in Figure 12-2. Configuring Reporting for Messages and Alerts 12-3 About the JMS Reporting Provider Figure 12-2 JMS Reporting Provider The Reporting stage contains the Report actions that collect the reporting information and dispatch the reporting stream to the JMS Reporting Provider through various handle operations in the ReportingDataManager. The JMSReportingDataHandler is the JMS producer of the reporting provider. The JMSReportingDataHandler takes the reporting stream and logs the information to a JMS queue. The MDB listens to the JMS reporting queue, which processes the message asynchronously, and stores the data in the JMS Reporting Provider data store. While the JMS Reporting Provider processes reports generated by a Report action, it ignores reports generated due to SLA and pipeline alerts. When writing a custom reporting provider, however, you are not restricted to that behavior. Depending on your business requirements you may want to process all or a subset of reporting data delivered by the reporting framework to your custom reporting provider. 12.2.1 About the Pipeline Report Action To receive report messages from either the JMS Reporting Provider, which is provided with the Service Bus installation, or your custom reporting provider, you must first create a Report action in the pipelines on which you want to report. The Report action allows you to extract information from each message and write it to the Service Bus reporting data stream. In the Report action, specify the information you want to extract from the message and add to the data stream. When configuring a Report action, use key values to extract key identifiers from the message; you can configure multiple keys. Information can be captured not only from 12-4 Administering Oracle Service Bus About the JMS Reporting Provider the body of the message but any other variable associated with the message, such as header or inbound variables. You can use any XML elements as a key. For example, using the following message structure, you might use the item-code element as a way to extract the identifier: <?xml version="1.0" encoding="utf-8"?> <poIncoming> <areacode>408</areacode> <item-quantity>100</item-quantity> <item-code>ABC</item-code> <item-description>Medicine</item-description> </poIncoming> Figure 12-3 shows a key value defined with a name of ItemCode and a value of .// item-code (an XPath expression). The value of the key comes from the item-code element in the message body (body variable). Figure 12-3 Key Name and Value in the Oracle Service Bus Console When you use the default JMS Reporting Provider, the keys and associated values are displayed in the Report Index column of the Message Reports table. If you configure multiple keys, the key-value pairs are displayed in the Report Index column with each key-value separated by a comma. For information about creating a Report action, see "Adding Report Actions" in Developing Services with Oracle Service Bus. 12.2.2 Reporting Actions in Global Transactions The JMS reporting provider uses a default queue connection factory that allows pipelines to execute reporting actions in the context of global transactions. The connection factory, defined in the jmsResources module, is called wli.reporting.jmsprovider.ConnectionFactory. If you do not want report actions to execute in the context of a global transaction, modify the connection factory in the Oracle WebLogic Server Administration Console by doing the following: 1. Select Services > Messaging > JMS Modules > jmsResources. 2. Select the Transactions tab. 3. Deselect the XA Connection Factory Enabled option. Following is the logic that a pipeline uses when handling Report actions using this connection factory: • If a global transaction exists and the connection factory is XA-enabled (the default), the report is generated within the context of that global transaction. • If a global transaction exists and the connection factory is not XA-enabled, the transaction is suspended and the report is generated within a local transaction. Configuring Reporting for Messages and Alerts 12-5 Configuring a Database for the JMS Reporting Provider Store • If a global transaction does not exist, the report is generated within a local transaction. 12.3 Configuring a Database for the JMS Reporting Provider Store Service Bus requires a database for the JMS Reporting Provider data store. The Java DB database that is installed with Oracle WebLogic Server is intended for development only, not for a production environment. In a production environment you must use one of the supported databases. For the latest information about supported databases, see Supported Databases and Drivers in Oracle Fusion Middleware Supported System Configurations at: http://www.oracle.com/technetwork/middleware/ias/downloads/ fusion-certification-100350.html Note: If you do not want to use the default JMS Reporting Provider and hence do not configure a database, untarget the reporting provider and its corresponding data source in your domain, as described in Untargeting a JMS Reporting Provider. 12.3.1 Configuring the Reporting Data Source for Transactions A default data source, wlsbjmsrpDataSource, is automatically created for Service Bus installations. If you create a custom JMS reporting provider data source, make sure the data source supports transactions in one of the following ways. Incorrect configuration could result in exceptions. • Configure the data source to use a supported XA driver. • If you use a non-XA driver for the data source, be sure to select the following options in the data source configuration: – Supports Global Transactions – Logging Last Resource For more information about Logging Last Resource (LLR), see "Understanding the Logging Last Resource Transaction Option" in Administering JDBC Data Sources for Oracle WebLogic Server. 12.3.2 Creating a Database for the JMS Reporting Provider Store In a development environment, the default JMS Reporting Provider checks whether tables exist for the specified database at runtime. If tables do not exist, the Reporting Provider creates them; if they do exist, the Reporting Provider uses them. Running the Repository Creation Utility (RCU) creates the schema and any required Service Bus database tables, including the tables used by the Reporting Provider. This is part of product installation. For more information, see "Creating the Database Schemas" in Installing and Configuring the Oracle Fusion Middleware Structure. 12-6 Administering Oracle Service Bus Enabling Message Reports 12.4 Enabling Message Reports In order to generate message reports, you need to create a Report action in the pipeline for which you want reports, as described in About the Pipeline Report Action. For instructions, "Adding Report Actions" in Developing Services with Oracle Service Bus. You also need to enable the Reporting operational setting both globally and for the pipeline. For instructions on updating operational settings, see the following sections: • Configuring Operational Settings at the Global Level • Enabling and Disabling Operational Settings for Multiple Services or Enabling and Disabling Operational Settings for a Single Service 12.5 Working With Message Reports In Fusion Middleware Control, you can view the information collected by the JMS Reporting Provider data store. The Message Reports feature lets you search for specific messages based on the pipeline that generated the report, the error code, report indexes, or a date range. The search results appear in a table containing the extracted information and other information, such as the time the message was written to the database and the service with which the message is associated. You can drill down to view detailed information about specific messages, including error information. To manage your message data, use the Purge feature, which lets you purge all of the messages from the reporting datastore or just the messages generated within a certain time period. Be sure to apply standard database administration practices to the database hosting the JMS Reporting Provider data store. 12.5.1 Searching for Message Reports In order to view message reports, you need to perform a search for the reports. You can leave all search criteria blank to view all available reports, or you can filter report messages for a specified period of time, by the name of a service, by error code, and by report index. For more information about the fields on this page, see the online help for the Message Reports page. To search for message reports: 1. In Fusion Middleware Control, do one of the following: • Click the Service Bus or Service Bus Project menu, and select Message Reports. • In the Target Navigator, right-click the name of the Service Bus server or any project deployed to the server, and select Message Reports. 2. Enter any of the following criteria in the search fields, or leave them empty to retrieve all messages: • Inbound Service Name (the name of the pipeline) • Error Code • Report Index (key/value pairs) You can use an asterisk (*) wildcard character in these fields. 3. To specify a date range for reports to retrieve, do the following: Configuring Reporting for Messages and Alerts 12-7 Working With Message Reports 4. 5. a. Select the From radio button. b. In the From field, enter the starting date for your date range. Select a date using the Select Date and Time icon or enter a date and time in the format Month DD, YYYY HH:MM:SS AM|PM. For example, you can enter Nov 29, 2013 12:45:00 AM. c. Repeat the above step in the To field to define the ending date for the range. To retrieve the most recent messages, do the following: a. Select the For the Last radio button. b. In the days field, select the number of days previous to today for which you want to retrieve message reports. c. In the hr:mm fields, select the number of hours and minutes previous to now for which you want to retrieve messages. Click Search. A list of message reports matching your criteria appears in the lower portion of the window. Figure 12-4 Message Reports Window 12.5.2 Viewing Message Report Details The Message Detail page displays complete information about the selected report message, including the node, pipeline, and stage that generated the report; timestamp; server name; inbound and outbound services; and the associated fault, if any. You can also view the text that was written to the report, which is defined in the Report action in the pipeline. To view message report details: 1. In Fusion Middleware Control, perform a search for message reports as described in Searching for Message Reports. 12-8 Administering Oracle Service Bus Working With Message Reports 2. To view a complete report for a message, click the report index for that row in the Message Reports table. The Message Detail window appears. For information about the fields displayed on this window, see the online help in Fusion Middleware Control. Figure 12-5 Message Reports Message Detail Window 3. To view the text that was printed to the message report, click View Report Details in the Report section of the page. The following figure shows the message body in the report. Configuring Reporting for Messages and Alerts 12-9 Working With Message Reports Figure 12-6 Message Report Data Note: When you create the Report action in the pipeline, you specify the value to write to the report using an XQuery expression to capture the report body text. 4. To view the Dashboard for the inbound or outbound service, click the name of the service. 5. When you are done viewing the Message Details page, you can click Close to return to the Message Reports summary page. 12.5.3 About Purging Message Reports from the Reporting Data Store You can purge all of the messages from the reporting datastore or just purge reports that were generated during a specific time period. Message purging is an asynchronous process, allowing you to continue working with the Message Reports page while the purge occurs in the background. Fusion Middleware Control does not display a message to indicate that a purge is in process, but if another user attempts to start a purge while a purge is in progress, the following message appears: A Purge job is already running. Please try later. The duration it takes a purge to complete depends on how many messages are in the purge queue. The deletion of messages is slowed if you search for reporting messages during the purge process. Moreover, the Message Reports page may display incorrect data as some data may not yet be purged. 12.5.4 Purging Message Reports from the Reporting Data Store The Purge Messages feature may be useful during design and test phases of your project. However, in a production environment, Oracle recommends that the management of the data in your database (including purging) is handled by the Database Administrator using database management tools. To purge message reports: 12-10 Administering Oracle Service Bus Stopping a Reporting Provider 1. In Fusion Middleware Control, perform a search for message reports as described in Searching for Message Reports. 2. Click Purge. The Purge Message Reports History dialog appears. 3. Do one of the following: • To purge messages for all dates, select All. • To purge messages for a specific date range, select Purge From and then specify the start and end dates and times using the Select Date and Time icons. Note: You can also manually enter a month, day, year, and time in the format MM/DD/YY HH:MM:SS. For example, you can enter 10/10/07 12:45:00 AM. 4. Click OK. 5. Read the warning message and then click OK again to proceed. 6. Click Close. 12.6 Stopping a Reporting Provider To stop a reporting provider when the Service Bus server is running: 1. Log in to the Oracle WebLogic Server Administration Console. 2. In the Domain Structure, click Deployments. The Summary of Deployments page appears. 3. In the Deployments table, select the check box next to the reporting provider you want to stop. 4. Click Stop and then select the appropriate stop command. 12.7 Starting a Reporting Provider To start a reporting provider when the Service Bus server is running: 1. Log in to the Oracle WebLogic Server Administration Console. 2. In the Domain Structure, click Deployments. The Summary of Deployments page appears. 3. In the Deployments table, select the check box next to the reporting provider you want to start. 4. Click Start and then select the appropriate start command. Configuring Reporting for Messages and Alerts 12-11 Untargeting a JMS Reporting Provider 12.8 Untargeting a JMS Reporting Provider If you do not want to use the default JMS Reporting Provider (or a custom reporting provider), untarget the provider in your domain. When you create a Service Bus domain, the JMS Reporting Provider is included as a target in the deployment list. Untargeting the default JMS Reporting Provider and its associated data source lets you avoid benign JMS reporting errors at server startup. Note: If no reporting provider exists, you can still define a Report action. However, no data is be written. 12.8.1 Untargeting the Default JMS Reporting Provider During Domain Creation To prevent the default JMS Reporting Provider from being targeted when you create a domain: 1. On the Advanced Configuration page of the Configuration Wizard, select optional configurations for Deployments and Services and JMS File Store. 2. When the Deployments Targeting page appears, select Service Bus JMS Reporting Provider in the Targets panel and then click the left arrow to remove it from the Targets list. 3. When the Services Targeting page appears, select wlsbjmsrpDataSource in the Targets panel and then click the left arrow to remove it from the Targets list. When the wizard creates the domain, neither resource is targeted at server startup. 12.8.2 Untargeting the JMS Reporting Provider when the Server is Running To untarget a reporting provider when the Service Bus domain is running: 1. Start the Oracle WebLogic Server Administration Console and log in. 2. In the Domain Structure panel, click Deployments. The Summary of Deployments page appears. 3. In the Deployments table, click the reporting provider you wish to untarget. The Settings page for the provider appears. 4. Click the Targets tab. 5. Clear the check box for the component to untarget. 6. Click Save. A message indicates that the settings have been successfully updated. 7. After you untarget the reporting provider, untarget the data source used by the reporting provider, as follows: 12-12 Administering Oracle Service Bus Untargeting a JMS Reporting Provider Note: This step is only required for reporting providers that do not share a data source with other components. To untarget the default JMS reporting provider in Oracle Service Bus installation you must perform the following steps. a. In the left panel, under Domain Structure, select Services > Data Sources. b. In the Summary of JDBC Data Source page, click the name of the data source to untarget. The Settings page for the data source appears. c. Click the Targets tab. d. Clear the check box for the servers from which you want to untarget the data source. e. Click Save. A message indicates that the settings have been successfully updated. 12.8.3 Untargeting the JMS Reporting Provider When the Server in Not Running If the Service Bus domain is not running, you can use the WebLogic Scripting Tool (WLST) to remove the JMS Reporting Provider from the domain. For more information about WLST, see Understanding the WebLogic Scripting Tool. To untarget a reporting provider, complete the following steps: 1. If you have not already set up your environment to use WLST, see "Main Steps for Using WLST" in Using the WebLogic Scripting Tool in Understanding the WebLogic Scripting Tool. 2. Invoke WLST Offline. C:>java com.bea.plateng.domain.script.jython.WLST_offline 3. To read the domain that was created using the Configuration Wizard execute: wls:/offline>readDomain("C:/oracle/user_projects/domains/base_domain") 4. To untarget the reporting provider data source execute: wls:/offline/base_domain>unassign("JdbcSystemResource", "wlsbjmsrpDataSource", "Target", "AdminServer") 5. To the reporting provider application execute: wls:/offline/base_domain>unassign("AppDeployment", "JMS Reporting Provider", "Target", "AdminServer") 6. To update the domain execute: wls:/offline/base_domain>updateDomain() 7. To close the domain execute: wls:/offline/base_domain>closeDomain() Configuring Reporting for Messages and Alerts 12-13 Using Oracle Advanced Queueing JMS 8. Exit from the WLST command prompt execute: wls:/offline>exit() Note: In a cluster, the JMS Reporting Provider is targeted to Cluster. Therefore in a cluster, to view and purge messages, you must configure at least one Managed Server to run with the Administration server. If no Managed Servers are running, the reporting provider is unavailable. 12.9 Using Oracle Advanced Queueing JMS By default, the JMS Reporting Provider uses WebLogic JMS for its data store. If Service Bus is running in a clustered environment, you can configure the domain to use Oracle AQ JMS instead. This changes the JMS provider for both reporting and for the poller transports. When you configure the domain to use Oracle AQ, the configuration wizard generates a new JMS system resource, OSBAQJMSServer, which is associated with a foreign JMS server for AQ JMS. The required JMS foreign destinations, foreign connection factory, initial context factory, and datasource are configured for reporting queues and for poller transport queues. The JMS foreign server for AQ JMS is configured to use the JMS reporting datasource wlsbjmsrpDataSource, which is the same datasource used by the default WebLogic JMS. Note: Oracle AQ JMS is only supported with Service Bus in a clustered environment using an Oracle database. The following steps indicate any special steps you need to take when creating the clustered Service Bus domain. For more information about creating the domain, see "Configuring Your Service Bus Domain" in Installing and Configuring Oracle Service Bus. To configure a clustered domain to use Oracle AQ JMS: 1. On the Advanced Configuration page of the Configuration Wizard, select optional configurations for Deployments and Services and Managed Servers, Clusters and Coherence. 2. Configure your administration and managed servers, define the cluster, and assign the servers to the cluster as you normally would. 3. When the Services Targeting page appears, do the following: a. In the Targets panel under Cluster/cluster_name/JMS/JMS System Resource, select jmsResources and then click the left arrow to remove it from the Targets list. b. Select OSBAQJMSServer in the Services panel under JMS System Resource, select the name of the cluster in the Targets panel, and then click the right arrow to add the service to the Targets list. This targets the service to the cluster. 12-14 Administering Oracle Service Bus Using Oracle Advanced Queueing JMS c. Select OSBAQJMSServer in the Services panel again, select the name of the Admin Server in the Targets panel, and then click the right arrow to add the service to the Targets list. This targets the service to the Admin Server. 4. Continue configuring the domain as you normally would. Once the domain is created, you can view the JMS resource and its associated connection factories and destinations in the JMS Modules pages of the Oracle WebLogic Server Administration Console. Configuring Reporting for Messages and Alerts 12-15 Using Oracle Advanced Queueing JMS 12-16 Administering Oracle Service Bus 13 Monitoring and Managing Security Policies Fusion Middleware Control lets you monitor and manage policies attached to your Service Bus services, including their usage and violation metrics. You can also attach policy sets globally, define policy overrides, and attach and detach policies from your services. This chapter includes the following topics: • Introduction to Security Policies • Configuring Global Policies • Monitoring Security Policies • Managing Security Policies 13.1 Introduction to Security Policies Security policies provide a framework to manage and secure web services consistently across your organization. In Service Bus, you attach policies to proxy and business services. You can manage policies for individual services in your Service Bus projects in JDeveloper, the Oracle Service Bus Console and in Fusion Middleware Control. Both consoles support runtime configuration. Using Fusion Middleware Control, you can also attach policies globally by creating policy sets. This chapter describes monitoring and managing policies in Fusion Middleware Control. For information about working with policies in Oracle Service Bus Console and Oracle JDeveloper, see "Securing Business and Proxy Services" in Developing Services with Oracle Service Bus. 13.2 Configuring Global Policies You can assign policies to multiple services in a Service Bus project using policy sets in Fusion Middleware Control. These are called global policies. When you create a global policy set, the policies in the set are automatically attached to the proxy or business services that match the configuration of the policy set. In order for the matching services to use the policies in a global policy set, the services must be configured to use OWSM policies. The policy set configuration defines the policy subject and any of the following for the service to which you want the policy attached: domain name, application name, and resource path (in the form project_name/folder/subfolder. You can attach policies to the following Service Bus services: • JCA Business Service • JCA Proxy Service Monitoring and Managing Security Policies 13-1 Configuring Global Policies • RESTful Business Service • RESTful Proxy Service • SOAP Business Service • SOAP Proxy Service For information about global policy attachments and policy sets, see "Global Policy Attachments Using Policy Sets" in Understanding Oracle Web Services Manager. For information about the policy subjects to select for each of these, see "Understanding Policy Subjects" in Understanding Oracle Web Services Manager. 13.2.1 How to Create a Global Policy Set To create a policy set, follow the instructions in Creating a Policy Set Using Fusion Middleware Control in Securing Web Services and Managing Policies with Oracle Web Services Manager. 13.2.2 How to Enable a Service for Global Policies In addition to being able to enable and disable global policy sets in Fusion Middleware Control, you can also configure business and proxy services to use or not use policies. In order to use global policies, a business or proxy service must be enabled to use policies from the OWSM policy store. You configure this in either JDeveloper or the Oracle Service Bus Console. For more information, see How to attach Oracle Web Services Manager Policies in JDeveloper and How to attach Oracle Web Services Manager Policies in the Console in Developing Services with Oracle Service Bus. To enable a service for global policies: 1. In the Application Navigator or the Project Navigator, locate the business or proxy service for which you want to enable global policies. 2. Right-click the service and select Open. The Business or Proxy Service Definition Editor appears. 3. Do one of the following: • In JDeveloper, click the Policies tab. • In the Oracle Service Bus Console, click the Policies tab. 4. On the Policies page, select From OWSM Policy Store in the list of available policy binding models. You do not need to select any policies to attach, but you can attach individual policies if needed. 5. When you are done configuring policies, click Save. 6. To activate the changes in the runtime, click Activate. 13.2.3 How to Disable a Service for Global Policies If a business or proxy service has policies enabled and matches the configuration of a global policy set, the policies in that set are automatically applied to the service. You can prevent this by disabling policies in the service, but this means that policies cannot be individually attached either. You configure this in either JDeveloper or the Oracle 13-2 Administering Oracle Service Bus Monitoring Security Policies Service Bus Console. For more information, see How to attach Oracle Web Services Manager Policies in JDeveloper and How to attach Oracle Web Services Manager Policies in the Console in Developing Services with Oracle Service Bus. To disable a service for global policies: 1. In the Application Navigator or the Project Navigator, locate the business or proxy service for which you want to diable global policies. 2. Right-click the service and select Open. The Business or Proxy Service Definition Editor appears. 3. Do one of the following: • In JDeveloper, click the Policies tab. • In the Oracle Service Bus Console, click the Policies tab. 4. On the Policies page, select No Policies in the list of available policy binding models. 5. When you are done configuring policies, click Save. 6. To activate the changes in the runtime, click Activate. 13.3 Monitoring Security Policies Fusion Middleware Control lets you monitor the policies being used by the services in your domain by providing a view of the policies used by each proxy or business service. You can also view any policy violations that have occurred, and you can view and analyze usage for each policy. 13.3.1 Viewing the Policies Attached to a Service The Policies page of a business or proxy service displays all the policies that are globally and directly attached to a service. You can access the Policies page for a service in a variety of ways. These steps describe accessing it from the project's Service Health page. To view the policies attached to a service: 1. In Fusion Middleware Control, expand SOA > service-bus. 2. Click the name of the project containing the service you want to view. The project's Service Health page appears. 3. In the Services table, click the name of the service whose policies you want to view. The Dashboard for the selected service appears. 4. Click the Policies tab. The Policies page lists both globally and directly attached policies. Monitoring and Managing Security Policies 13-3 Monitoring Security Policies Figure 13-1 Proxy Service Policies Page 5. To only view effective policies in the Directly Attached Policies table, click Effective Only above the table. For more information about effective policies, see How the Effective Set of Policies is Calculated in Securing Web Services and Managing Policies with Oracle Web Services Manager. 13.3.2 Monitoring Policy Usage Before making any changes to the policies used by your services, Oracle recommends you do a usage analysis to see which subjects are using a particular policy. Policy usage information is only available with a database-based OWSM repository and only for enabled services. The WSM Policies page displays the number of subjects to which a policy is attached. You can then view a list of the policy subjects of the selected type to which the policy is attached. To monitor policy usage: 1. In the upper portion of Fusion Middleware Control, click the WebLogic Domain menu, point to Web Services, and then select WSM Policies. The WSM Policies page appears. 2. To filter the list of policies, enter a name or category, or select a saved search. Click Search. 3. Click the number in the Attachment column for the selected policy to display the Usage Analysis page. 4. To view policy subjects in only the local domain, select Local Domain in the View Option field. To view policy subjects for all domains, select Enterprise. 5. To view the other policy subjects to which the policy is attached, select the subject type from the Subject Type menu. The Subject Type menu provides an attachment count for each subject type to which the policy is attached. 13-4 Administering Oracle Service Bus Managing Security Policies 13.3.3 Viewing Policy Violations The list of policies on a service's Policies tab includes the number of policy violations for policies with faults. To monitor policy violations: 1. Access the Policies page for the service you want to configure, as described in Viewing the Policies Attached to a Service. 2. In the Directly Attached Policies table, look in the Total Violations column to locate policies that have faults. 3. Click the number in the Violations column to view more information about the faults. 13.4 Managing Security Policies In Fusion Middleware Control, you can manage security policies by attaching and detaching policies, overriding policy properties, and creating global policies. For information about global policies, see Configuring Global Policies. 13.4.1 Attaching Security Policies Directly to a Service To attach security policies to a service: 1. Access the Policies page for the service you want to configure, as described in Viewing the Policies Attached to a Service. 2. Above the Directly Attached Policies table, click Attach/Detach. The Attach/Detach Policies window appears. Monitoring and Managing Security Policies 13-5 Managing Security Policies Figure 13-2 Attach/Detach Policies Window 3. In the Available list, select a policy to attach, and then click Attach. 4. Repeat the above step for each policy to attach. 5. Click Validate to verify the configuration. 6. Click OK to close the Attach/Detach Policies window. The new policies appear in the Directly Attached Policies table. 13.4.2 Detaching Policies from a Service To detach policies from a service: 1. Access the Policies page for the service you want to configure, as described in Viewing the Policies Attached to a Service. 2. Above the Directly Attached Policies table, click Attach/Detach. The Attach/Detach Policies window appears. 3. In the Directly Attached Policies list, select a policy to detach, and then click Detach. 4. Repeat the above step for each policy to detach. 5. Click Validate to verify the configuration. 13-6 Administering Oracle Service Bus Managing Security Policies 6. Click OK to close the Attach/Detach Policies window. The policies are removed from the Directly Attached Policies table. 13.4.3 Overriding Security Policies You can override the configuration for a policy that is directly attached to a service. This lets you update the configuration on a per service or client basis without creating new policies for each. In this way, you can create policies that define default configuration values and customize those values based on your runtime requirements. You can define overrides in the proxy or business service configuration, as described in "Securing Business and Proxy Services" in Developing Services with Oracle Service Bus. To override security policies in Fusion Middleware Control: 1. Locate the policies you want to override, as described in Viewing the Policies Attached to a Service. 2. In the Directly Attached Policy table, select the policy for which you want to define an override, and click Override Policy Configuration. The Security Configuration Details dialog appears, and lists the properties whose values can be overridden. 3. In the Value column, enter the override value for each property, and then click Apply. Monitoring and Managing Security Policies 13-7 Managing Security Policies 13-8 Administering Oracle Service Bus 14 Monitoring and Managing Endpoint URIs for Business Services This chapter describes how to manage endpoint URIs in business services, including configuring retries, marking non-responsive endpoints as offline, viewing endpoint metrics, and triggering alerts based on endpoint status. This chapter contains the following sections: • About Endpoint URI Management • Configuring Service Bus to Take Unresponsive Endpoint URIs Offline • Marking an Endpoint URI Offline Manually • Marking an Offline URI as Online • Viewing Endpoint URI Metrics for a Business Service • Creating Alerts Based on Endpoint URI Metrics 14.1 About Endpoint URI Management In the runtime, you can monitor metrics for each endpoint URI to ensure they are all performing as expected. When you notice issues with an endpoint URI, you can mark the URI as being offline to avoid repeated attempts at accessing the endpoint URI. You can alternatively configure the business service to mark non-responsive URIs as offline. 14.1.1 About Endpoint URIs An endpoint URI is the URL of an external service that is accessed by a business service. In Service Bus, you must define at least one endpoint URI for a business service. When you define multiple endpoint URIs for a business service, the load balancing algorithm you define controls the manner in which a business service tires to access the endpoint URI. A business service can use one of the following load balancing algorithms: • Round robin • Random • Random-weighted • None When you configure a business service, you can also configure how retries are handled. For more information, see "About Business Service URI Retries" in Developing Services with Oracle Service Bus. Monitoring and Managing Endpoint URIs for Business Services 14-1 About Endpoint URI Management 14.1.2 Offline and Online Endpoint URIs You can configure a business service to mark non-responsive URIs offline, which prevents a business service from repeatedly attempting to access a non-responsive URI and therefore avoids the communication errors caused by trying to access a nonresponsive URI. If Service Bus automatically marks an endpoint URI offline, Service Bus can bring it back online after a time period you specify, or Service Bus can keep it offline until you change the status manually. You can manually change the status of an endpoint URI to online or offline using Fusion Middleware Control or using the public APIs. When you mark an endpoint URI online in a cluster domain, it is marked online on all the Managed Servers. Service Bus automatically marks an endpoint URI online when any of the following occur: • You add the endpoint URI to a business service. • You restart a server. • You enable a disabled service. • You rename or move a service. • A business service is able to successfully access the URI after the retry interval you have configured is past. When you configure a business service to mark non-responsive URIs offline automatically, you can make this state temporary or permanent (or until you manually update the status). For more information, see Configuring Operational and Global Settings. 14.1.2.1 About Temporarily Offline Endpoint URIs Mark an endpoint URI offline temporarily if you want the business service to automatically retry the same endpoint after a short interval of time; mark it offline permanently if you want the business service to treat the endpoint URI as offline until it is reset manually. When marked offline temporarily, the endpoint URI status is changed to offline on encountering a communication error. When the retry interval has passed and the business service attempts to process a new request, it tries to access this endpoint URI. If this attempt is successful, the endpoint URI is marked online again. If the attempt fails, the URI is marked offline again for the duration of the retry interval, and the cycle is repeated. This configuration is useful when a communication error is temporary and corrects itself. For example, when an endpoint becomes temporarily overloaded, communication errors occur but the endpoint reverts to normal operation without requiring manual intervention. 14.1.2.2 About Permanently Offline Endpoint URIs When marked offline permanently, the endpoint URI status is changed to offline on encountering a communication error, and the status remains offline until you manually mark the endpoint URI online again. This configuration is useful for a case in which a communication error is caused by a problem with the endpoint URI that must be resolved by manual intervention. 14-2 Administering Oracle Service Bus About Endpoint URI Management If you want to keep non-responsive URIs offline until you take corrective action and then manually mark the URIs as online, do not provide a retry interval. For example, a zero retry interval indicates that the endpoint remains offline indefinitely. 14.1.2.3 Offline URIs in Clustered Environments A communication error can occur due to network problem on a machine hosting a Managed Server. Such an event is interpreted by the business service as the endpoint URI being non-responsive (although the remote endpoint being accessed is responsive). A communication error can also occur because the endpoint URI is not responding. In the first case, the URIs are marked offline on only one server (on the machine with network problems) and online on all the other servers in the cluster. An SLA alert condition based on Evaluate on any server generates an alert, but an alert condition based on Evaluate on all servers does not generate an alert. For the second case, the URI is marked offline on all the Managed Servers (one by one as each server tries to access that endpoint). As each Managed Server marks the endpoint URI offline, the alert rule condition based on Evaluate on any servers is met and an alert is generated. When the endpoint URI is marked offline on the last of the servers in the cluster domain, the alert rule condition based on Evaluate on all servers is also met and this alert is also generated. For a clustered domain: • When the Server field is set to Cluster or to one of the Managed Servers, Online status denotes that all of the endpoint URIs are online across the cluster or on the selected Managed Server, respectively. • When the Server field is set to Cluster or to one of the Managed Servers, Offline status denotes that all of the endpoint URIs are offline across the cluster or on the selected Managed Server, respectively. • When the Server field is set to Cluster, Partial status denotes that at least one of the endpoint URIs for the business service is offline on at least one of the servers, or that one of the endpoint URIs is offline on all the servers, but the other endpoint URIs for the same business service are still available on one or all the servers. • When the Server field is set to one of the Managed Servers, Partial status denotes that at least one of the endpoint URIs for the business service is offline on the selected Managed Server. 14.1.3 Metrics for Monitoring Endpoint URIs Fusion Middleware Control displays endpoint URI metrics so you can monitor the health of your business services. The JMX monitoring APIs also let you view endpoint URI metrics. For information on using Fusion Middleware Control, see Viewing Endpoint URI Metrics for a Business Service. For information on using the JMX monitoring APIs, see JMX Monitoring API. In Fusion Middleware Control, the endpoint URI metrics are available on the Dashboard tab for the business service on the Service Bus Project page. The available metrics include the state, message and error counts, and response times. The following items describe the expected behavior when you monitor endpoint URIs on Fusion Middleware Control: • Statistics are available only when you enable monitoring for a business service. Monitoring and Managing Endpoint URIs for Business Services 14-3 About Endpoint URI Management • Renaming or moving a service resets the URI-level statistics. • Changing the aggregation interval resets all the URI-level statistics except the URI status. • Resetting statistics for the service (or resetting all statistics) resets all the URI-level statistics except the URI status. • Adding a new URI to an existing business service automatically initiates collecting the metrics for the new URI. 14.1.3.1 Endpoint URI State The State statistic on the business service Dashboard of Fusion Middleware Control indicates whether the endpoint URI is online or offline. You can also obtain the status of an endpoint URI using the JMX monitoring APIs. Table 14-1 describes the possible states of an endpoint URI. Table 14-1 Status of Endpoint URIs Status Description Online Indicates that the URI is online on a given server. In a cluster it indicates that the URI is online for all servers. Offline Indicates that the URI is offline on a given server. In a cluster it indicates that the URI is offline for all servers. Partial Indicates that at least one server in the cluster reports a problem for that URI. This metric is available for clusters only. Note: When a URI is associated with more than one business service, the same endpoint URI can have a different status for each of the business services. 14.1.3.2 Endpoint URI Performance Metrics The endpoint URI performance metrics provide information on how many messages have been processed by a given endpoint and how many failed and their response times. The following metrics help you monitor the health of the endpoint URIs: • Message Count: The number of messages processed by the endpoint URI. • Error Count: The number of errors encountered by the endpoint URI. • Minimum Response Time: The minimum time (in milliseconds) that this service has taken to execute messages. • Maximum Response Time: The maximum time (in milliseconds) that this service has taken to execute messages. • Average Response Time: The average time (in milliseconds) that this service has taken to execute messages. 14-4 Administering Oracle Service Bus Configuring Service Bus to Take Unresponsive Endpoint URIs Offline 14.2 Configuring Service Bus to Take Unresponsive Endpoint URIs Offline You can configure Service Bus to automatically mark an unresponsive endpoint offline to prevent continued attempts to reach the endpoint URI. This can be a temporary state, based on a retry interval, or the endpoint URI can be taken offline permanently or until you manually bring the endpoint URI back online. To do so, you must enable the Offline Endpoint URIs operational setting for the business service. The offline URI settings for the business service apply to all URIs in the service. You can also use APIs to mark an offline endpoint URI as online. This is useful when the you have not enabled monitoring for a business service but you require to mark its endpoint URIs online. For more information, see com.bea.wli.monitoring.ServiceDomainMBean in the Java API Reference for Oracle Service Bus. To configure Service Bus to mark an unresponsive endpoint URI offline: 1. In Fusion Middleware Control Target Navigator, do one of the following: • Expand SOA, expand service-bus, and then click the project containing the business service whose URI you want to modify. On the Service Health tab, perform a search for and select the business service. • Expand SOA, select service-bus, and then click the Operations tab. Perform a search for and select the business service whose URI you want to modify. The Dashboard for the selected business service appears. 2. Click the Properties tab. 3. Under General Settings, select Offline Endpoint URIs. This configures Service Bus to mark the business service's endpoint URIs offline when they are not responding. 4. Do one of the following: • To have Service Bus mark the endpoint URI offline temporarily, use the hours, mins, and secs fields to specify a retry interval. This is the time Service Bus will wait before attempting to access the same endpoint URI for subsequent message processing. • To have Service Bus mark the endpoint URI offline permanently (or until manual intervention), set the Retry Interval to 0 hours 0 mins 0 secs. Note: When configure the endpoint URIs to be marked offline temporarily, the URI is kept offline for the specified time interval and then retried. If the endpoint responds, the URI becomes online again, or else it remains offline and the process repeats itself. 5. To save your changes to the runtime, click Apply. Monitoring and Managing Endpoint URIs for Business Services 14-5 Marking an Endpoint URI Offline Manually 14.3 Marking an Endpoint URI Offline Manually When you monitor a business service in Fusion Middleware Control, you can view metrics for its associated endpoint URIs. If you notice any issues with a specific endpoint URI, you can mark the endpoint URI as offline to prevent repeated attempts to access that URI. When you take an endpoint URI offline manually, it remains offline until you manually bring it back up. To mark an endpoint URI offline manually: 1. In Fusion Middleware Control Target Navigator, do one of the following: • Expand SOA, expand service-bus, and then click the project containing the business service whose URI you want to modify. On the Service Health tab, perform a search for and select the business service. • Expand SOA, select service-bus, and then click the Operations tab. Perform a search for and select the business service whose URI you want to modify. The Dashboard for the selected business service appears. 2. Scroll down to the Endpoint URIs section. 3. Select the online endpoint URI you want to mark offline, and click Toggle URI State. The State column for the URI changes to Offline. 14.4 Marking an Offline URI as Online When an endpoint URI is marked offline, either automatically by Service Bus or manually by an administrator, you can manually mark the endpoint URI as back online once you have taken steps to correct the error that caused the URI to be nonresponsive. When you mark an endpoint URI as back online, Service Bus continues processing according to the business service endpoint URI configuration. To mark an endpoint URI online manually: 1. In Fusion Middleware Control Target Navigator, do one of the following: • Expand SOA, expand service-bus, and then click the project containing the business service whose URI you want to modify. On the Service Health tab, perform a search for and select the business service. • Expand SOA, select service-bus, and then click the Operations tab. Perform a search for and select the business service whose URI you want to modify. The Dashboard for the selected business service appears. 2. Scroll down to the Endpoint URIs section. 3. Select the online endpoint URI you want to mark offline, and click Toggle URI State. The State column for the URI changes to Online. 4. To have Service Bus bring the endpoint URI back online after it is marked offline, follow the steps under Configuring Service Bus to Take Unresponsive Endpoint URIs Offline. 14-6 Administering Oracle Service Bus Viewing Endpoint URI Metrics for a Business Service 14.5 Viewing Endpoint URI Metrics for a Business Service Service Bus collects information about how each endpoint URI is processing messages. You can view message counts, error counts, and the minimum, maximum, and average response times. The business service Dashboard also shows whether the endpoint URI is online or offline. To view endpoint metrics for a business service: 1. In Fusion Middleware Control Target Navigator, do one of the following: • Expand SOA, expand service-bus, and then click the project containing the business service whose URI you want to modify. On the Service Health tab, perform a search for and select the business service. • Expand SOA, select service-bus, and then click the Operations tab. Perform a search for and select the business service whose URI you want to modify. The Dashboard for the selected business service appears. 2. In the Display Statistics field, select whether to view the statistics for the current aggregation interval or the statistics since the last reset. 3. Scroll down to the Endpoint URIs section. 4. View the metrics for each endpoint URI in the table. For more information about the metrics displayed, see Metrics for Monitoring Endpoint URIs and the online help for Fusion Middleware Control. 5. To change the status of an endpoint URI, see Marking an Endpoint URI Offline Manually or Marking an Offline URI as Online. 14.6 Creating Alerts Based on Endpoint URI Metrics If an endpoint URI is not accessible, the business service trying to access it receives a communication error. In addition to configuring a business service to take a non responsive URI offline, as described in Configuring Service Bus to Take Unresponsive Endpoint URIs Offline, you can raise an alert when a system encounters a nonresponsive URI by configuring SLA alert rules for a business service based on the endpoint URI status. 14.6.1 About Creating an SLA Alert Based on Endpoint URI Status When you create an SLA alert based on a business service's endpoint URI status, an alert is generated when any endpoint URI or all endpoint URIs change state from online to offline, or from offline to online. For example, consider a business service for which two alert rules are configured, one based on All URIs offline = True condition and another on Any URI offline = True condition. If an alert based on All URIs offline = True condition is generated then it signifies a severe problem because all requests to this service are likely to fail until the situation is resolved. However, if an alert based on Any URI offline = True is generated, it implies that the other endpoint URIs are responsive and subsequent requests may not fail. All alert rules are independently evaluated. If alerts based on both (any or all URI) clauses have been configured for the same business service, it is likely that both alerts are generated simultaneously when the last endpoint URI is marked offline.If a Monitoring and Managing Endpoint URIs for Business Services 14-7 Creating Alerts Based on Endpoint URI Metrics business service has only one URI, the All URIs offline = True and Any URI offline = True clauses mean the same thing and so they behave in an identical manner. The evaluation of an alert rule condition based on a transition from offline to online behaves in a similar fashion except that it tracks any or all endpoint URIs being marked back to online state. 14.6.2 Creating an SLA Alert Based on Endpoint URI Status You can create an alert rule based on an endpoint URI's status. To create an SLA alert based on endpoint URI status: 1. Create an SLA alert rule for the business service as described in Configuring SLA Alert Rule Properties. 2. On the Rule Condition page of the Create SLA Alert Rule wizard, select the time period for the Condition Aggregation Interval. For more information, see Aggregation Intervals. 3. If there is no template row in the table, click Add a New Condition above the Condition Builder table. A new row appears in the table. 4. In the first field, select Status. 5. In the next field, select one of the following to indicate the status condition that will generate an alert: • All URIs offline • All URIs online • Any URIs offline • Any URIs online 6. In the next field, the = operator is selected and is the only available option. 7. In the next field, select either True or False, depending on how you want to evaluate the condition. 8. In the last field, select on of the following: • Evaluate on all servers: With this option, the rule evaluates to true only if the condition is met on all servers. • Evaluate on any server: With this option, the rule evaluates to true if the condition is met on any servers. 9. To the left of the row, click Update the Condition. 10. Click Create. The new alert rule appears in the summary table. 14-8 Administering Oracle Service Bus Creating Alerts Based on Endpoint URI Metrics Note: To ensure that you do not miss any alerts triggered due to frequent changes in the status of the URI, Oracle recommends that you set the aggregation interval for alert rules based on the status of the URI to one minute. For more information on aggregation intervals, see Introduction to Aggregation Intervals. 14.6.3 Configuring an Alert Rule Based on Endpoint URI Statistics You can create an alert rule based on an endpoint URI's message count, error count, or response time. To configure an alert rule based on endpoint URI statistics: 1. Create an SLA alert rule for the business service as described in Configuring SLA Alert Rule Properties. 2. On the Rule Condition page of the Create SLA Alert Rule wizard, select the time period for the Condition Aggregation Interval. For more information, see Aggregation Intervals. 3. If there is no template row in the table, click Add a New Condition above the Condition Builder table. A new row appears in the table. 4. In the first field, select one of the following: • Count: To base the condition on the endpoint URI's message count or error count. • Minimum: To base the condition on the endpoint URI's minimum response time. • Maximum: To base the condition on the endpoint URI's maximum response time. • Average: To base the condition on the endpoint URI's average response time. 5. In the next field, select the URI for which you are creating the condition. 6. In the next field, select a comparison operator: =, !=, > or <. 7. In the next field, enter the value to compare the actual statistic against. 8. To the left of the row, click Update the Condition. 9. Click Create. The new alert rule appears in the summary table. Monitoring and Managing Endpoint URIs for Business Services 14-9 Creating Alerts Based on Endpoint URI Metrics 14-10 Administering Oracle Service Bus 15 Configuring Business Services for Message Throttling This chapter describes how to enable and use throttling in Oracle Service Bus. Throttling lets you control the amount of message traffic to a business service and to remote servers, and helps improve performance and stability by preventing message overload on high-traffic business services. This chapter contains the following sections: • Introduction to Throttling • Throttling in a Cluster • Throttling Metrics • Configuring Throttling for a Single Business Service • Configuring Throttling for a Group of Business Services 15.1 Introduction to Throttling To control the flow of messages to a business service and prevent backlogs, you can enable and configure message throttling for the business services in your Service Bus applications. If you want to control the flow of messages to a remote server from multiple business services, you can create a throttling group to manage those business services. 15.1.1 Throttling Concepts When you use throttling to control message flow, a throttling queue is created in which messages are enqueued when a business service reaches its maximum concurrency or when a throttling group reaches its maximum concurrency. Messages with a higher priority are processed first. If messages have the same priority, they are processed on a first-in first-out basis. To ensure messages with a higher priority are processed first, assign priorities to messages using the routing options. The greater the integer for priority, the higher the priority is for the message. A throttling queue is an in-memory queue. There is at most one queue per throttled business service or per server. Messages that are placed in this queue are not recoverable when a server fails or when you restart a server. Once a message has been in the throttling queue for an interval greater than the value of message expiration configured for the business service or throttling group, it becomes an expired message and is removed from the queue. When you delete or rename a business service, all the messages in the throttling queue are discarded. Configuring Business Services for Message Throttling 15-1 Introduction to Throttling 15.1.2 Throttling Properties When you enable throttling for a business service or throttling group, you configure information about the message capacity and about the throttling queue used to hold messages when capacity is reached. To use a throttling queue, you must specify the queue length. If the throttling queue length is 0 (zero), messages are discarded once the defined capacity (maximum concurrency) is reached. When messages are discarded or removed from the queue due to exceeding the queue length or expiring, the throttling engine throws a TransportException back to the pipeline, and the error handler is triggered if one is configured. 15.1.2.1 Maximum Concurrency The maximum concurrency restricts the number of records that can be concurrently processed by a business service or throttling group. When this threshold is reached for a business service, all the incoming messages for the business service are placed in a throttling queue until the business service can accept more messages. If the queue is full, messages in the queue with a lower priority are removed and the new incoming messages are enqueued. Any change to this setting during runtime affects both new messages and those already in the queue. When you increase the value, Service Bus allows more messages to be processed once the messages in the queue are processed. When you decrease the value, Service Bus places any new messages in a throttling queue until the number of messages being processed goes below the new threshold. 15.1.2.2 Throttling Queue Length The throttling queue length limits the number of messages that can be held in the throttling queue at any given time. All incoming messages beyond the maximum concurrency limit are placed in the throttling queue. When the queue is full, the message in the queue with the lowest priority is removed if a new incoming message has a higher priority. When you decrease the value for this setting during runtime, all the messages beyond the new length are discarded. 15.1.2.3 Message Expiration (TTL) The message expiration period (or time to live) limits the amount of time a message can stay in the throttling queue. When the time period has elapsed, the message is removed from the queue. These messages are referred to as expired messages. When you increase the value for this setting, the expiration time for the new messages and the messages that are already present in the queue is increased. When you decrease the value, all the messages that have exceeded the new value are immediately discarded. This value is set at the queue level; all messages put in the queue have the same Message Expiration value. When the time period is exceeded, messages are removed from the queue without being processed. 15.1.3 Throttling Groups When you configure throttling for individual business services, you control the flow of messages for those business services without taking into account the limitations of the server hosting the referenced services. If you have multiple business services sending requests to the same remote server, it could exceed the capacity of the server. Defining a throttling group lets you restrict the flow of messages sent to a specific remote server from multiple business services. You can create throttling groups either in Oracle JDeveloper or in the Oracle Service Bus Console. When you create a throttling group, you associate business service URLs 15-2 Administering Oracle Service Bus Introduction to Throttling with the group. Each URL can only be associated with one throttling group. All business services in a throttling group have equal priority for message processing. The message priority set in the routing rules determine the order of processing. If multiple messages have the same priority, they are processed with a first-in/first-out policy. When you enable throttling for a group, you must also enable throttling for each business service in the group for which you want to restrict the message flow. 15.1.4 Throttling Group Properties and Business Service Throttling Properties The properties you set for throttling groups are the same as those you set for individual business services. Service Bus determines the maximum concurrency property as follows: • If the maximum concurrency set for the throttling group is greater than the sum of the maximum concurrencies set for each business service in the group, Service Bus uses the concurrencies set for the business services. • If the maximum concurrency set for the throttling group is less than the sum of the maximum concurrencies set for each business service in the group, the concurrency limit set for the throttling group takes precedence. The throttling queue length and the message expiration time set for the throttling group specify default values in case they are not defined for each business service in the group. These values are inherited from the group regardless of whether the throttling group is enabled or disabled. Service Bus determines the throttling queue length and message expiration properties as follows: • The property values specified for a business service associated with a throttling group override the values specified for the throttling group itself. However, if the values for a business service are greater than the values for its associated throttling group, the values set for the throttling group take precedence. • If the property values are not specified for a business service, the values defined for the throttling group are used. 15.1.5 Throttling for Business Services with Multiple Endpoint URIs In Service Bus, a business service can be associated with multiple endpoint URIs. For more information on endpoint URIs, see Monitoring and Managing Endpoint URIs for Business Services. When you associate a business service with multiple URIs, you configure the maximum concurrency for the business service and not the individual URI. The maximum concurrency for each URI is set internally depending on the overall maximum concurrency and the load balancing weight, based on the following equation: URI-specific max_concurrency = [User configured max_concurrency] X [weight] For example, consider a business service B with three endpoint URIs eu1, eu2, and eu3. The load balancing algorithm is defined as random-weighted. The weights of the URIs are 1, 2, and 3 respectively. Assuming that you have defined a maximum concurrency of 10 for the business service, the URI specific maximum concurrency is 10, 20, and 30. The effective maximum concurrency of the business service B is 60. If the last endpoint URI that has a weight of 3 is offline, the effective maximum concurrency of the business service is 30. Configuring Business Services for Message Throttling 15-3 Throttling in a Cluster Note: The weights for the URI when the load balancing is round robin or random is 1. When the load balancing is None the weight of the primary URI is 1 and the weight of the backup URI is 0. The weight of the backup URI becomes 1 when the primary URI goes offline. Messages for which the endpoint URI is overridden in routing options are not throttled. Messages are also not throttled with session stickiness enabled. 15.1.6 Throttling Retried Messages When failover is enabled on a service, retried messages are not throttled. The message is sent to the next URI regardless of the operational settings for throttling. Messages that are expired or that are discarded, because the throttling queue is full or because the service reached its maximum concurrency, are not retried. 15.1.7 Throttling and Work Managers While endpoint throttling and dispatch policies (Work Managers) both work to limit loads, they work on different areas of processing. The Work Manager configured for a proxy service limits the number of threads running on that proxy service. A Work Manager configured on a business service limits the number of threads processing responses from the back-end system. Endpoint throttling configured on a business service limits requests to the back-end system. Using a combination of Work Managers and throttling gives you control over these three processing points. 15.2 Throttling in a Cluster The throttling capacity is a cluster-wide setting, with each managed server having its own server-specific capacity. Throttling capacity is equally split among all managed servers, regardless of whether they are all running. When dividing work among managed servers in a cluster, the throttling capacity (maximum concurrency) for each server is rounded up. For example, if a cluster has three managed servers and the capacity is ten, the capacity distribution is four for each server. When throttling is configured, each managed server in a cluster has a throttling capacity of at least one. 15.3 Throttling Metrics Service Bus displays the service metrics for throttling on the Service Bus Project business service Dashboard page on Oracle Enterprise Manager. The dashboard displays the maximum throttling time, the minimum throttling time, and the average throttling time for the current aggregation interval and for the time period since the last time statistics were reset. For more information, see Viewing All Service Health Statistics for a Service. You can also access the metrics using JMX Monitoring APIs. For more information, see JMX Monitoring API. 15.3.1 Using Throttling Metrics to Define Alerts You can define an SLA alert rule based on the available throttling metrics. For example, you could create an alert for when the maximum throttling time exceeds a specific amount of time. For more information, see Creating Service Level Agreement Alert Rules . 15-4 Administering Oracle Service Bus Configuring Throttling for a Single Business Service 15.4 Configuring Throttling for a Single Business Service You enable and disable throttling, as well as configure throttling properties, on the Properties tab of the business service's home page in Fusion Middleware Control. Any changes you apply on this page take effect immediately. 15.4.1 Configuring Throttling for a Single Business Service Once you deploy or activate a business service to the runtime, you can enable or disable throttling for that service and you can configure the throttling options. When throttling is enabled, the flow of messages is restricted for the endpoints and messages are processed by priority. You can optionally assign messages a priority using routing options; otherwise, messages are dequeued on a first-in, first-out basis. To configure throttling for a business service 1. In the Target Navigation panel of Fusion Middleware Control, expand SOA > service-bus and then click the name of the project containing the business service to configure. The Service Bus Project home page appears. 2. On the Operations tab, perform a search for the business service. The results appear in the Operations table. 3. Click the name of the business service to display its home page. 4. If the Properties page is not visible, click the Properties tab. 5. To enable throttling for the business service, select Throttling State. 6. Enter the following information: • Maximum Concurrency: The maximum number of records the business service can process concurrently. This value cannot be 0 (zero); it must be a positive integer. • Throttling Queue: The maximum number of messages in the throttling queue. A value of 0 indicates there is no throttling queue. • Message Expiration: The number of milliseconds a message can be in the queue before expiring. A value of 0 means the messages do not expire. For more information about these properties, see the online help provided for Fusion Middleware Control. If the business service is part of a throttling group, these fields can be left empty. In this case, Service Bus uses the properties set for the throttling group. 7. Click Apply. 15.4.2 Disabling Throttling for a Single Business Service If you no longer want to throttle messages for a business service, you can disable throttling for that service at any time. When you disable throttling, message in the throttling queue are processed normally, and the message flow is no longer restricted by the throttling parameters. To disable throttling for a business service Configuring Business Services for Message Throttling 15-5 Configuring Throttling for a Group of Business Services 1. In the Target Navigation panel of Fusion Middleware Control, expand SOA > service-bus and then click the name of the project containing the business service to configure. The Service Bus Project home page appears. 2. On the Operations tab, perform a search for the business service. The results appear in the Operations table. 3. Click the name of the business service to display its home page. 4. If the Properties page is not visible, click the Properties tab. 5. Clear the Throttling State check box. 6. Click Apply. 15.5 Configuring Throttling for a Group of Business Services You create and configure throttling groups in either Oracle JDeveloper or the Oracle Service Bus Console, depending on which you use to develop your projects. In order to enable throttling for the business services in a throttling group, you must enable throttling for the group and for each business service in the group. 15.5.1 Creating Throttling Groups Use throttling groups to restrict the flow of messages to remote servers from a group of business services. To create a a throttling group: 1. Do one of the following: • For JDeveloper: In the Application Navigator, right-click the project or folder to contain the new service account, point to New, and select Throttling Group. • For Oracle Service Bus Console: In the Project Navigator, right-click the project or folder to contain the new service account, point to Create, and select Resource. From the Resource Gallery, click Miscellaneous, click Throttling Group, and then click OK. 2. Enter a unique name for this throttling group, and an optional description. 3. Click Create or Finish. The Throttling Group Definition Editor appears. 4. To enable throttling for the group, select Throttling State. 5. Enter the following information: • Maximum Concurrency: The maximum number of records the business services in the group can process concurrently. • Throttling Queue: The maximum number of messages in the throttling queue. • Message Expiration: The number of milliseconds a message can be in the queue before expiring. 15-6 Administering Oracle Service Bus Configuring Throttling for a Group of Business Services For more information about these properties, see the online help provided with Service Bus. 6. Click Save. The throttling group is created and saved in the current session. Note: In the Oracle Service Bus Console, the throttling group is discarded if you discard the session. The session must be activated for the new information take effect. 7. To add business services to a throttling group, continue to Associating Business Services with a Throttling Group. 15.5.2 Associating Business Services with a Throttling Group Once you create a throttling group, you can associate business services with that group and remove business services that are already associated with the group. To associate business services with a throttling group: 1. Launch either Oracle JDeveloper or Oracle Service Bus Console. 2. In the Project Navigator or Application Navigator, click or double-click the throttling group with which you want to associate business services. 3. Above the Associated Business Services table, click Edit or Add. A dialog appears so you can select the business services to add. 4. If you are using the Oracle Service Bus Console, perform a search for the business services to add. Searching with no criteria returns all business services. 5. Expand the projects and select the business services to associate with the throttling group. 6. Click OK. 7. If you associate a business service in error, select that business service in the Associated Business Service table and click Delete. 8. Click Save. The service account is created and saved in the current session. 15.5.3 Editing Throttling Groups Once you create a throttling group you can modify the throttling properties or disable the group if you no longer need to restrict the message flow for the group. To edit a throttling group: 1. Launch either Oracle JDeveloper or Oracle Service Bus Console. 2. In the Application Navigator or Project Navigator, expand the project and folders containing the throttling group to edit. Configuring Business Services for Message Throttling 15-7 Configuring Throttling for a Group of Business Services 3. Right-click the throttling group name, and select Open. 4. Make any of the following changes: • To disable throttling for the group, clear the Throttling Enabled check box. • Modify any of the throttling properties. • To associate additional business services with the group, click Add or Edit above the Associated Business Services table, and associate new services as described in Creating Throttling Groups. • To remove a business service from the group, select that business service in the Associated Business Service table and click Delete. 5. When you are done making changes, click Save. 6. If you are using the Oracle Service Bus Console, click Activate to end the session and deploy the configuration to the runtime. 15.5.4 Deleting a Throttling Group When you delete a throttling group, any messages currently being processed and any messages in the throttling queue are processed completely. The associated business services might still be configured for individual throttling in Fusion Middleware Control. If you want to disable throttling for all business services in the group, be sure to disable them individually, as described in Disabling Throttling for a Single Business Service. To delete a throttling group: 1. Launch either Oracle JDeveloper or Oracle Service Bus Console. 2. In the Application Navigator or Project Navigator, expand the project and folders containing the throttling group to delete. 3. Right-click the throttling group, and select Delete. 4. Click OK or Yes on the confirmation dialog. 5. If you are using the Oracle Service Bus Console, click Activate to end the session and deploy the configuration to the runtime. 15-8 Administering Oracle Service Bus 16 Managing Resequencer Tables This chapter provides information about cleaning up the database tables that store resequencing data. When Service Bus projects use resequencing to re-order incoming messages, the message payload and metadata, as well as resequencing group information, are stored in the resequencing database tables. Service Bus provides scripts to help you manage the size of these tables and clean up old records. This chapter includes the following sections: • About the Resequencer Database Tables • Purging Oracle Service Bus Resequencer Data • Reconfiguring an Active Resequencer is not Supported 16.1 About the Resequencer Database Tables The resequencer relies on a database to store, group, and re-order the messages it processes. This database contains tables for storing message and group information for the resequencer. This database is automatically created when you run Repository Creation Utility (RCU) for a domain. You can configure the resequencer to automatically purge messages that are processed successfully, but even so there will be times when you need to manually manage the resequencing data in the database. Service Bus provides SQL purge scripts to let you purge resequencing data and clean up the database. 16.1.1 Database Table Purge Scripts The scripts to purge Service Bus resequencer data are located with the other SOA Suite component purge scripts in /MW_HOME/soa/common/sql/soainfra/sql/ oracle/122100/soa_purge12. When you run the main SOA Suite purge script, which purges data for all components, the Service Bus resequencing data is also purged. Group information for resequencing groups is not deleted because it includes the necessary information about the next sequence ID for that group. Purging this information is the same as starting the group from the initial sequence ID, which may not be your intent. Note that the SOA Suite purge procedures can be run in parallel or looped mode. The Service Bus procedure can be run in looped only. 16.1.2 Automatic Purging of Completed Resequencer Messages Service Bus provides a global setting, Purge Completed Messages, that determines whether resequenced messages are purged automatically once they are successfully processed. Processed messages are purged from the database using the following guidelines: Managing Resequencer Tables 16-1 About the Resequencer Database Tables • Messages that are successfully processed are deleted automatically from the database only if Purge Completed Messages is selected. This setting is selected by default. If you do not want messages to be automatically purged, you must clear the setting's check box. • For all types of resequencers, message metadata is automatically purged if Purge Completed Messages is selected. • Failed messages are never purged. • Group information is not purged. For cases where messages and metadata are not automatically purged, Service Bus provides scripts to purge and manage the resequencer tables in the database. 16.1.3 The Datasource for Resequencing The resequencer uses the default Oracle SOA Suite datasource, jdbc/ SOADataSource, to connect to the resequencing tables in the database. This datasource is automatically created when you install SOA Suite or Service Bus and create a WebLogic Server domain. For the resequencer datasource, the JNDI name must be jdbc/SOADataSource, and it connects to the soainfra database created by Repository Creation Utility (RCU). 16.1.4 Purge Scripts and Resequenced Message Purge States The purge scripts include purge commands to purge the information persisted in the Service Bus resequencer tables (osb_msg, osb_group_status, and osb_resequencer_message). The following information is purged from the resequencer tables when you run the purge scripts: • Completed and aborted messages for all resequencer types • Timed out messages for standard resequencers • Groups in a ready state for best effort and FIFO (first in/first out) resequencers (these are the only groups that can be purged) To allow fault recovery and message processing to be completed, the purge scripts do not purge all resequenced message information. In addition, standard resequencer groups store information that should not be purged. The following are not purged when you run the purge scripts: • Faulted messages for all resequencer types • Running messages for all resequencer types • Group information for standard resequencers • Groups in a state other than ready for best effort and FIFO resequencers Note: The purge scripts remove messages first and then move on to groups. If there are messages for a group in the osb_resequencer_message table, the group cannot be deleted. 16-2 Administering Oracle Service Bus Purging Oracle Service Bus Resequencer Data The above describes the processing of the purge scripts, regardless of whether instance tracking is enabled or disabled. Before any sequence groups are purged, a check is performed to verify that all messages associated with the group are processed. Below is a list of group state codes used in the resequencer tables: • 0: Ready • 1: Locked • 2: Error • 4: Timed out • 6: Group error Below is a list of message state codes used in the resequencer tables: • 0: Ready • 1: Locked • 2: Completed • 3: Error • 4: Timed out (this is ignored) • 5: Aborted 16.2 Purging Oracle Service Bus Resequencer Data You can run the resequencer purge scripts for Service Bus as part of the overall SOA Suite database management scripts, or you can run scripts just for Service Bus. For more information about the overall SOA Suite database strategy, see Managing Database Growth in Administering Oracle SOA Suite and Oracle Business Process Management Suite. Note: SOA Suite uses an Auto Purge feature in Fusion Middleware Control, which automatically purges data from the database tables. This feature does not purge any data from the Service Bus resequencer tables. 16.2.1 Configuring the Resequencer to Automatically Purge Completed Messages Service Bus provides a global setting that lets you specify whether messages are automatically removed from the resequencing database tables once they are completely processed. This does not purge any group information or any faulted, running, or aborted messages; it only purges successfully processed messages. You cannot retrieve messages that have been purged. To automatically purge completed messages: 1. In Fusion Middleware Control, expand SOA and select service-bus. 2. Click the Global Settings tab. Managing Resequencer Tables 16-3 Purging Oracle Service Bus Resequencer Data 3. In the Resequencing section, select Purge Completed Messages. Note that this is the default setting. 4. Click Apply. Messages that are processed successfully by the resequencer will be purged upon completion. 16.2.2 Using SQL Scripts to Purge Resequencer Tables You can purge data from Service Bus resequencer tables as part of running the full SOA Suite purge procedures, or, if you want to purge just Service Bus resequencer tables on their own, you can run the Service Bus resequencer procedure, soa_osb.deleteOSBResequencerInstances. The purge scripts are located in / MW_HOME/soa/common/sql/soainfra/sql/oracle/122100/soa_purge12, and the Service Bus scripts are located in the /osb subdirectory. 16.2.2.1 Setting up the Environment and Scripts The following steps provide general steps for running the purge scripts. For more information, see Deleting Large Numbers of Instances with SQL*Plus in Administering Oracle SOA Suite and Oracle Business Process Management Suite. Note that the above link includes information about the parallel processing, which does not apply to Service Bus. To set up the database and load the purge scripts: 1. Create a directory named PurgeLogs in the scripts directory (/MW_HOME/soa/ common/sql/soainfra/sql/oracle/122100/soa_purge12). For diagnostics, the logs are written to this directory (called SOA_PURGE_DIR in the database), which must exist on the file system. 2. Connect to the database with a SQL editor as SYSDBA. 3. Run the following commands to grant privileges to the user who executes the scripts: GRANT EXECUTE ON DBMS_LOCK TO USER_NAME; GRANT CREATE JOB TO USER_NAME; Caution: Do not use the DEV_MDS user to run the purge scripts. Doing so results in errors. 4. Run the following commands to define the diagnostic log directory and grant privileges to the above user: CREATE OR REPLACE DIRECTORY SOA_PURGE_DIR AS 'SCRIPT_LOCATION/PurgeLogs'; GRANT READ, WRITE ON DIRECTORY SOA_PURGE_DIR TO USER_NAME; 5. Connect to the database with a SQL editor using the user name to which you granted privileges in the previous steps. Do this from the location of the purge scripts so the scripts are easily available. The scripts are located in /MW_HOME/soa/common/sql/soainfra/sql/ oracle/122100/soa_purge12. 16-4 Administering Oracle Service Bus Purging Oracle Service Bus Resequencer Data 6. Run the following command to load the purge scripts: @soa_purge_scripts.sql You are now ready to purge the data, as described in Running the Oracle Service Bus Purge Procedure. 16.2.2.2 Running the Oracle Service Bus Purge Procedure The following steps describe how to purge only Service Bus data. Running the Service Bus Purge Scripts provides an example of running the Service Bus purge scripts, but Running the SOA Suite Purge Scripts (In Looped Mode) does provide an example of running the procedure for the full SOA Suite. For information and instructions on using the SOA Suite purge procedures, see Deleting Large Numbers of Instances with SQL*Plus in Administering Oracle SOA Suite and Oracle Business Process Management Suite. To run the Service Bus purge procedure: 1. Complete the steps under Setting up the Environment and Scripts, and connect to the database with a SQL editor using same the user name as in step 5 in that section. 2. Run the following commands to log debug information during the purge: @common/debug_on.sql SET SERVEROUTPUT ON; 3. Run the following command to capture the output in a spool file: spool '/MW_HOME/soa/common/sql/soainfra/sql/oracle/122100 /soa_purge12/PurgeLogs/spool.log' 4. Run the following command to purge Service Bus resequencer data: execute soa_osb.deleteOSBResequencerInstances (batch_size, min_creation_date,max_creation_date); Where: • batch_size is the maximum number of records to delete at a time. The default value is 20000. • min_creation_date is the earliest creation date for the records to be removed. • max_creation_date is the latest creation date for the records to be removed. 5. Run the following command to stop writing information to the spool file: spool off 16.2.2.3 Running the Service Bus Purge Scripts The following example purges resequencer records that were created starting on 01/01/2014 and ending on /3/31/2014, in batches of 10000 records. Records are purged for Service Bus only. execute soa_osb.deleteOSBResequencerInstances ( 10000, to_timestamp('2014-01-01','YYYY-MM-DD'), to_timestamp('2014-03-31','YYYY-MM-DD')); Managing Resequencer Tables 16-5 Reconfiguring an Active Resequencer is not Supported 16.2.2.4 Running the SOA Suite Purge Scripts (In Looped Mode) The following example clears SOA Suite data, including Service Bus resequencing data, with creation dates starting on January 1, 2011 and ending on January 31, 2011 and with a retention for all instances updated by January 31, 2011, a batch size of 20000 instances, and a runtime of 60 minutes. execute soa.delete_instances ( to_timestamp('2010-01-01','YYYY-MM-DD'), to_timestamp('2010-01-31','YYYY-MM-DD'),20000,60, to_timestamp('2010-01-31','YYYY-MM-DD'),false); 16.3 Reconfiguring an Active Resequencer is not Supported Resequencing configuration should not be modified while the resequencer is active and processing messages. Changing the configuration of an active resequencer can result in unexpected behavior, including messages and metadata being left in the database even if Service Bus is configured for automatic purging of resequenced messages. For example, if you remove a resequencer from a pipeline, messages that were not yet processed remain in the database. If you modify the resequencer configuration while it is processing messages, messages might not be processed and could remain in the database. For more information about working with an active resequencer, see How Deployment Activities Affect Resequencing and How Server Shutdown Affects Resequencing. To change the resequencing strategy: 1. Stop the resequencer for the component you are reconfiguring. 2. Clean up the database tables using the scripts described in this chapter. 3. Reconfigure resequencing for the component. 4. Re-activate or redeploy the component. 16-6 Administering Oracle Service Bus Part V Troubleshooting Oracle Service Bus Services This part provides information about the tools you can use to diagnose issues with your running Service Bus services. This part contains the following chapters: • Using Execution Tracing to Diagnose Problems • Using the Diagnostic Frameworks to Diagnose Problems 17 Using Execution Tracing to Diagnose Problems This chapter describes how to enable and use execution tracing for Oracle Service Bus services in Fusion Middleware Control. It includes the following sections: • Introduction to Execution Tracing • Enabling and Disabling Execution Tracing • Accessing Execution Tracing Information 17.1 Introduction to Execution Tracing Service Bus lets you trace messages without having to shut down the server, a useful feature in both development and production environments. Execution tracing allows administrators, support engineers, and systems engineers to troubleshoot and diagnose a message flow in one or more pipelines or split-joins. For example, if one of your pipelines is failing and you want to find out at which stage the problem exists, you can enable execution tracing for that pipeline. After tracing is enabled, the system logs various details extracted from the message flow such as stage name, name of the pipeline, and route node name. The log entry also includes the entire message context, including headers and message body. When a fault occurs in the message flow, additional details such as error code and reason are logged. Execution tracing occurs at the beginning and end of each component in the pipeline, which includes stages, pipeline pairs, branches, and nodes. Actions are not traced individually. 17.2 Enabling and Disabling Execution Tracing Service Bus lets you trace messages without having to shut down the server, making it easier to troubleshoot and diagnose a message flow. By default, execution tracing is disabled. After you enable execution tracing, the system logs various information culled from the pipeline context and the message context, including stage name; pipeline or route node name; and the current message context. You can enable execution tracing for a pipeline or split-join in Fusion Middleware Control on the Operations tab for the server or project, or on the Properties tab for the pipeline or split-join. 17.2.1 Setting Oracle WebLogic Server Log Levels To see tracing in the log file or standard out (server console), Oracle WebLogic Server logging must be set to the following severity levels: • Minimum severity to log: Info Using Execution Tracing to Diagnose Problems 17-1 Accessing Execution Tracing Information • Log file: Info • Standard out: Info For information on setting log severity levels, see Using Log Severity Levels in Configuring Log Files and Filtering Log Messages for Oracle WebLogic Server. 17.2.2 Configuring Execution Tracing for a Single Service To configure execution tracing for one service: 1. Perform a search for services, as described in Searching for Services to Configure Their Operational Settings. 2. In the Operations table, click the pipeline or split-join you want to configure. The Properties page for that service appears. 3. Next to Execution Tracing, select Enabled. 4. Click Apply. 17.2.3 Configuring Execution Tracing for Multiple Services To configure execution tracing for multiple services: 1. Perform a search for services, as described in Searching for Services to Configure Their Operational Settings. 2. To enable execution tracing for any pipeline or split-join in the results list, select its check box in the Exe Tracing column. 3. To disable execution tracing for any pipeline or split-join in the results list, clear its check box in the Exe Tracing column. 4. Click Apply. 17.3 Accessing Execution Tracing Information Execution tracing information is stored in the server directory logs at the following location: DOMAIN_HOME/servers/server_name/logs/server_name-diagnostic.log You can view the log file directly, or you can view log entries in Oracle WebLogic Server Administration Console and Fusion Middleware Control. Note: The execution tracing pattern in the server log is identical to the execution tracing in the Test Console. The following example shows a sample execution tracing entry in the log file. Example - Tracing Entry Example ####<Dec 6, 2013 12:32:35 PM PST> <Info> <oracle.osb.pipeline.kernel.router> <MyServer> <osb_server1> <[ACTIVE] ExecuteThread: '19' for queue: 'weblogic.kernel.Default (self-tuning)'> <<anonymous>> 17-2 Administering Oracle Service Bus Accessing Execution Tracing Information <BEA1-7438AA7859AFBEC29BF0> <7f5b2958-8673-4439-87ec-f860ccac436b-0005f450> <1386361955302> <OSB-382159> <[OSB Tracing] The following variables are changed: $body = <soapenv:Body xmlns:soapenv="http://schemas.xmlsoap.org/soap/envelope/"> <cus:Customer xmlns:cus="http://oracle.com/Customer"> <cus:first>Mike</cus:first> <cus:last>Morse</cus:last> <cus:company>CompanyA</cus:company> </cus:Customer> </soapenv:Body> $inbound = <con:endpoint name="ProxyService$osb-102-FileHandling$CustomerPoller" xmlns:con="http://www.bea.com/wli/sb/context"> <con:service/> <con:transport> <con:uri>file:///customer/data/input</con:uri> <con:mode>request</con:mode> <con:qualityOfService>exactly-once</con:qualityOfService> <con:request xsi:type="file:FileRequestMetaData" xmlns:file="http://www.bea.com/wli/sb/transports/file" xmlns:xsi="http://www.w3.org/2001/XMLSchema-instance"> <tran:headers xsi:type="file:FileRequestHeaders" xmlns:tran="http://www.bea.com/wli/sb/transports"> <file:fileName>/customer/data/input/CustList.txt </file:fileName> </tran:headers> <tran:encoding xmlns:tran="http://www.bea.com/wli/sb/transports">utf-8 </tran:encoding> <file:isFilePath>false</file:isFilePath> </con:request> </con:transport> <con:security> <con:transportClient> <con:username>anonymous></con:username> </con:transportClient> </con:security> </con:endpoint> > ####<Dec 6, 2013 12:32:35 PM PST> <Info> <oracle.osb.pipeline.kernel.router> <MyServer> <osb_server1> <[ACTIVE] ExecuteThread: '19' for queue: 'weblogic.kernel.Default (self-tuning)'> <<anonymous>> <BEA1-7438AA7859AFBEC29BF0> <7f5b2958-8673-4439-87ec-f860ccac436b-0005f450> <1386361955303> <OSB-382186> <[OSB Tracing] Exiting Pipeline> Using Execution Tracing to Diagnose Problems 17-3 Accessing Execution Tracing Information 17-4 Administering Oracle Service Bus 18 Using the Diagnostic Frameworks to Diagnose Problems This chapter describes how to identify Service Bus problems and take the proper corrective actions with the assistance of the WebLogic Diagnostic Framework (WLDF) and the Oracle Fusion Middleware Diagnostic Framework (DFW). This appendix includes the following sections: • Understanding Diagnostics for Oracle Service Bus • Working with Oracle Service Bus Diagnostic Dumps • Generating Diagnostic Dumps Using RDA • Viewing Incident Packages with ADR Tools • Querying Problems and Incidents 18.1 Understanding Diagnostics for Oracle Service Bus Service Bus leverages the Oracle Fusion Middleware Diagnostic Framework along with WebLogic Diagnostic Framework (WLDF) to help you detect, diagnose, and resolve problems. WLDF lets you monitor diagnostic scenarios by watching specific logs and metrics for specified conditions and sending a notification when a condition is met. The Diagnostic Framework lets you gather diagnostic scenarios specific to Service Bus into data dumps that are formatted for viewing and analyzing. WebLogic and SOA Suite both provide several predefined diagnostic dumps to help you with diagnostics. In addition, Service Bus supports the following diagnostic dumps: • Derived Resource Caches • JMS Request/Response Correlation Table • MQ Request/Response Correlation Table For information about the diagnostic frameworks, watches, and notifications, see "Diagnosing Problems" in the Administering Oracle Fusion Middleware. For information about using the diagnostic frameworks with SOA Suite (including generated dumps, setting up watches and notifications, and predefined diagnostic dumps), see "Diagnosing Problems with SOA Composite Applications" in Administering Oracle SOA Suite and Oracle Business Process Management Suite. 18.1.1 Oracle WebLogic Diagnostic Framework WLDF is a monitoring and diagnostics framework included with Oracle WebLogic Server that defines and implements a set of services that run within WebLogic Server Using the Diagnostic Frameworks to Diagnose Problems 18-1 Understanding Diagnostics for Oracle Service Bus processes and that participate in the standard server life cycle. Using WLDF, you can capture the diagnostic data generated by a running server, and set watches and notifications when certain conditions are met. Defining watches and notifications helps you collect the diagnostic data to identify problems, enabling you to isolate and diagnose faults when they occur. For more information about WLDF, see Configuring and Using the Diagnostics Framework for Oracle WebLogic Server. 18.1.1.1 Watches and Notifications When you create a watch, it monitors server and application states and sends notifications based on criteria that you define. Watches and notifications are configured as part of a diagnostic module targeted to one or more server instances in a domain. When you create a watch, you build rule expressions for monitoring using the attributes of Service Bus and Oracle WebLogic Server MBeans in Oracle WebLogic Server Administration Console. As an example, you could set up a watch to be notified when the percentage of free heap memory falls below 25%. You can configure watches and notifications using Service Bus message IDs. For information about creating watches and notifications, see Configuring the Diagnostic Framework in Administering Oracle Fusion Middleware. 18.1.1.2 Diagnostic Scenarios and MBeans The Diagnostic Framework provides MBeans you can use to configure how data is collected. The watch rule expressions that you create use the attributes of Service Bus and Oracle WebLogic Server MBeans to collect data and perform monitoring. You diagnose scenarios with available MBeans to provide statistics about that scenario or to log messages. The attributes of the following MBeans are available: • Oracle WebLogic Server MBeans • Diagnostic Service Bus MBeans • DMS metrics exposed as MBeans Service Bus provides several MBeans so you can monitor the following with watches and notifications: • Configuration Framework • Proxy and Business Services • Pipelines and Split-Joins • Sessions For more information about Oracle WebLogic Server MBeans, see MBean Reference for Oracle WebLogic Server. 18.1.2 Oracle Fusion Middleware Diagnostic Framework The Diagnostic Framework aids in detecting, diagnosing, and resolving problems by targeting critical errors, such as those caused by code bugs, metadata corruption, customer data corruption, deadlocked threads, and inconsistent state. The Diagnostic Framework detects critical failures and captures dumps of relevant diagnostics information. WLDF watches and notifications trigger the events for which the Diagnostic Framework listens and then generates appropriate data dumps. 18-2 Administering Oracle Service Bus Understanding Diagnostics for Oracle Service Bus For information about how the Diagnostic Framework processes events, see How the Diagnostic Framework Works in Administering Oracle Fusion Middleware. 18.1.2.1 Diagnostic Dumps A diagnostic dump captures and dumps specific diagnostic information automatically when an incident is created or manually on the request of an administrator. When executed as part of incident creation, the dump is included with the set of incident diagnostics data. Examples of diagnostic dumps include JVM thread dumps, JVM class histogram dumps, and DMS metric dumps. The Diagnostic Framework provides several predefined dumps. For more information, see Investigating, Reporting, and Solving a Problem in Administering Oracle Fusion Middleware. In addition to the dumps provided by the Diagnostic Framework, Service Bus includes dumps to provide diagnostics specific to Service Bus. For more information, see Working with Oracle Service Bus Diagnostic Dumps. 18.1.3 About the Automatic Diagnostic Repository The Automatic Diagnostic Repository (ADR) is a file-based hierarchical repository for diagnostic data, such as traces and dumps. Oracle Fusion Middleware components store all incident data in the ADR, and each Oracle WebLogic Server stores diagnostic data in subdirectories of its own home directory within the ADR. For more information about the ADR, see Automatic Diagnostic Repository in Administering Oracle Fusion Middleware. 18.1.4 Predefined Incident Processing Rules When you create a watch in the Oracle WebLogic Server Administrator's Console, you also define a notification. Oracle Fusion Middleware defines a default notification named FMWDFW notification. While you can create your own notifications, selecting FMWDFW notification creates the Service Bus dumps described in Working with Oracle Service Bus Diagnostic Dumps. For information about creating custom notifications, see Configuring Custom Diagnostic Rules in Administering Oracle Fusion Middleware. 18.1.5 Dynamic Monitoring Service Metrics Using the Oracle Dynamic Monitoring Service (DMS), Oracle Fusion Middleware components can provide administration tools, such as Fusion Middleware Control, with data regarding the component's performance, state, and on-going behavior. DMS measures and reports metrics, trace events, and system performance and provides a context correlation service for these components. Dynamic Monitoring Service (DMS) metrics with noun types are exposed as Service Bus MBeans to use for diagnosing problems. DMS nouns can be used to create watches in Oracle WebLogic Server Administration Console. Service Bus uses DMS to capture the response time for a Service Bus proxy service. Service Bus defines one phase event sensor, response, whose parent noun is the service path. Table 18-1 shows the supported Service Bus DMS nouns. It also includes the parent nouns to illustrate the noun hierarchy. Using the Diagnostic Frameworks to Diagnose Problems 18-3 Understanding Diagnostics for Oracle Service Bus Table 18-1 Service Bus Sensors Noun Path Noun Sensor Type Parent Noun /domain_name/server_name/ project_name Context NA osb_context None PROXY or BIZ Service Type NA osb_service_t ype Context Full path to the service, including folders and service name (replacing the slash or backslash with a hyphen). Service Path response osb_service_p ath Service Type Given the following Service Bus environment, the examples provided below illustrate Context and Service Path names. Environment • Domain name: servicebus • Server name: osb_server1 • Service Bus project name: TravelPoints • Proxy services folder name (in the TravelPoints project): TravelProxyServices • Proxy service name: CalculatePoints Examples • Context: /servicebus/osb_server1/TravelPoints • Service Path: TravelProxyServices-CalculatePoints DMS allows each noun to be referenced using a path delimited by '/'. The delimiter (/) in the path is used to identify the parent nouns. For example, the Service Path noun in the above example can be directly referenced by the following: /servicebus/osb_server1/TravelPoints/PROXY/TravelProxyServices-CalculatePoints The response sensor captures the following information: Metric Description time The total response time across all activations. completed The number of completed activations. minTime Shortest completed activation. maxTime Longest completed activation. avg The average time to complete activation. active The number of current incomplete activations. maxActive The maximum number on concurrent open activations. For additional information about DMS, see Using the Oracle Dynamic Monitoring Service in Tuning Performance. 18-4 Administering Oracle Service Bus Working with Oracle Service Bus Diagnostic Dumps 18.2 Working with Oracle Service Bus Diagnostic Dumps In addition to the diagnostic dumps available with Oracle WebLogic Server and Oracle SOA Suite, Service Bus supports the creation of the diagnostic dumps in Table 18-2. Table 18-2 Service Bus Diagnostic Dumps Dump Description OSB.derivedcaches A collection of statistics about all Service Bus derived resource caches on the server OSB.jms-asynctable Service Bus JMS request/response correlation table OSB.mq-asynctable Service Bus MQ request/response correlation table 18.2.1 Listing the Available Diagnostic Dumps This section describes how to use WebLogic Scripting Tool commands to work with diagnostic dumps. For more information about these commands, see Diagnostic Commands in WLST Command Reference for WebLogic Server. For more information about Diagnostic Framework dumps, see Diagnosing Problems in Administering Oracle Fusion Middleware. To list the available diagnostic dumps: 1. Navigate to MW_HOME/oracle_common/common/bin, and run the following command to start WLST: ./wlst.sh Note: You must start WLST from MW_HOME/oracle_common/common/bin. Otherwise, the ODF functions are missing. 2. To connect to the server on which Service Bus is installed, run the following command: connect('user_name', 'password','t3://hostname:port_number') A message appears indicating whether the connection succeeded. 3. To list the available Diagnostic Framework dumps, run the following command: listDumps() A list of available dumps appears on the console. Use the command describeDump(name=dumpName) for help with a specific dump. 4. To list the available dumps for Service Bus, run the following command: listDumps(appName='OSB') Using the Diagnostic Frameworks to Diagnose Problems 18-5 Working with Oracle Service Bus Diagnostic Dumps A list of Service Bus dumps appears on the console. 18.2.2 Derived Resource Caches Diagnostic Dumps (OSB.derived-caches) The following table describes the Service Bus derived resource caches diagnostic dumps. The information captured includes the name of each cache type, statistical information for each cache, and information about each cached entry. Table 18-3 JMS Correction Table Diagnostic Dumps Dump Name Dump Parameters/Dump Mode Information Captured OSB.derivedcaches None For each derived resource cache managed in the Service Bus runtime, the following information is provided: • • • • • Derived resource cache type Product version Total number of configured cache entries Cache entries in use Total hits to entries in the cache server since the server was last started • Total misses while trying to access cached information since the server was last started • Hit ratio of the cache sine the server was last started For each cache entry, the following information is provided: • Ref that is being cached • Create date and time • Amount of time spent computing the cache entry. This is the time taken to create the cached information in milliseconds. 18.2.2.1 Oracle Service Bus Derived Resource Caches The following table lists each Service Bus cache included in the diagnostic information. Table 18-4 Oracle Service Bus Derived Resource Caches Cache Description Archive ClassLoader Dependency-aware archive class loaders. Archive Summary Archive summaries. CodecFactory Codec factories. EffectiveWSDL Effective WSDL objects that are derived from the service or WSDL resources of business or proxy services. Flow_Info Message flow information objects. LightweightEffectiveWSDL Effective WSDL objects that are derived from the service or WSDL resources of business or proxy services. MflExecutor MFL executors. 18-6 Administering Oracle Service Bus Working with Oracle Service Bus Diagnostic Dumps Cache Description RouterRuntime Compiled router run times for proxy services. RuntimeEffectiveWSDL Session valid effective WSDL objects derived from the service or WSDL resources of business or proxy services. RuntimeEffectiveWSPolicy WS policies for business or proxy services. SchemaTypeSystem Type system information for MFL, XS, and WSDL documents. ServiceAlertsStatisticInfo Service alert statistics for business or proxy services. ServiceInfo Compiled service information for business or proxy services and for WSDL documents. Wsdl_Info WSDL information objects. WsPolicyMetadata Complied WS-Policy metadata. XMLSchema_Info XML schema information for XML schema objects. XqueryExecutors XQuery executors. XsltExecutor XSLT executors. alsb.transports.ejb. bindingtype EJB binding information for EJB business services. alsb.transports.jejb.business . bindingtype JEJB binding information for JEJB business services. alsb.transports.jejb.proxy. bindingtype JEJB binding information for JEJB proxy services. 18.2.2.2 Viewing a description of the derived resource caches dump To view a description of the derived resource caches dump: • Run the following WLST command: describeDump(name='OSB.derived-caches',appName='OSB') The name, description, and arguments for the dump appear on the console. 18.2.2.3 Running the derived resource caches dump To run the derived resource caches dump: • Run the following WLST command: executeDump(name='OSB.derived-caches', appName='OSB') Sample Output of the Derived Resource Cache Dump displays a sample of the output of a derived resource cache dump. 18.2.2.4 Sample Output of the Derived Resource Cache Dump Information similar to the following example appears after running the derived resource caches dump, as described in Running the derived resource caches dump. Parts of this dump have been truncated for readability. Using the Diagnostic Frameworks to Diagnose Problems 18-7 Working with Oracle Service Bus Diagnostic Dumps <derivedCaches xmlns="http://www.bea.com/wli/config/xmltypes"> <derivedCache cacheType="RuntimeEffectiveWSDL"> <configuredEntries>2147483647</configuredEntries> <cacheEntriesInUse>0</cacheEntriesInUse> <totalHits>0</totalHits> <totalMisses>0</totalMisses> <hitRatio>0.0</hitRatio> <cacheEntries/> </derivedCache> ... <derivedCache cacheType="ServiceAlertsStatisticInfo"> <configuredEntries>2147483647</configuredEntries> <cacheEntriesInUse>9</cacheEntriesInUse> <totalHits>0</totalHits> <totalMisses>51</totalMisses> <hitRatio>0.0</hitRatio> <cacheEntries> <cacheEntry> <ref>services/bs_dq_uri4.BusinessService</ref> <creationTime>2012-03-22T23:44:53.737-07:00</creationTime> <computeTimeMSecs>0</computeTimeMSecs> </cacheEntry> <cacheEntry> <ref>services/bs_dq_nopooling.BusinessService</ref> <creationTime>2012-03-22T23:44:53.736-07:00</creationTime> <computeTimeMSecs>0</computeTimeMSecs> </cacheEntry> <cacheEntry> <ref>services/bs_dq_uri1.BusinessService</ref> <creationTime>2012-03-22T23:44:53.738-07:00</creationTime> <computeTimeMSecs>0</computeTimeMSecs> </cacheEntry> <cacheEntry> <ref>services/proxy_dq_uri.ProxyService</ref> <creationTime>2012-03-22T23:44:53.736-07:00</creationTime> <computeTimeMSecs>0</computeTimeMSecs> </cacheEntry> <cacheEntry> <ref>services/bs_dq_conn_pooling.BusinessService</ref> <creationTime>2012-03-22T23:44:53.736-07:00</creationTime> <computeTimeMSecs>0</computeTimeMSecs> </cacheEntry> <cacheEntry> <ref>services/bs_dq_conn_nopooling.BusinessService</ref> <creationTime>2012-03-22T23:44:53.737-07:00</creationTime> <computeTimeMSecs>0</computeTimeMSecs> </cacheEntry> <cacheEntry> <ref>services/bs_dq_uri2.BusinessService</ref> <creationTime>2012-03-22T23:44:53.737-07:00</creationTime> <computeTimeMSecs>0</computeTimeMSecs> </cacheEntry> <cacheEntry> <ref>services/bs_dq_pooling.BusinessService</ref> <creationTime>2012-03-22T23:44:53.736-07:00</creationTime> <computeTimeMSecs>0</computeTimeMSecs> </cacheEntry> <cacheEntry> <ref>services/bs_dq_uri3.BusinessService</ref> <creationTime>2012-03-22T23:44:53.737-07:00</creationTime> <computeTimeMSecs>0</computeTimeMSecs> 18-8 Administering Oracle Service Bus Working with Oracle Service Bus Diagnostic Dumps </cacheEntry> </cacheEntries> </derivedCache> ... </derivedCaches> 18.2.3 Running a JMS Correlation Table Diagnostic Dump (OSB.jms-async-table) Table 18-5 provides details about Service Bus JMS request/response correlation table diagnostic dumps. The information captured includes the correlation ID, expiration, and destination for each message. Table 18-5 JMS Correlation Table Diagnostic Dumps Dump Name Dump Parameters/Dump Mode Information Captured OSB.jms-asynctable None In addition to the Service Bus version, the following information is provided for each pending message in each service reference: • Correlation ID (could be the actual correlation ID or a message ID) • Expiration date and time • Message destination 18.2.3.1 Viewing a Description of the JMS Correlation Table Dump To view a description of the JMS correlation table dump: • Run the following WLST command: describeDump(name='OSB.jms-async-table',appName='OSB') The name, description, and arguments for the dump appear on the console. 18.2.3.2 Running the JMS Correlation Table Dump To run the JMS correlation table dump: • Run the following WLST command: executeDump(name='OSB.jms-async-table', appName='OSB') Sample Output of the JMS Correlation Table Dump shows a sample of the output of a JMS correlation table dump. 18.2.3.3 Sample Output of the JMS Correlation Table Dump The following example is a sample of the output of a JMS correlation table dump. <transportDiagnosticsContents xmlns="http://www.bea.com/wli/sb/transportdiags"> <version>11.1.1.7</version> <transportDiagnostics transportType="jms"> <correlationTable> <services> <service> <ref>default/testJmsResponseRollback_out</ref> <message> <correlationMsgId responsePattern="JMSCorrelationID"> ID:42454153155cc06b7f5ab312000001363d5bd59effff8d4 </correlationMsgId> <expirationTime>2012-03-22T19:53:43.621-07:00</expirationTime> <msgDestination>testJmsResponseRollback_outRequest</msgDestination> Using the Diagnostic Frameworks to Diagnose Problems 18-9 Working with Oracle Service Bus Diagnostic Dumps </message> </service> </services> </correlationTable> </transportDiagnostics> </transportDiagnosticsContents> 18.2.4 Running an MQ Correlation Table Diagnostic Dump (OSB.mq-async-table) Table 18-6 provides details about Service Bus MQ request/response correlation table diagnostic dumps. The information captured includes the correlation ID, expiration, and destination for each message. Table 18-6 MQ Correlation Table Diagnostic Dumps Dump Name Dump Parameters/Dump Mode Information Captured OSB.mq-asynctable None In addition to the Service Bus version, the following information is provided for each pending message in each service reference: • Correlation ID (could be the actual correlation ID or a message ID) • Expiration date and time • Message destination 18.2.4.1 Viewing a Description of the MQ Correlation Table Dump To view a description of the MQ correlation table dump: • Run the following WLST command: describeDump(name='OSB.mq-async-table',appName='OSB') The name, description, and arguments for the dump appear on the console. 18.2.4.2 Running the MQ Correlation Table Dump To run the MQ correlation table dump: • Run the following WLST command: executeDump(name='OSB.mq-async-table', appName='OSB') Sample Output of the MQ Correlation Table Dump shows a sample of the output of an MQ correlation table dump. 18.2.4.3 Sample Output of the MQ Correlation Table Dump The following example is a sample of the output of an MQ correlation table dump. Example - Sample Output of the MQ Correlation Table Dump <transportDiagnosticsContents xmlns="http://www.bea.com/wli/sb/transportdiags"> <version>11.1.1.7</version> <transportDiagnostics transportType="mq"> <correlationTable> <services> <service> <ref>services/mq_Biz_cached</ref> <message> <correlationMsgId responsePattern="MQCorrelationID"> 000000000000000000000000000000000000000000000000 18-10 Administering Oracle Service Bus Generating Diagnostic Dumps Using RDA </correlationMsgId> <expirationTime>2012-03-22T23:48:09.085-07:00</expirationTime> <msgDestination>rc_req</msgDestination> </message> </service> </services> </correlationTable> </transportDiagnostics> </transportDiagnosticsContents> 18.3 Generating Diagnostic Dumps Using RDA In addition to generating Service Bus diagnostic dumps using WSLT, you can also use Oracle Remote Diagnostic Agent (RDA). Before performing the following steps, make sure RDA is installed on your system. For more information and full instructions on using RDA for Service Bus, refer to the knowledge base article, "How to Run Remote Diagnostic Agent (RDA) Against SOA Products," on Oracle support. The ID for this document is 1571554.2. This document describes an additional command to run RDA with minimal prompts. Additional information and instructions are also provided in the README files in the oracle_common directory in your Fusion Middleware home directory To generate a diagnostic dump using RDA 1. Set the environment variables by running the following command: <DOMAIN_HOME>/bin/setDomainEnv 2. From a command line, run the following command: For Windows: rda.cmd -vSCRP OSB For UNIX or LINUX: rda.sh -vSCRP OSB 3. Enter information as prompted on the command line. When asked whether you want RDA to collect Service Bus information, accept the default (Y). 4. You can display the results in your web browser. Access the file from the output directory you specified. The name of the file is prefix__start.htm, where prefix is the prefix you specified. 18.4 Viewing Incident Packages with ADR Tools ADRCI is a command-line utility that enables you to investigate problems and package and upload first-failure diagnostic data to Oracle Support Services. ADRCI also enables you to view the names of dump files in the ADR, and to view the alert log with XML tags stripped, with and without content filtering. For more information about ADRCI, see ADRCI: ADR Command Interpreter in Oracle Database Utilities. For information about other tools, see Managing Diagnostic Data in Oracle Database Administrator’s Guide Using the Diagnostic Frameworks to Diagnose Problems 18-11 Querying Problems and Incidents 18.5 Querying Problems and Incidents The Diagnostic Framework provides WLST commands that let you view information about problems and incidents, including the following: • Querying problems across Oracle WebLogic Servers • Querying incidents across Oracle WebLogic Servers • Viewing dump files associated with an incident on an Oracle WebLogic Server For more information about these WLST commands, see Understanding the Diagnostic Framework in Administering Oracle Fusion Middleware and Diagnostic Commands in WLST Command Reference for WebLogic Server. 18-12 Administering Oracle Service Bus Part VI Appendixes This part includes reference information that might be useful when administering your Service Bus environment. This part contains the following appendixes: • JMX Monitoring API • Using the Oracle Service Bus Deployment APIs • Auditing Your Oracle Service Bus System • Interoperability with WSRP • Role-Based Access in Oracle Service Bus A JMX Monitoring API This appendix describes the Java Management Extensions (JMX) Monitoring API in Oracle Service Bus, which provides external access to Service Bus monitoring data. The primary purpose of the JMX Monitoring API is to provide efficient, lower-level APIs that support bulk operations. It does this using JMX as a transport. This API is not a high-level API compatible with JMX-based tools. However, if you are developing client software, you may want to develop high-level JMX APIs that support JMXbased tooling. This appendix includes the following sections: • Introduction to the JMX Monitoring API • Using the JMX Monitoring API • API Usage Example A.1 Introduction to the JMX Monitoring API The JMX monitoring API makes use of JMX as a transport only. It exposes a public MBean to provide all the required operations to get monitoring data (statistical information) for any monitored service and its components. It also exposes a set of public POJO objects required to carry out operations provided by the MBean. There is no need for third-party client software to know the intricacies of the hierarchy inherent in the statistical information stored in the Service Bus monitoring system. Using these APIs, customers can integrate their monitoring/management systems with Service Bus to do the following: • Identify services enabled for monitoring. • Get detailed statistical information for a specific service, for its components, or for both. • Reset statistics accumulated since the last reset. A.2 Using the JMX Monitoring API The public JMX API is modeled by a single instance of ServiceDomainMBean, which has operations to check for monitored services and retrieve data from them. A public set of POJOs provides additional objects and methods that, along with ServiceDomainMbean, provide a complete API for monitoring statistics. The following sections provide brief descriptions of the POJOs and MBean, along with description of the statistics that are reported for Service Bus resources. The Java API Reference for Oracle Service Bus provides detailed descriptions of the POJOs and MBean. Please be sure to read the important notes at the end of this chapter. JMX Monitoring API A-1 Using the JMX Monitoring API A.2.1 Public POJO Objects The following POJO objects are exposed as part the JMX monitoring API. • ResourceType • ServiceResourceStatistic • ResourceStatistic • StatisticValue • StatisticType A.2.1.1 ResourceType This object represents all types of resources that are enabled for service monitoring. There are four enum constants representing types: SERVICE, FLOW_COMPONENT, URI, and WEBSERVICE_OPERATION. See com.bea.wli.monitoring.ResourceType in the Java API Reference for Oracle Service Bus. A.2.1.2 ServiceResourceStatistic This object represents all business and proxy service resource types and the statistics associated with them. There are methods to get statistics for all resources or for a specific resource. See com.bea.wli.monitoring.ServiceResourceStatistic in the Java API Reference for Oracle Service Bus. A.2.1.3 ResourceStatistic This object represents a resource for which statistics collection is supported. There are methods to get the name of the resource, the type, and the statistics. See com.bea.wli.monitoring.ResourceStatistic in the Java API Reference for Oracle Service Bus. A.2.1.4 StatisticValue This object represents a statistic value for a resource. The monitoring system currently supports the following types of statistic values, all nested classes: • CountStatistic • IntervalStatistic • StatusStatistic StatisticValue is an abstract class so concrete objects representing count and interval statistic values can be derived from it. It includes getName() and getType() methods. See com.bea.wli.monitoring.StatisticValue in the Java API Reference for Oracle Service Bus. A-2 Administering Oracle Service Bus Using the JMX Monitoring API A.2.1.5 StatisticType This object represents predefined types of statistics. There are three enum types: STATUS, COUNT, and INTERVAL. See com.bea.wli.monitoring.StatisticValue in the Java API Reference for Oracle Service Bus. A.2.2 ServiceDomainMBean This MBean represents the service domain. It provides methods to find monitored services, get and reset statistics, and to mark business service endpoint URIs offline. For more information, see com.bea.wli.monitoring.ServiceDomainMBean in the Java API Reference for Oracle Service Bus. A.2.3 MonitoringConfigurationMBean This MBean provides methods to enable and disable monitoring and alerting. Subinterfaces provide methods for managing different types of services in the runtime. For more information, see com.bea.wli.sb.management.configuration.MonitoringConfigurationM Bean in the Java API Reference for Oracle Service Bus. A.2.4 Statistics Collected for Oracle Service Bus The following sections describe the statistics reported for each resource type. • Statistics Details for Resource Type - SERVICE • Statistics for Resource Type–FLOW_COMPONENT • Statistics details for Resource Type – WEBSERVICE_OPERATION • Statistics details for Resource Type – URI A.2.4.1 Statistics Details for Resource Type - SERVICE Service resource types include the inbound and outbound endpoints (proxy and business services) as well as pipelines and split-joins, which transform and route messages. These resources may have associated WSDL files, security settings, and so on. The following statistics are reported for this resource type. Note that certain statistics only apply to certain services, as noted in the table. Table A-1 SERVICE Statistics Statistic Name Type Service Types Alert.pipeline-severity-all count Pipelines Alert.pipeline-severity-critical count Pipelines Alert.pipeline-severity-fatal count Pipelines Alert.pipeline-severity-major count Pipelines Alert.pipeline-severity-minor count Pipelines JMX Monitoring API A-3 Using the JMX Monitoring API Statistic Name Type Service Types Alert.pipeline-severity-normal count Pipelines Alert.pipeline-severity-warning count Pipelines Alert.severity-all count All Alert.sla-severity-all count All Alert.sla-severity-critical count All Alert.sla-severity-fatal count All Alert.sla-severity-minor count All Alert.sla-severity-normal count All Alert.sla-severity-major count All Alert.sla-severity-warning count All Router.elapsed-time interval Pipelines Router.error-count count Pipelines Router.failure-rate derived Pipelines Router.message-count count Pipelines Router.success-rate derived Pipelines Router.validation-errors count Pipeline Security.WebService Security.wss-errors count Business and proxy services SplitJoin.elapsed-time interval SplitJoins SplitJoin.error-count count SplitJoins SplitJoin.failure-rate derived SplitJoins SplitJoin.message-count count SplitJoins SplitJoin.success-rate derived SplitJoins Transport.cache-hit-count count Business services Transport.error-count count Business and proxy services Transport.failover-count count Business services Transport.failure-rate derived Business and proxy services Transport.message-count count Business and proxy services A-4 Administering Oracle Service Bus Using the JMX Monitoring API Statistic Name Type Service Types Transport.response-time interval Business and proxy services Transport.success-rate derived Business and proxy services Transport.throttling-time interval Business services Transport.uri-offline-count count Business services Note: • The wss-error statistic provides Web Service Security violations counts. • When the statistics of a Managed Server are retrieved from a cluster domain using the ServiceDomainMBean the statistics for proxy services will not contain sla-severity-normal, sla-severity-minor, slaseverity-major, sla-severity-warning, sla-severitycritical, sla-severity-fatal, sla-severity-all. • Only the names of the statistics are displayed in Fusion Middleware Control. • Success ratio (*.success-rate statistics) is the percentage ratio of successful messages to total number of messages. Failure ratio (*.failure-rate statistics) is the percentage ratio of failed messages to total number of messages. • The name of statistics are linked to component of the service for which they are collected using '.'. A.2.4.2 Statistics for Resource Type–FLOW_COMPONENT Statistics are collected for pipelines on the pipeline pair and routing nodes. They are collected for split-joins on the branch nodes. Pipelines are one-way processing paths consisting of stages that are executed sequentially against the current message. Stages are used to perform activities such as transformation, logging and publishing. There are three categories of pipelines: request, response, and error. The pipeline-pair node ties together a single request and a single response pipeline into one top-level element. A routing node consists of a set of routes. A route identifies a target service and includes some additional configuration options that determine how the message will be packaged and sent to that service. A routing node will result in at most one route being selected as part of request processing. Split-joins let you split a service payload, such as an order, into individual messages that are sent to multiple services concurrently, as opposed to standard sequential processing. Processing is defined within branches. The following statistics are reported for the flow component of these resources. JMX Monitoring API A-5 Using the JMX Monitoring API Table A-2 FLOW_COMPONENT Statistics Statistic Name Type Service Types Router.Pipeline.name.elapsed-time interval Pipelines Router.Pipeline.name.error-count count Pipelines Router.Pipeline.name.message-count count Pipelines Router.Route Node.name.elapsed-time interval Pipelines Router.Route Node.name.error-count count Pipelines Router.Route Node.name.message-count count Pipelines SplitJoin.Branch.name.elapsed-time interval SplitJoins SplitJoin.Branch.name.error-count count SplitJoins SplitJoin.Branch.name.message-count count SplitJoins Note: Statistics for pipeline-pairs, route nodes, and split-join branches are returned as statistics for flow components. enum value ResourceType.FLOW_COMPONENT represents both pipeline and split-join components. Thus there is no way for a client to check if the returned flow component is a pipeline-pair, route node, or split-join branch. The name of the flow component, however, may suggest the type. A.2.4.3 Statistics details for Resource Type – WEBSERVICE_OPERATION This resource type provides statistical information pertaining to WSDL operations. Statistics are reported for each defined operation. The following statistics are reported. Table A-3 WEBSERVICE_OPERATION Statistics Statistic Name Type Service Type Operation.name.elapsed-time interval Business services, proxy services, and pipelines Operation.name.error-count count Business services, proxy services, and pipelines Operation.name.message-count count Business services, proxy services, and pipelines A.2.4.4 Statistics details for Resource Type – URI This resource type provides statistical information pertaining to endpoint URI for a business service. Statistics are reported for each defined Endpoint URI. The following statistics are reported. A-6 Administering Oracle Service Bus API Usage Example Table A-4 Statistics for Endpoint URI Statistic Name Type Transport.uri.name.error-count count Transport.uri.name.message-count count Transport.uri.name.response-time interval Transport.uri.name.status status Note: You cannot obtain any statistic of the type status for a cluster using the JMX Monitoring APIs. A.2.5 Caveats Please be aware of the following when working with the JMX monitoring API: • A client program will not know about newly added services that have monitoring turned on, or services modified to turn on monitoring, unless it periodically checks for such changes. • Reset operations should not be performed too frequently. Oracle recommends that reset intervals be greater than 15 minutes. • If statistics are reset while proxy or business services are running, the following TransactionConflictException can occur. This is most likely to occur if statistics are reset at system startup. <OSB-382016> <Failed to instantiate router for service...> • Oracle strongly discourages using this API in a concurrent manner with more than one thread or process because a reset performed in one thread or process is not visible to another threads or processes. This caveat also applies to resets performed from Fusion Middleware Control, as such resets are not visible to this API. A.2.6 Performance Performance should be better than or equivalent to that observed in Fusion Middleware Control. A.3 API Usage Example The sample program in this section demonstrates how to use the JMX Monitoring API. The following steps describe how statistics can be retrieved for a proxy service that is enabled for monitoring. 1. Get ServiceDomainMBean from the MBean Server. 2. Get the references for monitored services using the getMonitoredRefs operation of the ServiceDomainMBean. 3. Get ServiceResourceStatistics using the getStatistics operation of the ServiceDomainMBean of the desired service. JMX Monitoring API A-7 API Usage Example 4. Get all ResourceStatistic objects using the operations of getAllResourceStatistics. 5. For each retrieved ResourceStatistic object, get StatisticValue objects using the getStatistics operation and save the statistical information to a file. 6. Repeat process as necessary. A.3.1 Sample Program The following sample program illustrates how to: 1. Find business and proxy services enabled for monitoring. 2. Retrieve statistics for one or more services. 3. Reset statistics for one or more services. 4. Handle exceptions. 5. Save retrieved statistics in the proper format. To run this program, include the following JAR files in the classpath: • weblogic.jar • oracle.servicebus.kernel-api.jar • oracle.servicebus.configfwk.jar • com.bea.core.management.core_version.jar • com.bea.core.management.jmx_version.jar You may need to reset the default values for SERVER_NAME, HOSTNAME, PORT, USERNAME, and PASSWORD in the code below for your environment. Note: If you need to get the Status statistics for each endpoint of a business service, set the SERVER_NAME attribute in a cluster environment. If you are running on a single node, Status statistics are returned even if you do not set this property. For performance reasons, avoid extracting and resetting statistics for a large number of services too often. See Caveats. See the following example for a sample program. Example - Sample Program to Retrieve Statistics for a Proxy Service that is Enabled for Monitoring Note that some lines in the sample below have been wrapped and reformatted for better readability. package tests.monitoring; import import import import com.bea.wli.config.Ref; com.bea.wli.monitoring.*; com.bea.wli.sb.util.Refs; weblogic.management.jmx.MBeanServerInvocationHandler; A-8 Administering Oracle Service Bus API Usage Example import import import import import import import import import import import import import import import import javax.management.MBeanServerConnection; javax.management.MalformedObjectNameException; javax.management.ObjectName; javax.management.remote.JMXConnector; javax.management.remote.JMXConnectorFactory; javax.management.remote.JMXServiceURL; javax.naming.Context; java.io.File; java.io.FileWriter; java.io.IOException; java.lang.reflect.InvocationHandler; java.lang.reflect.Method; java.lang.reflect.Proxy; java.net.MalformedURLException; java.util.*; java.text.SimpleDateFormat; public class ServiceStatisticsRetriever { private ServiceDomainMBean serviceDomainMbean = null; private String serverName = null; /** * Retrieve statistics for all business services being monitored in the * domain and reset statistics for the same. */ void getAndResetStatsForAllMonitoredBizServices() throws Exception { getAndResetStatsForMonitoredServices( new String[] {Refs.BUSINESS_SERVICE_TYPE}, new ResourceType[]{ResourceType.SERVICE, ResourceType.WEBSERVICE_OPERATION, ResourceType.URI}, serverName, "BizStatistics"); } /** * Retrieve statistics for all proxy services being monitored in the * domain and reset statistics for the same. */ void getAndResetStatsForAllMonitoredProxyServices() throws Exception { getAndResetStatsForMonitoredServices( new String[] {Refs.PROXY_SERVICE_TYPE}, new ResourceType[]{ResourceType.SERVICE, ResourceType.FLOW_COMPONENT, ResourceType.WEBSERVICE_OPERATION}, null, "ProxyStatistics"); } /** * Retrieve statistics for all business services being monitored in the * domain and reset statistics for the same. */ void getAndResetStatsForMonitoredServices(String[] typeIds, ResourceType[] resourceTypes, String serverName, String filePrefix) throws Exception { Ref[] serviceRefs = serviceDomainMbean.getMonitoredRefs(typeIds); JMX Monitoring API A-9 API Usage Example try { // Get statistics for a specific server. System.out.println("Now trying to get statistics for -" + serviceRefs.length + " services..."); HashMap<Ref, ServiceResourceStatistic> resourcesMap = serviceDomainMbean.getStatistics( serviceRefs, resourceTypes, serverName); // Reset statistics. long resetRequestTime = serviceDomainMbean.resetStatistics(serviceRefs); // Save retrieved statistics. String fileName = filePrefix + "_" + new SimpleDateFormat("yyyy_MM_dd_HH_mm").format(new Date(System.currentTimeMillis())) + ".txt"; saveStatisticsToFile(resourcesMap, resetRequestTime, fileName); } catch (IllegalArgumentException iae) { System.out.println("===============================\n"); System.out.println("Encountered IllegalArgumentException...Details:"); System.out.println(iae.getMessage()); System.out.println("Check if proxy ref was passed OR flowComp " + "resource was passed OR bitmap is invalid..." + "\nIf so correct it and try again!!!"); System.out.println("==================================\n"); throw iae; } catch (DomainMonitoringDisabledException dmde) { // Statistics not available as monitoring is turned off at domain level. System.out.println("==================================\n"); System.out.println("Statistics not available as monitoring " + "is turned off at domain level."); System.out.println("==============================\n"); throw dmde; } catch (MonitoringException me) { // Internal problem... May be aggregation server is crashed... System.out.println("================================\n"); System.out.println("ERROR: Statistics is not available..." + "Check if aggregation server is crashed..."); System.out.println("=================================\n"); throw me; } } /** * Saves statistics of * * @param statsMap * * @param resetReqTime A-10 Administering Oracle Service Bus all services from the specified map. Map containing statistics for one or more services of the same type; i.e., business or proxy. Reset request time. This information will be API Usage Example * written at the end of the file, provided it is not zero. * @param fileName Statistics will be saved in a file with this name. */ private void saveStatisticsToFile( HashMap<Ref, ServiceResourceStatistic> statsMap, long resetReqTime, String fileName) throws Exception { if (statsMap == null) { System.out.println("\nService statistics map is null...Nothing to save. \n"); return; } if (statsMap.size() == 0) { System.out.println("\nService statistics map is empty...Nothing to save. \n"); return; } FileWriter out = new FileWriter(new File(fileName)); out.write("*********************************************\n"); out.write("This file contains statistics for " + statsMap.size() + " services.\n"); out.write("***********************************************\n"); Set<Map.Entry<Ref, ServiceResourceStatistic>> set = statsMap.entrySet(); System.out.println("\nWriting stats to the file - " + fileName +"\n"); // Print statistical information of each service for (Map.Entry<Ref, ServiceResourceStatistic> mapEntry : set) { out.write("\n\n======= Printing statistics for service " + mapEntry.getKey().getFullName() + "=======\n"); ServiceResourceStatistic serviceStats = mapEntry.getValue(); out.write("Statistic collection time is - " + new Date(serviceStats.getCollectionTimestamp()) + "\n"); try { ResourceStatistic[] resStatsArray = serviceStats.getAllResourceStatistics(); for (ResourceStatistic resStats : resStatsArray) { // Print resource information out.write("\nResource name: " + resStats.getName()); out.write("\tResource type: " + resStats.getResourceType().toString()); // Now get and print statistics for this resource StatisticValue[] statValues = resStats.getStatistics(); for (StatisticValue value : statValues) { out.write("\n\t\tStatistic Name - " + value.getName()); out.write("\n\t\tStatistic Type - " + value.getType()); JMX Monitoring API A-11 API Usage Example // Determine statistics type if (value.getType() == StatisticType.INTERVAL) { StatisticValue.IntervalStatistic is = (StatisticValue.IntervalStatistic) value; // Print interval statistics values out.write("\n\t\t\t\tCount Value - " out.write("\n\t\t\t\tMin Value - " + out.write("\n\t\t\t\tMax Value - " + out.write("\n\t\t\t\tSum Value - " + out.write("\n\t\t\t\tAve Value - " + + is.getCount()); is.getMin()); is.getMax()); is.getSum()); is.getAverage()); } else if (value.getType() == StatisticType.COUNT) { StatisticValue.CountStatistic cs =(StatisticValue.CountStatistic) value; // Print count statistics value out.write("\n\t\t\t\tCount Value - " + cs.getCount()); } else if (value.getType() == StatisticType.STATUS) { StatisticValue.StatusStatistic ss = (StatisticValue.StatusStatistic) value; // Print count statistics value out.write("\n\t\t\t\t Initial Status - " + ss.getInitialStatus()); out.write("\n\t\t\t\t Current Status - " + ss.getCurrentStatus()); } } } out.write("\n=========================================\n"); } catch (MonitoringNotEnabledException mnee) { // Statistics not available out.write("WARNING: Monitoring is not enabled for this service... Do something..."); out.write("=====================================\n"); } catch (InvalidServiceRefException isre) { // Invalid service out.write("ERROR: Invlaid Ref. May be this service is deleted. Do something..."); out.write("======================================\n"); } catch (MonitoringException me) { // Statistics not available out.write("ERROR: Failed to get statistics for this service...Details: " + me.getMessage()); me.printStackTrace(); out.write("======================================\n"); A-12 Administering Oracle Service Bus API Usage Example } } if (resetReqTime > 0) { // Save reset request time. out.write("\n*****************************************\n"); out.write("Statistics for all these services are RESET.\n"); out.write("RESET request time is " + new SimpleDateFormat("MM/dd/yyyy HH:mm:ss").format(new Date(resetReqTime))); out.write("\n****************************************\n"); } // Flush and close file. out.flush(); out.close(); } /** * Init method. * * @param props Properties required for initialization. */ private void init(HashMap props) throws Exception { Properties properties = new Properties(); properties.putAll(props); initServiceDomainMBean(properties.getProperty("HOSTNAME"), Integer.parseInt(properties.getProperty("PORT", "7001")), properties.getProperty("USERNAME"), properties.getProperty("PASSWORD")); serverName = properties.getProperty("SERVER_NAME"); } /** * Gets an instance of ServiceDomainMBean from the weblogic server. */ private void initServiceDomainMBean(String host, int port, String username, String password) throws Exception { InvocationHandler handler = new ServiceDomainMBeanInvocationHandler(host, port, username, password); Object proxy = Proxy.newProxyInstance( ServiceDomainMBean.class.getClassLoader(), new Class[]{ServiceDomainMBean.class}, handler); serviceDomainMbean = (ServiceDomainMBean) proxy; } /** * Invocation handler class for ServiceDomainMBean class. */ public static class ServiceDomainMBeanInvocationHandler implements JMX Monitoring API A-13 API Usage Example InvocationHandler { private String jndiURL = "weblogic.management.mbeanservers.domainruntime"; private String mbeanName = ServiceDomainMBean.NAME; private String type = ServiceDomainMBean.TYPE; private private private private String protocol = "t3"; String hostname = "localhost"; int port = 7001; String jndiRoot = "/jndi/"; private String username = "weblogic"; private String password = "weblogic"; private JMXConnector conn = null; private Object actualMBean = null; public ServiceDomainMBeanInvocationHandler(String hostName, int port, String userName, String password) { this.hostname = hostName; this.port = port; this.username = userName; this.password = password; } /** * Gets JMX connection */ public JMXConnector initConnection() throws IOException, MalformedURLException { JMXServiceURL serviceURL = new JMXServiceURL(protocol, hostname, port, jndiRoot + jndiURL); Hashtable<String, String> h = new Hashtable<String, String>(); if (username != null) h.put(Context.SECURITY_PRINCIPAL, username); if (password != null) h.put(Context.SECURITY_CREDENTIALS, password); h.put(JMXConnectorFactory.PROTOCOL_PROVIDER_PACKAGES, "weblogic.management.remote"); return JMXConnectorFactory.connect(serviceURL, h); } /** * Invokes specified method with specified params on specified * object. */ public Object invoke(Object proxy, Method method, Object[] args) throws Throwable { if (conn == null) conn = initConnection(); if (actualMBean == null) actualMBean = findServiceDomain(conn.getMBeanServerConnection(), A-14 Administering Oracle Service Bus API Usage Example mbeanName, type, null); return method.invoke(actualMBean, args); } /** * Finds the specified MBean object * * @param connection - A connection to the MBeanServer. * @param mbeanName - The name of the MBean instance. * @param mbeanType - The type of the MBean. * @param parent - The name of the parent Service. Can be NULL. * @return Object - The MBean or null if the MBean was not found. */ public Object findServiceDomain(MBeanServerConnection connection, String mbeanName, String mbeanType, String parent) { try { ObjectName on = new ObjectName(ServiceDomainMBean.OBJECT_NAME); return (ServiceDomainMBean) MBeanServerInvocationHandler.newProxyInstance(connection, on); } catch (MalformedObjectNameException e) { e.printStackTrace(); return null; } } } /** * Timer task to keep retrieving and resetting service statistics. */ static class GetAndResetStatisticsTask extends TimerTask { private ServiceStatisticsRetriever collector; public GetAndResetStatisticsTask(ServiceStatisticsRetriever col) { collector = col; } public void run() { System.out.println("\n**********************************"); System.out.println("Retrieving statistics for all monitored" + "business services."); try { collector.getAndResetStatsForAllMonitoredBizServices(); System.out.println("Successfully retrieved and reset statistics for " + "all monitored \n business services at " + new SimpleDateFormat("MM/dd/yyyy HH:mm:ss").format(new Date(System.currentTimeMillis()))); JMX Monitoring API A-15 API Usage Example } catch (Exception e) { System.out.println("Failed to retrieve and reset statistics for all monitored business services..."); e.printStackTrace(); } System.out.println("**********************************\n"); System.out.println("\n**********************************"); System.out.println("Retrieving statistics for all monitored proxy services."); try { collector.getAndResetStatsForAllMonitoredProxyServices(); System.out.println("Successfully retrieved and reset statistics " + "for all monitored \nproxy services at " + new SimpleDateFormat("MM/dd/yyyy HH:mm:ss").format(new Date(System.currentTimeMillis()))); } catch (Exception e) { System.out.println("Failed to retrieve and reset statistics " + "for all monitored proxy services..."); e.printStackTrace(); } System.out.println("*********************************\n"); } } /** * The main method to start the timer task to extract, save, and reset * statistics for all monitored business and proxy services. It uses * the following system properties. * 1. hostname - Hostname of admin server * 2. port - Listening port of admin server * 3. username - Login username * 4. password - Login password * 5. period - Frequency in hours. This will be used by the timer * to determine the time gap between two executions. * * @param args Not used. */ public static void main(String[] args) { try { Properties p = System.getProperties(); HashMap<String, String> map = new HashMap<String, String>(); map.put("HOSTNAME", p.getProperty("hostname", "localhost")); map.put("PORT", p.getProperty("port", "7001")); map.put("USERNAME", p.getProperty("username", "weblogic")); map.put("PASSWORD", p.getProperty("password", "weblogic")); //set a server name if you want to get the uri status statistics in a cluster A-16 Administering Oracle Service Bus API Usage Example map.put("SERVER_NAME", p.getProperty("server_name", "AdminServer")); String periodStr = p.getProperty("period", "1"); int periodInHour = Integer.parseInt(periodStr); long periodInMilliSec = periodInHour * 60 * 60 * 1000; ServiceStatisticsRetriever collector = new ServiceStatisticsRetriever(); collector.init(map); // Start timer. Timer timer = new Timer(); timer.scheduleAtFixedRate(new GetAndResetStatisticsTask(collector), 0, periodInMilliSec); } catch (Exception e) { e.printStackTrace(); } } } JMX Monitoring API A-17 API Usage Example A-18 Administering Oracle Service Bus B Using the Oracle Service Bus Deployment APIs You can use the Service Bus MBeans in Java programs and WLST scripts to automate promotion of Service Bus configurations from development environments through testing, staging, and finally to production environments. This appendix includes the following sections: • Deployment MBean Overview • Managing Sessions Using Programs and Scripts • Managing Configuration Tasks Using Programs and Scripts Tip: Service Bus APIs are documented in Java API Reference for Oracle Service Bus. B.1 Deployment MBean Overview The following MBeans provide deployment functions to help you manage sessions and configurations in you Service Bus systems. • SessionManagementMBean: Use this MBean to create, activate and discard a session, or to return the name of an existing session • ALSBConfigurationMBean: Use this MBean to import and export Service Bus configurations, update environment-specific information (endpoint URIs, and so on), query Service Bus configurations and resources. Numerous customization options can be applied during deployment. An extended list of environment variables allows you to preserve or tailor settings when moving from one environment to another. These are interfaces in the com.bea.wli.sb.management.configuration package. B.2 Managing Sessions Using Programs and Scripts Service Bus sessions allow different users to update discrete parts of configuration data without interfering with each other. A session is essentially a named sandbox, in which your changes are abstracted from other users, as well as from the core data (the data on which Service Bus runs), until the changes are activated. In order to modify resources and Service Bus configurations, you must create a session and perform changes in that session. The changes are only reflected in the core data when you activate the session. You can create multiple sessions as long as no two sessions have the same name. Using the Oracle Service Bus Deployment APIs B-1 Managing Configuration Tasks Using Programs and Scripts Each MBean type, except for SessionManagementMBean, has one instance per session. When a session is created, a new set of MBean instances (one for each MBean Type) is created automatically. One instance of each MBean Type operates on the core data that is saved to the Service Bus data cache. MBean instances created for a session are destroyed when the session is discarded or activated. MBean instances that operate on core data, however, are never destroyed. MBean instances that work on core data do not support update operations. B.2.1 Creating, Activating, Discarding, and Locating Sessions Service Bus sessions are created using the Oracle Service Bus Console. The methods in the SessionManagementMBean interface directly parallel the interactive features provided in the console, and require execution in the same order as their console counterparts. The following table lists the methods available in the SessionManagementMBean interface and the tasks they perform. Table B-1 Session Management Methods To... Create a new session with a user-specified name. Activate a session. Delete the session without activating changes. Check whether a session with a specific session name exists. This method return true if the session does exist. Use... createSession(String session) activateSession(String session, String description) discardSession(String session) sessionExists(String session) For reference material on the SessionManagementMBean interface and Java usage examples, as well as sample code describing how to use MBeans from a Java client and in a script, see the com.bea.wli.sb.management.configuration.SessionManagementMBean documentation in the Java API Reference for Oracle Service Bus. This documentation also includes example code illustrating how to create a session, how to obtain SessionManagementMBean for creating a session, and ALSBConfigurationMBean for operating on the session that is created and on core data, and so on. B.3 Managing Configuration Tasks Using Programs and Scripts The ALSBConfigurationMBean interface allows you to programmatically query, export and import resources, obtain validation errors, get and set environment values, and in general manage resource configuration in a Service Bus domain. Service Bus configurations are packaged as simple JARs containing Service Bus resources such as proxy services, WSDL files, and business services. These resources can span multiple projects, or contain only partial configuration information. For example, you can export only a subset of a project, a whole project, or subsets of resources from many projects. For reference material on the ALSBConfigurationMBean interface, see the com.bea.wli.sb.management.configuration.ALSBConfigurationMBean documentation in the Java API Reference for Oracle Service Bus. B-2 Administering Oracle Service Bus Managing Configuration Tasks Using Programs and Scripts B.3.1 Importing, Exporting, and Querying Configurations Service Bus configurations are created using the Oracle Service Bus Console, JDeveloper, or Fusion Middleware Control. They are stored through export in JAR files. After a configuration JAR file has been exported, you can promote the configuration by importing it into a different Service Bus domain and changing the environment-specific values in the configuration to match those of the new environment. The methods in the ALSBConfigurationMBean Interface allow you to manage resources in a Service Bus domain, including the following tasks: • Query, export, and import resources (includes importing resources from a ZIP file, and exporting resources at the project level) • Get and set environment values • Clone a project, folder, or resource with a new identity • Modify the existing references from all the resources in the given list to a new set of references • Customize multiple properties at once • Obtain validation errors For information about the methods provided in the ALSBConfigurationMBean interface, see Java API Reference for Oracle Service Bus. B.3.2 Updating Environment-Specific Information The methods in ALSBConfigurationMBean and in the Customization class allow you to update environment specific information. This includes the following tasks: • Update the value of endpoints in proxy and business service configurations • Update the directory elements in File, email, and FTP transport configurations • Set environment values directly • Search for environment-specific values specified in a query • Find environment values specified in a query, and replace all occurrences of the environment value pattern with the given parameter For information about the methods in ALSBConfigurationMBean and Customization, see Java API Reference for Oracle Service Bus. Import customizations are supported by the ALSBImportPlan class. This documentation also includes example code illustrating how to import and export Service Bus configurations, how to change environment values, how to query resources, and so on. You must update your security configuration and all other environment-specific settings interactively using Fusion Middleware Control. Using the Oracle Service Bus Deployment APIs B-3 
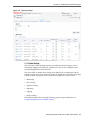
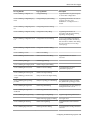
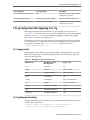
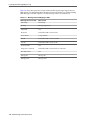
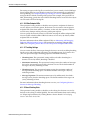
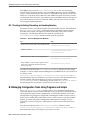
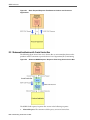
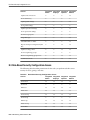
Managing Configuration Tasks Using Programs and Scripts B-4 Administering Oracle Service Bus C Auditing Your Oracle Service Bus System This appendix provides general guidelines on auditing your Oracle Service Bus environment. In addition to monitoring the services in your Oracle Service Bus system, you can audit your system to determine the history of configuration changes to the system, log the status of messages as they flow through the Oracle Service Bus pipeline at runtime, and log any security violations for messages in the pipeline. This appendix includes the following sections: • Auditing the Configuration Changes • Creating an Audit Trail for a Message Flow • Auditing Security Violations C.1 Auditing the Configuration Changes When you change a configuration in the Oracle Service Bus Console, a track record of the changes is generated and a record of all the configurational changes is maintained. Only the previous image of the object is maintained. You can view or access the history of configurational changes and the list of resources that have been changed during the session only through the Oracle Service Bus Console. However, to access all the information on configuration you have to activate the session. C.2 Creating an Audit Trail for a Message Flow Auditing the entire pipeline during runtime is time consuming. However, you can use the reporting action to perform selective auditing of the pipeline during runtime. You insert the reporting action at required points in the pipeline and extract the required information. The extracted information can be then stored in a database or sent to the reporting stream to write the auditing report. C.3 Auditing Security Violations When a message is sent to a proxy service and there is a breach in the transport level authentication or the security of the web services, Oracle WebLogic Server generates an audit trail. You must configure the Oracle WebLogic Server to generate this audit trail. Using this you can audit all security violations that occur in the pipeline. It also generates an audit trail whenever it authenticates a user. For more information about security auditing, see Configuring the Oracle WebLogic Security Framework–Main Steps in the Developing Services with Oracle Service Bus. Auditing Your Oracle Service Bus System C-1 Auditing Security Violations C-2 Administering Oracle Service Bus D Interoperability with WSRP This appendix describes how Oracle Service Bus provides Service Level Agreement (SLA) monitoring in applications that use Web Services for Remote Portlets (WSRP). WSRP is a mechanism used to generate markup fragments on a remote system for display in a local portal application. This appendix includes the following sections: • WSRP Producers and Consumers • WSRP Architecture • WSRP Design Concepts D.1 WSRP Producers and Consumers WSRP involves two integral components: producers and consumers. • A WSRP producer, referred to as producer in this document, is a remote application that implements standards-based web services using the SOAP specification over HTTP. You can create a producer using WebLogic Portal or third-party implementations of WSRP. • A WSRP consumer, referred to as a consumer in this document, is a portal application. Typically, the consumer application references the WSDL document of the producer when the portal is designed, and the consumer directly accesses the producer. D.2 WSRP Architecture This section describes the architecture of WSRP and shows how to enhance the architecture by adding Oracle Service Bus. The following figure shows the WSRP SOAP request and response flow between a producer application and a consumer application. Interoperability with WSRP D-1 WSRP Architecture Figure D-1 Basic Request/Response Flow Between Producer and Consumer Applications D.2.1 Enhanced Architecture with Oracle Service Bus The following figure shows how to use Service Bus as an intermediary between the producer and the consumer to provide Service Level Agreement (SLA) monitoring. Figure D-2 Enhanced WSRP Request / Response Flow Using Oracle Service Bus The WSRP SOAP request/response flow occurs in the following sequence: 1. Inbound Request: The consumer calls the proxy service in Service Bus. D-2 Administering Oracle Service Bus WSRP Design Concepts 2. Outbound Request: The proxy service routes the request, which is a message containing the SOAP body and transport headers, to the producer. 3. Outbound Response: The producer sends a response to Service Bus. 4. Inbound Response: The proxy service sends a response to the consumer. The response is a message that contains the SOAP body and transport headers. For information about the actual configuration of Service Bus components, see Configuring Oracle Service Bus for WSRP. D.3 WSRP Design Concepts Two primary components in WSRP design are the WSDL documents that describe the services and the messaging format. • WSRP WSDL Documents • WSRP Messages D.3.1 WSRP WSDL Documents The following table describes various kinds of services offered by WSDL documents. WSDL documents are referred to as Producers. Table D-1 Producer Services Service Description Service Description Required service. Describes the producer and the portlets that the producer makes available to consumers. Markup Required service. Manages user interaction with a remote portlet and returns the HTML markup used to render the portlet. Registration Optional service. Required for complex producers. Allows consumers to register themselves with the producer. Management Optional service. Provided by complex producers for managing portlet customization and portlet preferences. Markup Extension Provided by Oracle WebLogic Portal producers and replaces the Markup service. Markup Extension allows more efficient message handling by using multipart MIME messages for transmitting HTML markup content. Each producer implements a minimum of two services, such as Service Description and Markup. A simple producer offers just these two services. A complex producer, however, provides two additional services, such as Registration and Management. In addition, WebLogic Portal producers implement an extension service, such as Markup Extension that replaces the standard Markup service. These services are described using a standard WSDL format. The producer supplies a single URL for retrieving its WSDL document, which describes all the services that are provided by that producer. The end points for each service indicate whether the consumer should use transport-level security (HTTPs) or abstain from communication with the producer. Interoperability with WSRP D-3 Configuring Oracle Service Bus for WSRP D.3.2 WSRP Messages WSRP uses SOAP over HTTP for all messages exchanged between producers and consumers. In addition to using the standard message formats in the SOAP body, WSRP requires that consumers set at least a SOAPAction header, the cookie headers, and the usual HTTP headers, such as Content-Type. Producers return a session cookie, and any application-specific cookies, in the HTTP transport header of the response. The consumer must return the session cookie in subsequent request messages. D.4 Configuring Oracle Service Bus for WSRP You can configure Service Bus components in either Oracle JDeveloper or the Oracle Service Bus Console. Configuring Service Bus for WSRP involves the following tasks: • Implement a service that consumers can invoke to obtain an appropriate WSDL document for a particular producer. • Implement the details of conveying a consumer's request to the producer and returning the response to the consumer. The following sections describe how to configure Service Bus components to send requests for WSRP services through proxy services. They also describe the services that a producer provides, along with other attributes of WSRP that must be used to configure Service Bus components. Finally, they include information about monitoring producers with increasing degrees of detail, as well as load balancing and failover with WSRP. For more information about creating WSRP-enabled portals using Oracle WebLogic Portal, see the Oracle Fusion Middleware Federated Portals Guide for Oracle WebLogic Portal. D.4.1 Getting the Producer WSDL Document As a common practice, consumers directly contact a producer to obtain its WSDL document. However, if Service Bus is used as a proxy service, then all access to the producer occurs via Service Bus. Therefore, a proxy service is implemented for consumers. The proxy service calls the producer's real URL to obtain the producer WSDL file. The proxy service transforms the results as follows: • Rewrites the endpoint address for the producer to refer to the Service Bus IP address and port number. • Changes the endpoint URI to refer to the proxy service that reflects the required monitoring granularity as described in Monitoring WSRP Applications. • Changes the endpoint protocol and port number if transport security is used between the consumer and the proxy service. D.4.2 Using SSL with WSRP Producers When a producer is created, it can be configured to require SSL ("secure=true"). In addition, the Service Bus administrator can change the security requirement to the consumer in the Service Bus configuration. For example, if a producer does not require SSL, you can require consumers to use SSL by performing the following steps: • Change the WSDL file to specify HTTP(s). D-4 Administering Oracle Service Bus Configuring Oracle Service Bus for WSRP • Configure the WSRP proxy services to use HTTP(s). When configured in this way, Service Bus automatically bridges the secure messages from the consumer to the non-secure messages used by the producer. D.4.3 Routing Messages Between Consumer and Producer After retrieving a copy of the WSDL file, the consumer uses the WSDL definitions to formulate service requests and sends them to the producer using Service Bus. The WSRP request/response process involves the following steps: 1. The consumer sends a message to the Service Bus proxy service corresponding to the producer service. 2. The proxy service sends the message to a pipeline, which executes a simple message flow that routes the message (unchanged) to the actual producer service. 3. The producer formulates and sends a response to the consumer through Service Bus. 4. The consumer receives the response (unchanged) from the producer. WSRP web services expose portlets, and those can rely on HTTP cookies and sessions. You must configure Service Bus to propagate HTTP transport headers, such as SOAPAction and cookies. However, by default, Service Bus does not pass transport headers from the proxy service to the business service because the proxy service may not use the same transport as the business service. Therefore, you must configure the pipeline to copy the request headers from the inbound request to the outbound request. Similarly, you must copy the response headers from the business service back to the proxy service's response to the consumer. Although you can copy all transport headers between the proxy service and the business service, being more selective can avoid errors. You must copy the SetCookie and Cookie headers. The final message must own some headers, such as Content-Length because Service Bus assembles the final message to send. For example, if the message flow copies the Content-Length header from the proxy service to the business service, it can result in an error because the length of the message can change during processing. Therefore, Service Bus must own this header. D.4.4 Monitoring WSRP Applications Monitoring a WSRP application tracks the usage of a producer's individual services and operations. The message flow for WSRP services introduces very little overhead, and the mapping between proxy services and producers, and between business services and producers, is simple to configure. Therefore, to satisfy SLA requirements, it is sufficient to monitor only the proxy services. D.4.5 Load Balancing and Failover Service Bus allows business services to define multiple endpoints that provide the same web service. When multiple endpoints are defined, Service Bus can automatically distribute load balance requests across endpoints, and it can automatically failover requests when an endpoint is inaccessible. D.4.5.1 WSRP Limitations Without Session Stickiness Portlets are a means of exposing a user interface to an application, so they typically have session data associated with them. To preserve session data, requests to the Interoperability with WSRP D-5 Configuring Oracle Service Bus for WSRP portlet must be directed to the same server or cluster that serviced the original request. This requirement makes load balancing through Service Bus inappropriate unless the business process is configured for HTTP session stickiness. Multiple endpoints in a business service usually target different servers or clusters. Without session stickiness configured there is no way to preserve the session because there is no communication among servers that are in separate clusters. Therefore, if multiple endpoints are defined for a WSRP business service and session stickiness is not enabled, you must set the load-balancing algorithm to "none". You can use multiple endpoints to provide redundancy in certain circumstances in the event that one of the endpoints is not available. The WSRP service is still available on a secondary endpoint. However, any session data that existed at the time the first endpoint failed will not be available on other endpoints. This failover configuration is an option only for simple producers, not for complex producers (see WSRP WSDL Documents). Complex producers require that their consumers register with the producer before sending service requests. The producer returns a registration handle that the consumer must include with each request to that producer. If a business service defines multiple endpoints, each endpoint provides and requires its own registration handle. However, Service Bus is stateless across requests, it does not maintain a mapping of the correct handle to send to a particular endpoint. In fact, it sends the registration request to a single endpoint, so the consumer is registered with only one producer. If that producer is not available, then Service Bus routes a service request to another endpoint defined for that business service. Since the consumer is not registered with that new producer, the request fails with an "InvalidRegistration" fault. The management of registration handles requires an application outside of Service Bus to maintain this state data, so the registration requirement avoids defining multiple endpoints for complex producers. Simple producers do not support the registration service, so a failover configuration that defines multiple endpoints in the business service is possible although session data is lost on failover. D.4.5.2 Using WSRP with HTTP Session Stickiness For load balancing with HTTP business services that have multiple endpoints, you can configure the service to use session stickiness, also known as session affinity. When using sticky sessions, all messages are processed by the server that processed the initial request in the session. Session stickiness can be configured at runtime without needing to restart the server. When an initial request is sent for a session, it is sent to the first URI endpoint based on the load-balancing algorithm. The session ID is associated with the URI endpoint that serves this initial request, and the session is mapped to that URI index in a URI table. Subsequent requests in the same session go to that URI endpoint instead of the URI endpoint that would have been chosen based on a load-balancing algorithm. Session stickiness behaves as follows, depending on the business service configuration: • Messages are retried on the same URI endpoint based on the retry configuration of the business process. If the retry count is exhausted, the URI endpoint is marked as offline and Service Bus throws an exception. • If a business service URI endpoint is dynamically configured from a message flow, the sessions will not be sticky even if session stickiness is enabled. • If the URI endpoint is offline, session stickiness is no longer maintained. D-6 Administering Oracle Service Bus Configuring Oracle Service Bus for WSRP • If the service URI table is modified mid-session and the index is out of the bounds of the URI table, a TransportException is thrown with an error code of TransportManager.TRANSPORT_STATUS_APPLICATION_ERROR. When configuring business processes for session stickiness, be sure to transfer the cookie headers from inbound to outbound for requests and from outbound to inbound for responses. Interoperability with WSRP D-7 Configuring Oracle Service Bus for WSRP D-8 Administering Oracle Service Bus E Role-Based Access in Oracle Service Bus This appendix lists the actions that each Service Bus security role can perform in the Oracle Service Bus Console and Fusion Middleware Control. Only the Oracle WebLogic Server Administrator role has security configuration privileges. This appendix includes the following topics: • Application Security Roles • Enterprise Security Roles • Role-Based Security Configuration Access This appendix only lists the permissions granted by each role defined in WebLogic Server or Fusion Middleware Control. For information about configuring security and using roles in Service Bus, see Defining Access Security for Oracle Service Bus. E.1 Application Security Roles Application security roles provide access to Fusion Middleware Control and Oracle Service Bus Console features as long as the users are also members of the Oracle WebLogic Server Monitors group. You can assign application roles to users from the Service Bus Security page in Fusion Middleware Control. E.1.1 Application Role-Based Access in Oracle Service Bus Console The following topics describe the permissions granted by the application roles in the Oracle Service Bus Console. • Application Role-Based Access to Resource Actions • Application Role-Based Access to Administration Functions • Application Role-Based Access to Session Management E.1.1.1 Application Role-Based Access to Resource Actions The following table describes the permissions granted by application roles for working with Service Bus resources in the Oracle Service Bus Console. In the table below, resources refers to all Service Bus resources (such as proxy services, XML schemas, JNDI providers, and so on), but excludes alert destinations. Table E-1 Application Role-Based Access to Resources Actions Middleware Develop Administrat er or Compos er Deploye Tester r Middlewar Applicatio Monito e n r Operator Operator Create resources Y N N N Y N N N Role-Based Access in Oracle Service Bus E-1 Application Security Roles Actions Middleware Develop Administrat er or Compos er Deploye Tester r Middlewar Applicatio Monito e n r Operator Operator View resources Y Y Y Y Y Y Y Y Edit resources Y Y N N N N N N Delete resources Y Y N Y N N N N Move resources (except system resources) Y Y N N N N N N Rename resources Y Y N N N N N N Clone resources (except UDDI registries) Y Y N N N N N N Create alert destination Y Y N N N Y N N View alert destination Y Y Y Y Y Y Y Y Edit alert destination Y Y N N N Y N N Delete alert destination Y Y N Y N Y N N Move alert destination Y Y N N N Y N N Rename alert destination Y Y N N N Y N N Clone alert destination Y Y N N N Y N N Create alert rule Y Y N N N Y N N View SLA alert rule Y Y Y Y Y Y Y Y Edit SLA alert rule Y Y N N N Y N N Delete SLA alert rule Y Y N N N Y N N Create projects and folders Y Y N N N N N N View projects and folders Y Y Y Y Y Y Y Y Edit projects and folders Y Y N N N N N N Delete projects and folders Y Y N Y N N N N Run Test Console Y Y N N Y N N N E-2 Administering Oracle Service Bus Application Security Roles E.1.1.2 Application Role-Based Access to Administration Functions The following table describes the permissions granted by application roles for administrative functions in the Oracle Service Bus Console. Table E-2 Application Role-Based Access to Administration Functions Actions Middleware Develop Administrat er or Compos er Deploye Tester r Middlewar Applicatio Monito e n r Operator Operator Import resources from configuration or ZIP file Y Y N N N N N N Export resources from configuration or ZIP Y Y N N N N N N Import resources from URL Y Y N N N N N N Export resources from URL Y Y N N N N N N Import from UDDI Y Y N N N N N N Synchronize AutoImport Status Y Y N N N N N N Unlink UDDI Y Y N N N N N N Publish to UDDI Y Y N N N N N N Auto-Publish Status Y Y N N N N N N Publish Auto-Publish Status Y Y N N N N N N Find and replace Y Y N N N N N N Create configuration file Y Y N N N N N N Execute configuration file Y Y N N N N N N E.1.1.3 Application Role-Based Access to Session Management The following table describes the session activity permissions granted by application roles in the Oracle Service Bus Console. Table E-3 Application Role-Based Access to Session Management Actions Middleware Develop Administrat er or Compos er Deploye Tester r Middlewar Applicatio Monito e n r Operator Operator Edit session Y N Y Y Y N N N Role-Based Access in Oracle Service Bus E-3 Application Security Roles Actions Middleware Develop Administrat er or Compos er Deploye Tester r Middlewar Applicatio Monito e n r Operator Operator View all sessions Y Y N Y N Y N N View change history Y Y N Y N Y N N Activate changes Y Y N Y N Y N N Discard changes Y Y N Y N Y N N Exit session Y Y N Y N Y N N E.1.2 Application Role-Based Access in Fusion Middleware Control The following table describes the permissions granted by the application roles to the Service Bus monitoring and management functions in Fusion Middleware Control. Table E-4 Application Role-Based Access in Fusion Middleware Control Actions Middleware Develop Administrat er or Compos er Deploye Tester r Middlewar Applicatio Monito e n r Operator Operator View statistics Y Y Y Y Y Y Y Y Reset statistics Y Y Y Y N Y N N View alerts Y Y Y Y Y Y Y Y Delete alerts Y Y Y Y N Y N N Update alert annotations Y Y Y Y N Y N N View Alert History Y Y Y Y Y Y Y Y Update global settings Y Y Y Y N Y N N View global settings Y Y Y Y Y Y Y Y Update operational settings Y Y Y Y N Y N N View operational settings Y Y Y Y Y Y Y Y View message reports Y Y Y Y Y Y Y Y Purge Messages Y Y Y Y N Y N N Take URI online or offline Y Y Y Y N Y N N Import and export configuration JAR files Y Y N Y N N N N E-4 Administering Oracle Service Bus Enterprise Security Roles Actions Middleware Develop Administrat er or Compos er Deploye Tester r Middlewar Applicatio Monito e n r Operator Operator Update security policies1 Y Y Y N N N N N View resequencing groups Y Y Y Y Y Y Y Y Resolve resequencing group errors Y Y Y N N N Y N Launch test console Y Y Y Y Y N N N 1 These roles must be members of the WebLogic Server Administrators group in order to update security policies. E.2 Enterprise Security Roles Enterprise security roles provide access to Fusion Middleware Control and Oracle Service Bus Console features as long as the users are also members of the Oracle WebLogic Server Monitors group. E.2.1 Enterprise Role-Based Access in Oracle Service Bus Console The following topics describe the permissions granted by the enterprise roles in the Oracle Service Bus Console. • Enterprise Role-Based Access to Resource Actions • Enterprise Role-Based Access to Administration Functions • Enterprise Role-Based Access to Session Management E.2.1.1 Enterprise Role-Based Access to Resource Actions The following table describes the permissions granted by enterprise roles for working with Service Bus resources in the Oracle Service Bus Console. In the table below, resources refers to all Service Bus resources (such as proxy services, XML schemas, JNDI providers, and so on), but excludes alert destinations. Table E-5 Enterprise Role-Based Access to Resource Actions Actions Integration Integration Integration Integration Admin Deployer Operator Monitor Create resources Y Y N N View resources Y Y Y Y Edit resources Y Y N N Delete resources Y Y N N Move resources (except system resources) Y Y N N Rename resources Y Y N N Role-Based Access in Oracle Service Bus E-5 Enterprise Security Roles Actions Integration Integration Integration Integration Admin Deployer Operator Monitor Clone resources (except UDDI registries) Y Y N N Create alert destination Y Y Y N View alert destination Y Y Y Y Edit alert destination Y Y Y N Delete alert destination Y Y Y N Move alert destination Y Y Y N Rename alert destination Y Y Y N Clone alert destination Y Y Y N Create alert rule Y Y Y N View SLA alert rule Y Y Y Y Edit SLA alert rule Y Y Y N Delete SLA alert rule Y Y Y N Create projects and folders Y Y N N View projects and folders Y Y Y Y Edit projects and folders Y Y N N Delete projects and folders Y Y N N Run Test Console Y Y N N E.2.1.2 Enterprise Role-Based Access to Administration Functions The following table describes the permissions granted by enterprise roles for administrative functions in the Oracle Service Bus Console. Table E-6 Enterprise Role-Based Access to Administration Functions Actions Integration Integration Integration Integration Admin Deployer Operator Monitor Import resources from configuration or ZIP file Y Y N N Export resources from configuration or ZIP Y Y N N Import resources from URL Y Y N N Export resources from URL Y Y N N Import from UDDI Y Y N N E-6 Administering Oracle Service Bus Enterprise Security Roles Actions Integration Integration Integration Integration Admin Deployer Operator Monitor Synchronize Auto-Import Status Y Y Y Y Unlink UDDI Y Y N N Publish to UDDI Y Y N N Auto-Publish Status Y Y Y Y Publish Auto-Publish Status Y Y N N Find and replace Y Y N N Create configuration file Y Y N N Execute configuration file Y Y N N E.2.1.3 Enterprise Role-Based Access to Session Management The following table describes the session activity permission granted by enterprise roles in the Oracle Service Bus Console. Table E-7 Enterprise Role-Based Access to Session Management Actions Integration Integration Integration Integration Admin Deployer Operator Monitor Edit session Y Y Y N View all sessions Y Y N N View change history Y Y Y N Activate changes Y Y Y N Discard changes Y Y Y N Exit session Y Y Y N E.2.2 Enterprise Role-Based Access in Fusion Middleware Control The following table describes the permissions granted by the enterprise roles to the Service Bus monitoring and management functions in Fusion Middleware Control. Table E-8 Enterprise Role-Based Monitoring and Management Access Actions Integration Integration Integration Integration Admin Deployer Operator Monitor View statistics Y Y Y Y Reset statistics Y Y Y N View alerts Y Y Y Y Delete alerts Y Y Y N Role-Based Access in Oracle Service Bus E-7 Role-Based Security Configuration Access Actions Integration Integration Integration Integration Admin Deployer Operator Monitor Update alert annotations Y Y Y N View alert history Y Y Y Y Update global settings Y Y Y N View global settings Y Y Y Y Update operational settings Y Y Y N View operational settings Y Y Y Y View message reports Y Y Y Y Purge Messages Y Y Y N Take URI online or offline Y Y Y N Import and export configuration JAR files Y Y N N Update security policies Y Y N N View resequencing groups Y Y Y Y Resolve resequencing group errors Y Y N N Launch test console Y Y N N E.3 Role-Based Security Configuration Access The following table describes permissions for the tasks you perform to define access security for users, groups, and roles. Table E-9 Role-Based Security Configuration Access Actions Integration Integration Integration Integration Admin Deployer Operator Monitor Create User N N N N View User Y Y Y Y Edit User N N N N Delete User N N N N Create Group N N N N View Group Y Y Y Y Edit Group N N N N Delete Group N N N N Create Role N N N N E-8 Administering Oracle Service Bus Role-Based Security Configuration Access Actions Integration Integration Integration Integration Admin Deployer Operator Monitor View Role Y Y Y Y Edit Role N N N N Delete Role N N N N Create Policy N N N N View Policy Y Y Y Y Edit Policy N N N N Delete Policy N N N N Role-Based Access in Oracle Service Bus E-9 Role-Based Security Configuration Access E-10 Administering Oracle Service Bus