1
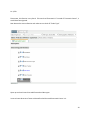
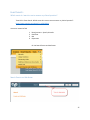
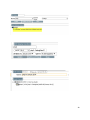
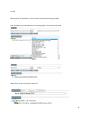
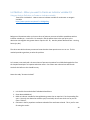
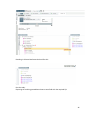
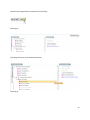
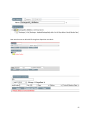
Special Topics
Version 11
Eran Bellin, M.D.
8/13/2015
1
Contents
Guidance ....................................................................................................................................................... 4
Review with Students: .................................................................................................................................. 4
Event Collection ............................................................................................................................................ 5
How to convert a cohort to an Event Collection......................................................................................... 14
(Useful Trick - with a warning) ............................................................................................................... 14
Time in Range - The third Analytic Pattern in Study Designer ................................................................... 19
How to summarize values in a continuous variable drawn repeatedly in the course of clinical care ... 19
Self Teaching Exercise: Learn how to create medication sets and use them to solve a question............. 21
Additional Topics of Interest ....................................................................................................................... 24
Find All the hospitalizations, ED visits, and Outpatient Visits in a temporal window post index............... 24
Use smart Report Diagnosis Summary: .................................................................................................. 24
Smart Report with Charlson ........................................................................................................................ 28
Comorbidity 2 (Charlson extension) .......................................................................................................... 29
Adjust for Severity using administrative data collected over a prolonged time. ................................... 29
Text search .................................................................................................................................................. 32
use video and reference manual: ........................................................................................................... 32
Event Search: .............................................................................................................................................. 37
Which event do I want to use to answer my clinical question? ............................................................. 37
Search Events and Attributes .................................................................................................................. 37
Exercise: .................................................................................................................................................. 42
Upload cohort ............................................................................................................................................. 43
List Method – When you want to Create an Indicator variable 0/1 ........................................................... 44
Using an Analysis Definition to Create an Indicator variable.................................................................. 44
Indicator Variable for a Categoric Variable Value set ............................................................................. 48
Tutorial 35: Counting Previous Hospitalizations in Wide List View ........................................................... 56
How to turn a multiplicity into a singularity using only the count attribute and no other fields from an
Analysis Definition using All. ................................................................................................................... 56
Use of Box for Security................................................................................................................................ 62
Take the Competency Exam........................................................................................................................ 63
Steps to Obtain NDI Mortality Data for CLG Users ..................................................................................... 64
Methods Section for Use in Citing Clinical Looking Glass Work ................................................................. 65
“Quick Tricks” in Excel for CLG Users .......................................................................................................... 66
2
Common CLG Error Message and First Pass Solution ................................................................................. 68
3
Guidance
After today’s class you will have completed the curriculum for basic competency, will be able to pass the
basic competency exam, and will be ready to undertake your own education.
CLG Information is both broad and deep. The manuals cover most of its capability but can be daunting
without a guide.
I have collected in this section “Special Topics”, those topics most commonly used by new users so you
will have available to you, once you have mastered them some of the techniques your colleagues have
found useful in their analytic efforts at Montefiore. Consider this your next challenge for self-study.
Review with Students:
1. Rules for test taking. You can help your fellow students by pointing out mistakes and giving
hints but do not give answers. CLG is a collaborative tool for a collaborating community.
2. Time notions - When in calendaric, Within index date, When in event duration.
3. Index Event Line pointing to line one or line two important to determining which event’s
attribute will be available through the browse method or group list method. This highlights the
importance of editing the index event line.
4. Important notion of Event Collection and how it differs from cohort (next section).
4
Event Collection
Tutorial 26: Event Collection vs Cohort Admissions (all)
https://www.youtube.com/watch?v=3Ss0lwu7G8M
So far we have learned to create cohorts. We have a group of medical record numbers where each
medical record number is represented only once. We got these medical record numbers by finding an
event (one per person) and we used that singleton event’s date time and the patient’s mrn to define the
member of the cohort.
But suppose, instead of wanting a group of unique medical record numbers, we wanted a group of
events. As an example, suppose we wanted to look at all the hospital admissions in 2010 that had
another hospital admission within a year. If we record the mrn of each of these hospital admission, we
may find that some people are represented more than once. i.e. the patient was admitted, then
readmitted, and then readmitted again all within the span of one year. The second admission would
qualify the first for inclusion and the third admission would qualify the second for inclusion.
A collection of medical record numbers where the medical record numbers are not unique is called an
“event collection”.
You build an “event collection” when you are interested in events not in unique individuals, but you still
need the mrn to force the events to have a natural relationship to other events, i.e. only events
belonging to the same person can be used to qualify events for inclusion in the event collection.
First let us build all hospital discharges for males older than age 65.
This is relatively simple. You have in the past learned how to build the first (earliest ) discharge, the only
difference now is that instead of building a cohort, your are building an event collection. Instead of
choosing earliest in the index event line, you choose all.
Let’s go through the steps.
1. First, create an event collection:
5
An event collection opens up on the event canvas:
1 – on the management pane you see an “event collection” appear in yellow. Note the “EC” as
opposed to the “C” of the cohort
2- a place appears that allows you to enter the name of the event collection
3- the skeleton of the Event collection appears in the event canvas. Note the word “all” in the
index event line. This is the feature that distinguishes the event collection from cohort.
4- The GUI Editor, “Edit selected condition, appears below the event canvas to allow you to
enter the criteria that will be painted on the event canvas. This is exactly the same gui editor as
you saw in the cohort building process with the same capabilities except in the Event Collection,
the index event line is allowed “all” in addition to “earliest” and “latest: while in the cohort build
the Index Event line is only allowed earliest or latest. In the cohort build, the Index Event line
6
forces a singularity of result per mrn by allowing only earliest or latest. While the condition lines
on the canvas can be “all, earliest, or latest”, it is the Index Event line that has the restriction. It
is the index event line that enforces the singularity – the uniqueness of mrn in the resulting
group.
To restate and amplify:
•
•
•
•
Both cohorts and Event Collections are groups of mrn-date:time combinations.
Both cohorts and event collections are qualified by events related to each other through
temporal rules and logical “and”, “or”, and “subgroups”.
A group called a cohort has an mrn only once.
A group called an event collection can have the same mrn multiple times. What is
unique in the event collection is not the mrn but rather the mrn-date:time combination.
The dyad of MRN and date:time is unique in the event collection.
Now let,
Let’s continue our build:
2. Name the event collection – Dc2010AgeGe65
3. Build the event collection:
a. Event: discharges
i. Discharged alive meaning disposition not equal to expired
b. Duration 1/1/10 – 1/1/11 not included on right
c. Age >= 65
The gui editor now looks like this:
When you update and close the event canvas looks like this:
7
a. Retain the index event line as “all” (this is what makes this group an event collection.
We will now get all the hospital admissions in the year 2010 of people aged 65 or
greater.
N = 28,959 admissions discharged alive.
Now we want to know, how many of these admissions in 2010 actually had a readmission 30 days after
the first.
You know how to do this. You use a within condition demanding that there is another admission within
0 to 30 days of the discharge.
The steps follow:
1. Hover over the index event line
2. Right click to get the menu
3. Left click on add condition/within
4. This now results in the following on the event canvas and gui editor below
8
5. Put in the requirements
a. Name the condition line: First Admit post dischargeNew Event
Definiiton: Inpatient admit
b. Change the all in the gui to “earliest” as I want the first
readmission not all the downstream readmissions.
c. Within 0 to 30 days
The gui editor now looks like this:
9
Now, Update and Close and the conditions in the GUI editor are painted onto the Event Canvas.
10
N= 12,420
But what is this 12, 420? When you had a cohort, it was really simple. The 12,420 would have been
unique people and those people identified by the condition line, to which the index event line pointed.
In the event collection, we have an index line that points to “All of Any”.
This means that it is counting the mrn-date:time of condition line one (discharges) and condition line 2
(First admit post discharge).
If you wanted only the hospitalizations that had a subsequent readmission in 30 days, then you should
have had your index event line pointing to the first line discharges. These are the discharges that had a
readmit in 30 days.
To achieve this, hover over the Index event line, and right click.
A menu appears, choose edit (left click edit)
A gui editor for the index event line appears below the event canvas
Now modify the all of any to be all of “discharges”
11
Update and close
The event canvas would have looked like this:
Now build
N= 6,200
There were 6,200 admissions of 65 year olds or older who had a subsequent admission within 30 days of
the discharge.
The result is N=…..
This is the number of discharges in 2010 that have a repeat admission within 30 days. When you browse
this event collection, you will see the details of those discharges.
12
If, instead, you want to browse the information on those hospitalizations that occurred within 30 days
of the previous discharge, then you have to edit the Index event line and point to the “First admit post
discharge line”, rebuild the event collection, and then browse the rebuilt event collection.
Resulting in at build: N= 6,200 the same number as before, but now we are pointing to the “First admit
post discharge” and when you browse this group, you will get information on the readmission not the
original admission.
Event collections answer different questions from the cohorts. You must be careful to understand what
your index event line is pointing to and what it is actually counting.
13
How to convert a cohort to an Event Collection
(Useful Trick - with a warning)
Suppose you start with a familiar cohort.
This is a cohort so we have the first admission per patient with each patient only admitted once.
Suppose we wanted to look at all the Male pneumonia patients in 2010 where the patient was
discharged alive. How can we convert this cohort (Earliest of Any) into an All.
Of course, we could always build the event collection from scratch. But, you can not change the index
line from earliest to all. So I will now show you how to change the cohort object into an event collection
object.
Go to the management pane, hover over the cohort, and right click to obtain the menu, and left click on
Copy to Event Collection.
14
Left click on Copy to Event Collection.
The event collection appears in the management pane with the prefix EC.
Note, all that has happened is that the event collection rules have been built. The actual event
collection itself made up of medical records numbers has not yet been built as you can see the mrn
number is zero.
15
16
Notice how the Event Collection object is yellow in the management pane:
Let’s edit the Event Collection and see what it looks like.
Warning!!! Make sure the first condition line says “All”. The “Copy to Event Collection” command only
alters the “Index Event Line”. If the first condition line says “Earliest” or “Latest” you will have to
manually alter it.
Notice how the index event line now says all.
Left click on build:
The EC is now green:
17
The original cohort had 762 people. So this means in 2010 there were 762 unique males who were
admitted with pneumonia and discharged alive. There were 812 admissions of these males with a
diagnosis of pneumonia and discharged alive. So in the same year some of these men came back to the
hospital with a pneumonia diagnosis and were discharged from their subsequent admissions alive.
Warning!!!
Whenever you convert a cohort to an Event collection, look closely at the Index Event Line and make
sure it is pointing to the line you actually want and therefore answering the question of your interest.
Also make sure your condition lines are properly identifying Earliest, Latest, or All.
18
Time in Range - The third Analytic Pattern in Study Designer
How to summarize values in a continuous variable drawn repeatedly in the course of
clinical care
Tutorial 27: Summarizing a Continuous variable sampled repeatedly in the course of clinical
care: The time in Range Method
https://www.youtube.com/watch?v=flZckS9Jm4A
Watch Streaming video:
19
1. Watch the three videos: time in Range Lecture, Time in Range (Intro), Time in Range (Advanced)
2. Read the CLG User manual 573-633
20
Self Teaching Exercise: Learn how to create medication sets and use
them to solve a question.
Tutorial 28: Medication Set building Find/Explore
2. Watch Streaming video
Help\Streaming Videos\CLG Modules\ Hierachical Set Medication
Watch Video Hierarchical Set medications so you can build a set with medications.
Then find the number of children age LT 18 in year 2012 at Montefiore who are prescribed in the
outpatient an aerosol steroid in 2012. Build the cohort See 1,2 below for helpful clues.
21
Hints; demographic is age less than 18; event type is Prescription
Note:
prescriptions are medications in the outpatient;
med orders are medications that have been ordered in the hospital,
InternMedAdmin Date are the actual meds that were administered in hospital)
All three events can use the same medication sets.
Read in Event Definition manual (volume 3) Chapter 8 P. 89 -97. Medication/Prescription
In the process of the build you will be building on the “event definition canvas”
22
Your final cohort will have n=280. Make sure you have the same results.
3. Review CLG User Guide Version 4.31 Manual
a. Look through Table of Contents
b. P. 17-25 Introduction and Core Concepts
c. In the reading below notice the style of question and answer
d. Pp. 25-167
23
Additional Topics of Interest
Find All the hospitalizations, ED visits, and Outpatient Visits in a
temporal window post index
Tutorial 29:Find multiple diagnoses not just primary
Use smart Report Diagnosis Summary:
See video and manual:
24
25
26
27
Smart Report with Charlson
Tutorial 30: Charlson Comborbidity 2
The Charlson comorbidity report looks at a single hospitalization and produces from its administrative
data (diagnoses) a Charlson comorbidity score (called “combined” which includes age) and prediction of
10 year mortality.
Video:
Read in User Manual Ad hoc Reports:
Chapter 11: Comorbidity “Sickliness Adjustment” Pp.123 -145
28
Comorbidity 2 (Charlson extension)
Adjust for Severity using administrative data collected over a prolonged time.
See video
Create a Charlson Score looking back 180 days prior to the index.
Use the pneumonia cohort and go back 180 days to capture the preceding diagnoses from the index
date going back. Use Hospital, ED, and outpatient visits as source of diagnoses.
29
and now look at spreadsheet:
30
The relevant “Charlson Adjuster” is the Combined Score which takes age and diagnoses into
consideration. You can use this score to compare two cohorts for comparability at baseline.
31
Text search
use video and reference manual:
Tutorial 31: Text Search
https://www.youtube.com/watch?v=zUyTE7de81w
Must learn on own with video and with manual.
1- Orders with text
2- Lab with text
Manual:
32
Use CLG User Guide 4.3.1
Text search include Chapter 11: Searching Text Based information p.317-368
Look for the phrase “pancreatic cancer” in 2014. What are the “types” in orders with text that have
“Pancreatic cancer” in them?
Steps:
Use
1. event collection approach;
2. event type = “orders with text” ; condition is
a. order Note Contains “Pancreatic Cancer”
33
N= 4,513.
Please note, this function is very literal. If the text had “Pancreatic Ca” instead of “Pancreatic Cancer”, it
would have been ignored.
Now browse the event collection and make sure to check off “Order Type”
Open up excel and insert Pivot table focused on Oder types.
I want to know what sort of texts at Montefiore had the word Pancreatic Cancer in it.
34
There are about 96 different order types that have within them the full phrase “pancreatic cancer”. I
sort ordered them and provide them as output:
35
Count of Order types with the phrase Pancreatic Cancer in them.
The spreadsheet has a column with the full text.
36
Event Search:
Which event do I want to use to answer my clinical question?
Tutorial 31: Event Search: Which event do I want to use to answer my clinical question?
https://www.youtube.com/watch?v=msTS6YPEVrI
Use event manual to find
1.
2.
3.
4.
blood pressure. Systolic, diastolic.
Peak flow
Bmi
Depression
Or Use Search Events and Attributes:
Search Events and Attributes
37
Now left click on Go
Notice how anything with depression in it, the values in a categoric field, the values in a finding type,
the title of an event will be returned to you.
Left click on downward arrows to minimize those results you do not want to see.
38
Notice in the program in the drop down for event type something called: PHq9-score cemr
You got a hint that such a thing existed from the search function.
39
40
N= 695
695 measures of depression in the month of January 2014 using the phq9
Now consider how many episodes of screening phq2 in the same time period
With a final result on the event canvas of:
41
N=17,532. So there were 17,352 times that a screening phq2 was used in the month of January.
Notice how idiosyncratic phq2 and phq9 is. Notice how differently they are named in the system. One
begins “phq-9….” and the other begins as “Depression Screening PHQ2”.
Exercise:
1. Look for Apache Scores. Where will you find them?
2. Look for blood pressure.
42
Upload cohort
Tutorial 33: Upload Cohort
https://www.youtube.com/watch?v=ubnZoAgx6A8
When you have a list of medical record numbers and index dates and want to enroll this list as a cohort
or event collection in CLG, you will use this feature.
See video:
43
List Method – When you want to Create an Indicator variable 0/1
Using an Analysis Definition to Create an Indicator variable
Tutorial 34: List Method - How to create an indicator variable for continuous or categoric
Variables
https://www.youtube.com/watch?v=i3hEdgb05ag
Background: Sometimes when you have a cohort of patients you want to build a spreadsheet with an
indicator variable yes = 1 and no=0. For example: Did the patient have in the year prior to the
admission a Hemoglobin A1c greater than or equal to 6.5. Or, was the patient admitted from a nursing
home (yes, No).
The cohort was built and now you want to know whether these questions are true or not. The list
method provides a good way to solve this problem.
Let’s create a new study with the two cohorts of pneumonia patients from 2010 discharged alive from
the hospital based upon an inpatient admission event. One cohort was male and one was female.
You built this before so this should be easy.
Name the study “Pneumonia detail”
1. Let’s build a list method called “IsDiabeticInPast5Years.
2. Goto advanced Method
3. Build an indicator variable for HemoglobinA1c greater than or equal to 6.5 in the preceding five
years. You only care about the existence yes/no and really do not care which one so you can
chose “Earliest”.
4. Eliminate in the list populator attributes selected all the attributes selected. This is just for ease
of seeing the results.
44
5. Click on three dotted button to open an Analysis Definition builder canvas
Using this AD will find the earliest value, but more importantly the count variable (to be shown
in the list populator) when applied to an AD with a singularity (Earliest or Latest) will produce a
zero when no record was found and a one when at least one value was found in the column for
the count variable in the list method spreadsheet.
The image below shows us invoking the AD called “IsDiabeticInPast5Years” and then dragging
the count variable in the list populator from available attributes to selected attributes.
45
Resulting in Selected Attributes that look like this:
Run the study.
Exporting the resulting spreadsheet shows a count field with the required 0/1
46
I have therefore demonstrated how to use a numeric based AD to generate a 0/1 dummy.
47
Indicator Variable for a Categoric Variable Value set
We also want an indicator variable for the categoric variable SNF (Skilled Nursing Facility). We
want to know if the patient was admitted from a nursing facility.
For this AD, we build the latest admission event within 0 to 10 days before the cohort’s
admission. This tricks CLG to be looking at the very admission that is the cohort member’s
admission. The nearest admission is the admission at zero days away from the index admission
so we are functionally looking at whether the index admission came from a nursing home.
Click on the three dotted button.
Clinical Looking Glass will open a window to build a set for the Admission Referral Agency.
48
Skilled Nursing Facilities
Bainbridge Nursing & Rehab Center
Bay Park Center for Nursing & Rehab
Beth Abraham Health Services- PARTNER 5
Bronx Center for Rehab & Healthcare
Bronx Lebanon Special Care Center
Bronx Park Rehab & Nursing Center
Casa Promesa
Concourse Rehab & Nursing Center
Daughters of Jacob Nursing Home
East Haven Nursing & Rehab Center
Eastchester Rehab & Health Care Center
Fieldston Lodge Care Center
Gold Crest Care Center
Grand Manor Nursing & Rehab Center
Hebrew Home at Riverdale- Partner 5
Highbridge Woodycrest Center
Hudson Pointe at Riverdale Center for Nursing & Rehab
Jewish Home Lifecare- Partner 5
Kings Harbor Multicare Center- PARTNER 5
Kingsbridge Heights Rehab & Care Center
Laconia Nursing Home
Manhattanville Rehab & Health Care Center
Methodist Home for Nursing & Rehab
49
Morningside House
Morris Park Nursing Home
Mosholu Parkway Nursing & Rehab Center
Park Gardens Rehab & Nursing Center
Pelham Parkway Nursing Care & Rehab Facility
Providence Rest Nursing Home
Rebekah Rehab & Extended Care Center
Regeis Care Center
Riverdale Nursing Home
Schervier Nursing Care Center- PARTNER 5
Split Rock Rehab & Health Care Center
St. Barnabas Rehab & Continuing Care Center
St. Patrick's Home for the Aged & Infirm
St. Vincent de Paul Rehab & Nursing Center
Terrace Healthcare Center
Throgs Neck Extended Care
University Nursing Home
Wayne Center for Nursing & Rehab
Williamsbridge Manor Nursing Home
Workmen's Circle MultiCare Center
Build the set and then save.
Now Update and save.
We have an admission event with a referral agency equal to a set of nursing homes.
Update and Close.
You have now populated the event in the gui for the analysis canvas.
50
Now Update and close
Edit the Index Event line of the analysis canvas Analysis Definition (AD):
Change Latest so you have a singularity 0/1 no /yes.
Update and close:
51
Now save. You have created your indicator analysis Definition that can be used exactly as the previous
indicator was used.
Choose the AD in the Advanced Method: IsAdmissionfromSNF
52
Maximize the image of the list populator by left clicking:
Resulting in:
Now drag count over to the selected attributes.
Resulting in:
53
Now run the method and note the resulting spreadsheet:
You also have access to the actual SNF names in another field.
54
55
Tutorial 35: Counting Previous Hospitalizations in Wide List View
How to turn a multiplicity into a singularity using only the count attribute and no other
fields from an Analysis Definition using All.
https://www.youtube.com/watch?v=EoM7XXaeWBY&list=PLf7raPnmlLOeAWU2cNf2jIMDRqQuUTCum&
index=32
In a previous tutorial I pointed out that whenever you use in list method All, you must choose the “long
view” to review the results in a spreadsheet. There is one exception. If you restrict yourself to using
only the count variable from the Analysis Definition AD with All, the count is functionally a singularity
and can be used in the wide view.
Warning!!! You must be extremely careful. You must eliminate from the selected “AD with all” any
variable other than count. If for example, you choose, or retain, event date time, then every instance of
the event will generate another column with the event’s date. Remember if one person has 100 dates,
everyone in the spreadsheet will have 100 columns for date.
The use of AD “with all” as a singularity is useful when it is the count that you actually care about.
For example if you are looking at the pneumonia patients and you want to know how many previous
hospital discharges were experience by the patients in the preceding 180 days. What you are looking for
is just the count and the wide view is perfectly appropriate if you make sure only to allow the “count” to
be brought into the selected attributes.
The same is true of number of ED visits without a disposition = admission in the past 180 days.
Details follow:
First select the two groups of admissions with pneumonia and create two AD’s one for the preceding
discharges and one for the preceding Emergency Department without admission visits.
AD for all preceding discharges:
56
Now we also want an AD with ED triage but disposition not admit
57
You must remove any variable from outcome event discharges that have a multiplicity. Count is a
singleton and can be shown in the wide view. The Event Date Time for each admission is a multiplicity
and if kept in the selected attributes would require the use of long view.
The result of these moves is:
58
You will now have a spreadsheet with one column for the outcome variable admission and that will be
the count of the preceding discharges in the preceding 180 days.
Do the same for ED triage
Remove the multiplicities from the outcomes which include both EventDateTime and Disposition
59
Resulting in:
Now run in wide view:
60
Now you have a column count for the number of preceding hospitalizations and the number of
preceding ED visits that did not result in an admission.
We have answered a practical risk factor for readmission question by getting this baseline information.
We were able to use a wide view because all of the attributes in the outcome events were singleton.
We did not bring over any dates or individual values, just the overall summary count.
61
Use of Box for Security
Box creates a virtual drive on your computer. In the configuration we have prepared for you, no
information is stored on your hard drive. You merely see an image of a folder and its files.
All information is encrypted in transit and at rest in the cloud.
You can only access the virtual hard drive when you are connected to the internet.
You will be able to access your virtual drive, whenever you have a web browser and a connection to the
internet. This means that from any Montefiore computer, you should be able to view all the files you
have created in your virtual drive.
This is an experiment to evaluate acceptability of this solution in the workflow of the researcher.
62
Take the Competency Exam
Rules for test taking. You can help your fellow students by pointing out mistakes and giving hints but do
not give answers. CLG is a collaborative tool for a collaborating community
•
The “Orders with Text” event
Read CLG User Manual Chapter 11 p. 317-344 text search capability for pathology, radiology (CT,
MRI…)
•
Read the Table of Contents of Event Manual 3 so you know where to go when you need an
event or a specific attribute.
Congratulations on becoming an analytically empowered participant in modern Healthcare.
63
Steps to Obtain NDI Mortality Data for CLG Users
1. Get an amendment approved from IRB for obtaining mortality data from NDI for research.
2. Visit http://www.cdc.gov/nchs/ndi.htm
They have step by step information and all forms in pdf including the application for getting the data.
3. Get a draft of your application approved by the NDI staff before you submit your final application.
(Each request is assigned a particular associate and you deal with that associate directly).
4. The CLG trainer can provide a sample application successfully completed by an Einstein Colleague for
reference.
5. They have a Routine query (death yes/no and date of death) and a NDI Plus query (includes cause of
death and a copy of death certificate if required).
6. Send an encrypted CD with patient identifiers via overnight mail to CDC.
7. The tricky part is when you get back your results. Depending on how many identifiers you send them
they send back results on possible matches. I suggest sending as many identifiers as possible. First and
Last name with date of birth is a must. SSN is highly advised. Rest are sex, state of residence, marital
status, father’s last name (for women) etc.
Note: Social Security number is not available through Clinical Looking Glass even with identifier
privilege.
8. If you send fewer identifiers, they send a long list of matches for each individual patient and it might
get tricky to identify the exact match. For eg. John Doe born on 01/01/1950 might have 20 possible
matches in the NDI database. But John Doe born on 01/01/1950 residing in NY might have only 4 and
with SSN it might come down to only 1. Plus, the results are sent back in a notepad free text format and
they highly recommend using SAS to write a program to get your proper matches (which I did as well).
9. If you are interested in cause of death, your approved application qualifies you to obtain death
certificates too (with the exception of a few states).
10. There is always a lag for the data available. For eg. As of today, 27JUL2015, complete data (including
cause of death) is only available until 31DEC2013.
For an example of a completed and approved application, please contact the CLG trainer.
64
Methods Section for Use in Citing Clinical Looking Glass Work
Purpose: To put in methods section of work citing Looking Glass
Name in manuscripts from 5/14/14 on.
Looking GlassTM Clinical Analytics ( Streamline Health, Atlanta, Georgia)
Looking GlassTM Clinical Analytics ( Streamline Health, Atlanta, Georgia) is a user-friendly interactive
software application for the evaluation of health care quality, effectiveness, and efficiency. The system
integrates clinical and administrative datasets allowing non-statisticians to produce epidemiologically
cogent self-documenting reports globally assessing care quality while identifying the specific patients in
need of clinical remediation.
Company contact info should refer to the headquarters:
Streamline Health
1230 Peachtree St. NE, Suite 1000
Atlanta, GA 30309
www.streamlinehealth.net
(888)-99-STREAM
65
“Quick Tricks” in Excel for CLG Users
1. Filter your lists: click on upper right hand arrow, can delete additional unneeded information or
keep pertinent information by selecting wanted values in the populated list (this is especially
useful because simple count data shows up at the bottom of the page)
2. Counts:
A. how many cells contain a value (or value over a certain number) such as everyone
who has received more than one macrolide COUNT IF
=countif(range, “>2”)
ex:2
B. If you want to categorize this further, beyond a value count,
=IF(cell>3, “YES”, “”)
ex: greater than 2 = YES
C. Count the number of non-empty cells in a range (if cells are coded as blank, or have
missing values)
=COUNTA( range)
3. If, then statements:
A. If you want to know how many values meet, exceed or fall below a criteria, IF THEN
=IF (cell>=X, “Yes”, IF(cell>2, “No”,””))
4. Basic formulas:
A. Sun, min, max, average, st.dev, median, sqrt are all easy functions that can be
completed by “=” before the function; you can drag the bottom right hand square
across rows or down columns to auto-populate information
Ex: =sqrt(….)
Ex: =SUM(…)
B. Standard error: =stdev(range/sqrt(range))
5. Concatenate:
1. =CONCATENATE(cell,” “, cell)
66
6.
A.
B.
C.
D.
E.
F.
G.
H.
If you have two columns B and C and you have blanks in some of the rows in c that you want
filled with the values in B, the following is the process you should follow:
An image of the challenge:
Select the whole range of Column C
Press control+G (goto)
Press button Special
Press K (blanks) or select blank from the radial buttons
Press Enter (OK)
Press the equals sign
Press the left arrow on the keyboard
Press control +enter
The effect is that all the cells in column C that were blank are filled with the value in column B.. You will
have formulas in column C but text values that you can save as a csv.
7. Review how to use Pivot Table capability of Excel.
67
Common CLG Error Message and First Pass Solution
This is a common server error that you may come across during use of CLG:
Clearing the Internet Explorer cache and deleting all Internet Explorer browsing history is sometimes
sufficient in eliminating the error.
To do this, close out of the current CLG session and any open IE webpages. Re-open internet explorer
and left click on the gear button on the upper right corner of your screen:
68
Left click on “Internet options”:
An Internet Option palette opens:
69
Click on the “General” tab in Internet options and click “Delete browsing history on exit”. Click “Apply”
and “OK” when done.
70
You may also want to update your settings to delete temporary internet files automatically. This is
accomplished by clicking “settings”
Which will open the “Temporary Internet Files and History Settings” Palette
and then check “automatically”. Click “OK” when done.
71
Restart your computer if the same error message appears during your next session in CLG.
If the error message persists even upon computer restart, please contact Ray Gonzalez
([email protected]) with a screenshot of the error message.
A complete or limited CLG server reboot may be needed.
72