1
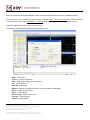
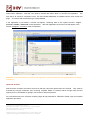
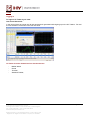
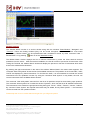
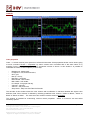
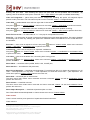
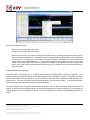
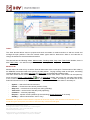
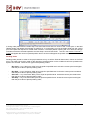
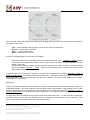
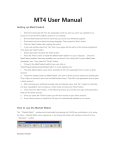
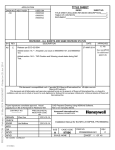
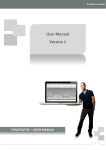
Trader 4 Client
User Guide
Provided by Henyep Investment (UK) Limited
Authorised and regulated by the FCA
28 Throgmorton Street, London EC2N 2AN, United Kingdom
Tel: +44-20-7330-9000 | Fax: +44-20-7628-3272
Email: [email protected]
Registered Office: 150 Aldersgate Street, London EC1A 4AB
- Registered in England and Wales Company No. 2878581
Page 1 of 19
User Guide
-TABLE OF CONTENTSTopics
Page No
Getting Started ………………………………………………… 3
Account Opening ..…………………………………………….. 3 to 5
Login …………………………………………………...….…….. 6
Market Watch …………………………………………………... 7
Charts ………………..……………………..………………..….. 7 to 11
Terminal …………………………………………..……..…..….. 11
Standard Toolbar ……………………………………..……….. 12
Trade Positions ……………………………………………….... 13 to 18
Mailbox Tab ……………………………………………………... 18
Authorised and regulated by the FCA
28 Throgmorton Street, London EC2N 2AN, United Kingdom
Tel: +44-20-7330-9000 | Fax: +44-20-7628-3272
Email: [email protected]
Registered Office: 150 Aldersgate Street, London EC1A 4AB
- Registered in England and Wales Company No. 2878581
Page 2 of 19
Journal Tab ……………………………………………………... 18
GETTING STARTED
The HY Trader 4 Client Terminal is a part of the online trading system provided by Henyep Investment. It is a
software program that needs to be installed on the user's computer.
Primary functions include:
‧
receiving quotes and news in the online mode;
‧
performing trading operations;
‧
controlling and managing open positions and pending orders;
‧
conducting technical analysis;
‧
testing and optimizing trading strategies
‧
viewing real-time account information
HY Trader 4 delivers reliable on-line information direct to the Client Terminal. Such information as quotes and
news are delivered to the terminal when the Client Terminal is connected to the Internet. The Client Terminal
has many functions to enable users to make advanced trading decisions. Advanced technical analysis tools
enable users to benefit from information derived from indicators and line studies.
The Client Terminal can operate under Microsoft Windows 98SE/ME/2000/XP/2003. Hardware requirements are
limited with software ones.
For installation procedures please view the HENYEP Trader Installation Guide.
ACCOUNT OPENING
Open an account
The HY Trader 4 Client Terminal allows for two types of accounts:
‧
‧
Demo (training) account
Real account
The demo accounts make it possible for users to experience capital markets trading in training conditions without
the use of real money. This allows users to become acquainted with the platform and develop and test trading
strategies. Demo accounts have the same properties as the Real accounts. The only difference is that Demo
accounts do not realize any real capital gain/loss and use “mock” currency.
Open demo account
Henyep Investmnet recommends that users open a Demo account to get accustom to the platform and the
features it offers. This will provide the user with a firm background prior to starting real “live” trading activities
Authorised and regulated by the FCA
28 Throgmorton Street, London EC2N 2AN, United Kingdom
Tel: +44-20-7330-9000 | Fax: +44-20-7628-3272
Email: [email protected]
Registered Office: 150 Aldersgate Street, London EC1A 4AB
- Registered in England and Wales Company No. 2878581
Page 3 of 19
with real currency.
Step one would be to download HENYEP Trader 4 following the directions provide in the Installation Guide.
To open an account it is necessary to perform menu command "File — Open an Account" or the same command
of context menu in the window "Navigator — Accounts". When the program is started for the first time, the
software will prompt the user to open a demo account.
The following data would be requested at opening an account:
‧
‧
‧
‧
‧
‧
‧
‧
‧
‧
‧
Name - user's name;
Country - country of residence;
State - state (region, district etc) of residence;
City - city of residence;
Zip code - postal code;
Address - address of residence (street, house and number of apartment);
Phone - contact phone number;
Email - e-mail address;
Account Type - type of the account;
Leverage - credit leverage;
Deposit - a start deposit.
Authorised and regulated by the FCA
28 Throgmorton Street, London EC2N 2AN, United Kingdom
Tel: +44-20-7330-9000 | Fax: +44-20-7628-3272
Email: [email protected]
Registered Office: 150 Aldersgate Street, London EC1A 4AB
- Registered in England and Wales Company No. 2878581
Page 4 of 19
After completing the information requested in the above box activate the box "I accept to subscribe into your
news letters" statement. Next the user needs to activate the button "Next" to continue the registration. The
next step is to choose a connection server. The list indicates addresses of available servers, their names and
pings. The server with the lowest ping is most preferable.
If the registration is successful, a window will appear, containing data on the opened account: "Login" account's number, "Password" access password. After the registration the new account will appear in the
window "Navigator - Accounts", ready for operation.
Attention: should there arise any problems with registration, please contact technical support service of Henyep
Investment
Open real account
Real accounts contrast to the Demo accounts in that they cannot be opened from the Terminal. They must be
activated by Henyep Investment upon receiving complete details of customer either through filling account
opening form on the website or getting in touch with our business partners.
An email will be sent to the customer confirming login ID and password for “HENYEP4 Trader” upon a successful
application procedure.
Authorised and regulated by the FCA
28 Throgmorton Street, London EC2N 2AN, United Kingdom
Tel: +44-20-7330-9000 | Fax: +44-20-7628-3272
Email: [email protected]
Registered Office: 150 Aldersgate Street, London EC1A 4AB
- Registered in England and Wales Company No. 2878581
Page 5 of 19
LOGIN
Logging In
To login to HY Trader 4 you need :
User Id and Password
In the case of demo accounts user id and password will generated while signing up on the HY Trader 4. For real
account holders it will be sent to the user via email.
HY Trader 4 can be divided into four functional areas.
‧
‧
‧
‧
Market Watch
Charts
Terminal
Standard Toolbar;
Authorised and regulated by the FCA
28 Throgmorton Street, London EC2N 2AN, United Kingdom
Tel: +44-20-7330-9000 | Fax: +44-20-7628-3272
Email: [email protected]
Registered Office: 150 Aldersgate Street, London EC1A 4AB
- Registered in England and Wales Company No. 2878581
Page 6 of 19
MARKET WATCH
The "Market Watch" window is a service window along with the windows "Data Window", "Navigator" and
"Terminal". These are floating windows (they can be moved throughout the screen for their most useful
presentation). "Market Watch" can be opened/closed with accelerators Ctrl+M, by menu command "View —
Market Watch" or by pressing
button on of the "Standard" toolbar.
The Market Watch window displays the list of financial instruments by which the client terminal receives
quotations from the server. After the terminal installation, the list will consist of pre-set list of instruments. After
closing the Terminal, the “Market Watch” window will display the previous or last list of instruments which were
active in the window before shutdown.
By pressing the right mouse button in the area of the window "Market Watch" the context menu appears. The
command "Show All Symbols" shows the list of all available instruments. The quotation in the format "BID", "ASK",
"DATE" are displayed by these instruments. To minimize the traffic, it is recommended to exclude the unused
instruments from the quotations' window. By using the command "Hide Symbol" or key delete, the user can
remove instruments from the Market Watch window.
The command "Hide All Symbols" removes from the list of all positions except for those having open positions.
The command "Show Symbol List" invokes the window "Symbols", which has the list of all available instruments.
The instruments in the window are grouped according their types: "Forex", "CFDs", "Futures", "Stocks", "Indices".
By command "Show Symbol" the required instruments may be added, and by "Hide Symbol" — the instrument
can be removed from the quotation window.
Please keep the cursor in market watch and right click you will get all options
Authorised and regulated by the FSA
28 Throgmorton Street, London EC2N 2AN, United Kingdom
Tel: +44-20-7330-9000 | Fax: +44-20-7628-3272
Email: [email protected]
Registered Office: 150 Aldersgate Street, London EC1A 4AB
- Registered in England and Wales Company No. 2878581
Page 7 of 19
CHARTS
Chart properties
Chart — is a time model of price dynamics of a financial instrument. Chart properties window can be shown going
to menu command "Charts — Properties" by chart's context menu command with of the same name or by
pressing F8 key. In result one of this action "Properties" window is shown. In this window it is possible to
customize the colors of chart's objects ("Colors" tab):
‧
‧
‧
‧
‧
‧
‧
‧
‧
‧
‧
Background - background;
Foreground - axis, scale and OHLC;
Grid - grid;
Bar Up - bar up;
Bar Down - bar down;
Bear Candle - bear candle;
Bull Candle - bull candle;
Line Graph - line graph and doji;
Volumes - volumes;
Ask Line - Ask price level;
Stop Levels - Stop Loss and Take Profit levels.
The left side of this window shows the color scheme with modification in real-time. Besides the objects color
definition, field "Color Scheme" is allowed by selecting predefined color scheme: "Yellow on Black", "Green on
Black" or "Black on White". The users own color scheme must be stored on templates.
This window is intended for customizing common chart's properties.
necessary options:
Authorised and regulated by the FCA
28 Throgmorton Street, London EC2N 2AN, United Kingdom
Tel: +44-20-7330-9000 | Fax: +44-20-7628-3272
Email: [email protected]
Registered Office: 150 Aldersgate Street, London EC1A 4AB
- Registered in England and Wales Company No. 2878581
Switch to "Common" tab and select
Page 8 of 19
Offline Chart — switch chart to offline mode. This option blocks the chart from receiving new tick-quotation and
drawing new price data. After disabling this option new price data and tick-quotation will be enabled. By
opening chart in the offline mode (menu command "File — Open Offline") this option is enabled automatically;
Chart on Foreground — place chart price data on "foreground". Enabling this option, all analytical objects
placed "under" price chart. This command is equal to menu command "Charts — Foreground Chart";
Chart Shift — enable/disable chart shift from right side of chart window.
Also press
button on "Charts" toolbar or select menu command "Charts — Chart Shift" to perform this action;
Chart Autoscroll — enable/disable chart auto scrolling to the left by new price quotation receiving.
Also press
button on "Charts" toolbar or select menu command "Charts — Auto Scroll" to perform this action;
Scale Fix One to One — fix chart scale as "1:1". One pips is coresponded to one bar;
Scale Fix — fix chart scale. All charts in terminal by default shown with automated scaling. This option disabled
autoscaling and fix scale. By enabling this options the additional fields "Fixed Maximum" and "Fixed Minimum"
are activated;
button on "Charts" toolbar, select menu command
Bar Chart — show chart as sequence of bars. Also press
"Charts — Bar Chart" or accelerators Alt+1 to perform this action;
Candlestick — show chart as sequence of Japanese candlesticks.
button on "Charts" toolbar, select menu command "Charts — Candlesticks" or accelerators Alt+2
Also press
to perform this action;
Line Chart — show chart as broken line, connecting bars' closing prices.
button on "Charts" toolbar, select menu command "Charts — Line Chart" or accelerators Alt+3 to
Also press
perform this action;
Show OHLC — show/hide OHLC (OPEN, HIGH, LOW, CLOSE) line;
Show Ask line — show/hide the Ask price level;
Show Period Separator — show/hide period separator. For periods from M1 to H1 shown day separators; on 4H
chart — week separators; on day chart — month separators; on week and month chart — year separators. The
same name option in program options perform this action too;
Show Grid — show/hide grid on chart window.
The same name chart context menu command and menu command "Charts", as well as accelerators Ctrl+G
perform this action too;
Show Volume — show/hide volumes.
The same name chart context menu command and menu command "Charts", as well as accelerators Ctrl+L
perform this action too;
Show Object Description — show/hide object description on chart.
Part of described command duplicated on charts context menu and on "Charts" toolbar.
Chart control
Chart is a time model of price dynamics of a particular financial instrument.
Chart control is:
Authorised and regulated by the FCA
28 Throgmorton Street, London EC2N 2AN, United Kingdom
Tel: +44-20-7330-9000 | Fax: +44-20-7628-3272
Email: [email protected]
Registered Office: 150 Aldersgate Street, London EC1A 4AB
- Registered in England and Wales Company No. 2878581
Page 9 of 19
Changing the chart type
There are three types of a financial tool chart in the terminal:
1.Bar Chart — sequence of bars.
button on "Charts" toolbar, combination accelerator keys Alt + 1 or perform menu
It is necessary to press
command "Charts — Bar Chart";
2.Candlestick — is a sequence of Japanese candlesticks.
button on "Charts" toolbar, combination accelerator keys Alt + 2 or perform menu
It is necessary to press
command "Charts — Candlestick";
3.Line Chart — is a broken line, connecting bars' closing prices.
button on "Charts" toolbar, combination accelerator keys Alt + 3 or perform menu
It is necessary to press
command "Charts — Line Chart".
Changing the period
The client terminal supports nine different data periods, from a minute to a month long. A big amount of charts
periods is required to carry out analysis by using technical indicators and line studies.
You can choose the required charts period by means of "Periodicity" toolbar,
menu "Charts — Periodicity".
button on "Charts" toolbar and
Scaling
Charts can be scaled, which allows users to increase and decrease the number of bars displayed on the screen
simultaneously.
"Charts" toolbar, keys "+" / "-", commands "Zoom In" / "Zoom Out" on charts context menu and
To do it use
"Charts" toolbar. Besides, you can set the scale and the maximum and minimum values, by means of the "Scale
Fix" option in Charts setup window.
Scrolling, auto-scrolling and shifting the chart
Scrolling the chart may be of help if scaling doesn't allow the display of all the necessary data on the screen.
Scrolling is shifting the price data on the chart to the left and to the right. It is done by the left and right cursor
keys of the keyboard. Besides, the chart may be scrolled by using a mouse. Pressing the left mouse button in
any point of the chart you just move cursor left or right. Using quick navigation line you can display the wanted
area of the chart, specifying time and date. In case the chart is shifted to the area with no price data, lacking bars
will be automatically downloaded.
"Auto-scrolling" is designed to permanently keep track of the latest bars. Whatever area is displayed currently on
the screen, auto-scrolling will shift the chart to the let you see the latest bars. This function is enabled by
"Charts" command or "Charts — Auto Scroll" menu command.
on
"Shift the chart" function shifts the last bar from the right edge of the screen. This function is enabled by button
button on "Charts" toolbar or by "Charts — Chart Shift" menu command.
Working with templates
Templates are records of a chart’s characteristics with imposed elements. The template saves information on
Authorised and regulated by the FCA
28 Throgmorton Street, London EC2N 2AN, United Kingdom
Tel: +44-20-7330-9000 | Fax: +44-20-7628-3272
Email: [email protected]
Registered Office: 150 Aldersgate Street, London EC1A 4AB
- Registered in England and Wales Company No. 2878581
Page 10 of 19
chart type, period, scale and line studies settings, technical and custom indicators. Templates facilitate quick
adjustment of many different charts to a common type.
Templates control menu will appear if you use menu command "Charts — Template", the same command of the
button on "Charts" toolbar. Menu command "Save Template; allows to save a new
chart's context menu and
template, and command "Remove Template" will delete the earlier saved one.
Data update
Data is updated on the chart in case of errors or incomplete data in the price chart. Data updating is done by
menu command "Charts — Refresh" or similar command of the chart's context menu. Blank data spaces can also
be filled by can move the chart to a correspondent area. When performing all these operations, the missing data
is downloaded from the server and is displayed on the chart. Remember that number of bars displayed on the
chart should not exceed the value, indicated in options.
Working with mouse
Charts are controlled directly by mouse in the following manner:
‧
‧
‧
‧
‧
‧
‧
‧
‧
pressing the left mouse button in any point of the chart and its further horizontal moving will scroll the
chart;
pressing the left mouse button on the chart's vertical scale and cursor's further vertical moving will
change the vertical scale of the chart;
pressing the left mouse button on the chart's horizontal scale (except for the quick navigation line area)
and cursor's further horizontal moving will change the chart's scale;
pressing the mouse's right button in any point of chart's window will invoke context menu;
double click of the left mouse button on the elements of technical indicators (lines, symbols, bar chart's
columns, etc.) invokes window of correspondent indicator's settings;
double click of the left mouse button on the object (line studies, text, geometrical figure or arrow) will
select the object;
pressing of the left mouse button on the selected object, followed by moving, will move the selected
object;
Ctrl + pressing the left mouse button on the selected trend line, followed by moving, will draw a parallel
trend line (create a channel);
pressing the right mouse button on the selected object will open the window of object's settings.
Controlling chart using context menu commands
A part of context menu commands are designed to manage the chart:
‧
‧
‧
‧
‧
‧
‧
Expert Advisors — sub-menu of advisors control;
Remove Script — remove running script;
Indicators — window controlling technical parameters;
Periodicity — sub-menu to control chart's period;
Template — sub-menu to control templates;
Refresh — updating historical data. At this all missing data within available history will be downloaded.
The same action may be done by similar command in "Charts" menu;
Zoom In — zoom in.The same may be done by similar command in "Charts" menu, pressing key "+" or
‧
pressing
button of "Charts" toolbar;
Zoom Out — zoom out.The same action may be done by similar command in "Charts" menu, pressing
key "+" or pressing
button of "Charts" toolbar;
TERMINAL
Authorised and regulated by the FCA
28 Throgmorton Street, London EC2N 2AN, United Kingdom
Tel: +44-20-7330-9000 | Fax: +44-20-7628-3272
Email: [email protected]
Registered Office: 150 Aldersgate Street, London EC1A 4AB
- Registered in England and Wales Company No. 2878581
Page 11 of 19
Terminal Window
The "Terminal" window is a multifunctional window allowing users access to various platform features. This
window allows users to control of trading activities, view news and account history, set up alerts, and work with
the internal mail and system journal functions. The window can be opened by the "View — Terminals" menu
command, by pressing of accelerating keys of Ctrl+T, or the
several tabs in the window:
button of the "Standard" toolbar. There are
Trade — in this tab, one can view the status of open positions and pending orders, as well as manage all trading
activities. Besides, the total financial position for all open positions is published in this tab;
Account History — history for all performed trade operations and balance without taking open positions into
consideration are published here. The efficiency of all trade activities can be estimated with the results given in
this tab;
News — Incoming financial news can be viewed from this tab. This prompt information is indispensable for
fundamental analysis;
Alerts — various alerts can be viewed and set here. Any files executable in the operational environment
(including wave files) and messages to be sent by email can be used as alerts;
Mailbox — all incoming message from HENYEP Trader’s Internal Mail are stored here. Users my communicate
with HENYEP Trader via electronic messages sent from the Terminal;
Expert Advisors — This feature is not available use with HENYEP Trader 4;
Journal — information about terminal start-ups and records about events during its operation session, including
all trade operations performed are stored in the journal section.
STANDARD TOOLBAR
‧
Open the chart of an instrument. The command opens the list of instruments, the selection of the
required symbol opens a new chart. If the terminal database does not contain the file of history data of
instrument, the necessary information is loaded from the server after chart opening. The same operation
can be done after execution the menu command "File — New Chart" and "Window — New Window", as
well as the command of context menu of "Market Watch — Chart Window" window;
‧
Profiles control menu. To work with profiles one can also execute the menu command "File —
Profiles". See "Templates and profiles" for more detailed information.
‧
Open/close "Market Watch" window. The menu command "View — Market Watch" and accelerators
Ctrl+M perform the same function;
‧
Profiles control menu. To work with profiles one can also execute the menu command "File —
Profiles".See "Templates and profiles" for more detailed information.
Authorised and regulated by the FCA
28 Throgmorton Street, London EC2N 2AN, United Kingdom
Tel: +44-20-7330-9000 | Fax: +44-20-7628-3272
Email: [email protected]
Registered Office: 150 Aldersgate Street, London EC1A 4AB
- Registered in England and Wales Company No. 2878581
Page 12 of 19
‧
Open/close "Data Window". The menu command "View — Data Window" and accelerator keys
Ctrl+D perform the same function;
‧
Open/close "Navigator" window. The menu command "View — Navigator" and accelerators Ctrl+N
perform the same function;
‧
Show new order window. The command opens the window, which enables to set the parameters
"Market Order", "Stop Loss", "Take Profit" and "Pending Order". This window can also be opened by
menu command "Tools — New Order", commands of the context menu of "Market Watch — New Order"
window and "Terminal — New Order" ("Trade" tab) window and key F9. See "Orders" for more detailed
information
‧
Start MetaEditor IDE for expert advisor source code modification.The same operation can be done
by menu command "Tools — MetaQuotes
MetaEditor IDE for more detailed information;
Language Editor" and key F4.
See bult-in help of
‧
Allow expert advisors usage.The same operation can be done by menu command "Tools —
Options — Expert Advisors — Enable Expert Advisors". See section "Expert Advisors, Custom
Indicators and Scripts" for more detailed information;
‧
Show terminal options window.The same operation can be done by menu command "Tools —
Options" and accelerators Ctrl+O;
‧
Turn on/off full screen mode.The same function can be done by key F11 or by menu command
"View — Full Screen";
‧
Print the chart.The same function can be done by menu command "File — Print" and the same
command of charts' context menu;
‧
Shart preview.The same function can be performed by menu command "File — Print
and the same command of charts' context menu;
‧
display help topics. The same function can be performed by menu command "Help — Help Topics"
and key F1.
Preview"
TRADE POSITION
Trade Position Opening and Closing
Users can open a trade position via the Market Watch window, Charts or Terminal by using right click on mouse,
following menu will appear:
Authorised and regulated by the FCA
28 Throgmorton Street, London EC2N 2AN, United Kingdom
Tel: +44-20-7330-9000 | Fax: +44-20-7628-3272
Email: [email protected]
Registered Office: 150 Aldersgate Street, London EC1A 4AB
- Registered in England and Wales Company No. 2878581
Page 13 of 19
Closing of the position occurs:
‧
‧
during execution of the Stop Loss order;
during execution of the Take Profit order;
‧
after the user issues a command for closing of the trade position. If among open positions there are the
one or several reverse trades, it is possible to close the chosen position together with the reverse position.
To execute such a trade users must define the reverse position-counteragent one should press the
activate button "Close #XXXXXXX by ...". If the reverse position has the same size with the one being
closed, the financial result of the following operation is defined by the difference between opening and
closing rate. If the positions are positions with different size, the smaller size of the reverse positions is
being calculated.
Instant Execution Technology
Instant Execution Technology (IE) is a feature which remains a the discretion of Henyep Investment. This
technology allows immediate execution of the trade without having to request for a quote. As the user opens the
window "New Order", there will appear a current quotations in real time mode. The buttons "Sell" and "Buy" are
always active. The user my press the button which will lead to an order being placed. If Henyep has enabled
instant execution, then the order will be processed automatically.
During the intensive price movements after pressing the buttons "Sell" or "Buy" the window "Requote" at times will
appear. In the window there will be offered new quotations against which a trade operation can be executed. By
closing position the new quotations also appear in real time mode and the buttons of all available operations are
active.
Authorised and regulated by the FCA
28 Throgmorton Street, London EC2N 2AN, United Kingdom
Tel: +44-20-7330-9000 | Fax: +44-20-7628-3272
Email: [email protected]
Registered Office: 150 Aldersgate Street, London EC1A 4AB
- Registered in England and Wales Company No. 2878581
Page 14 of 19
Orders
The client terminal allows users to prepare and send commands for trade execution as well as control and
manage the open positions. There are several orders' types used for these aims. Order is an instruction to
Henyep Investment to execute a trade transaction.
The terminal has the following orders: Market Order, Pending Order, Stop Loss, Take Profit. Besides, there is
also Trailing Stop — the advisor's equivalent that automatically moves Stop Loss.
Market Order
Market order is an order to buy or sell the financial instrument at the current price. The execution of this order by
the HENYEP Investment leads to the opening of trade position. Buying is being made at ASK price, and selling
is made at BID price. The orders Stop Loss and Take Profit can be attached to Market Order.
The order can be sent for execution from the order control window "New Order". This window can be opened by
menu command "Tools — New Order",
button on "Standard" toolbar, the hot key F9, command "New Order"
of the context menu of windows "Market Watch" and "Terminal — Trade", and also by the double-click on the
financial instrument name in the window "Market Watch". After that in the window there is necessary to:
‧
‧
‧
‧
‧
‧
‧
Symbol — select the financial instrument;
Volume — choose the order volume (amount of lots);
Stop Loss — set the level of the stop loss order (optionally);
Take Profit — set the level of the take profit (optionally);
Comment — comment (optionally);
Request — request current quotations (if the technology Instant Execution is not used);
Sell/Buy — select order direction "sell" or "buy".
Attention: the quotations offered after the request will be active only for a few seconds. If the decision is not
made during this time period, the buttons "Sell" and "Buy" will be blocked again.
Authorised and regulated by the FCA
28 Throgmorton Street, London EC2N 2AN, United Kingdom
Tel: +44-20-7330-9000 | Fax: +44-20-7628-3272
Email: [email protected]
Registered Office: 150 Aldersgate Street, London EC1A 4AB
- Registered in England and Wales Company No. 2878581
Page 15 of 19
If during order placement the levels Stop Loss and Take Profit were too close to the current price in the field
"Market Order" will appear the message "Invalid Price". It is necessary to move the levels aside from the current
price and repeat the request for market order execution. The trade position opening will occur after the Henyep
Investment executes the trade operation and sets Stop Loss and Take Profit. At that in the window "Terminal —
Trade" will appear the record of opened position and in the chart will appear the opened order price level.
Pending Order
Pending Order placed an order to Henyep Investment to buy or sell the financial instrument in future on the fixed
price. This order type is being used for the opening of a trade position on the condition that future quotations are
equal to the set level. There are four types of the pending orders:
‧
Buy Limit — buy if the future "ASK" price is equal to specified level. At that the current price level higher
than the price value of placed pending order;
‧
Buy Stop — buy if the future "ASK" price is equal to specified level. At that the current price level below
than the price value of placed pending order;
Sell Limit — buy if the future "BID" price is equal to specified level. At that the current price level below
than the price value of placed pending order;
Sell Stop — buy if the future "BID" price is equal to specified level. At that the current price level higher
than the price value of placed pending order;
‧
‧
Authorised and regulated by the FCA
28 Throgmorton Street, London EC2N 2AN, United Kingdom
Tel: +44-20-7330-9000 | Fax: +44-20-7628-3272
Email: [email protected]
Registered Office: 150 Aldersgate Street, London EC1A 4AB
- Registered in England and Wales Company No. 2878581
Page 16 of 19
Stop Loss and Take Profit orders can be attached to Pending Order. In order to use this order it is necessary in
the window "New Order":
‧
‧
‧
‧
Type — select delayed order type (Buy Limit, Buy Stop, Sell Limit, Sell Stop);
At Price — set the order price level;
Expiry — order expiration time;
Send — send order for execution.
Execution of Pending Order is carried out in two stages:
‧
‧
After order placement of a Pending order the order details appear in the "Terminal — Trade" window.
In the chart, if the context menu option "Show on the Charts" is enabled, the trade information will also
appear on the chart;
In case a trade position is opened, the future prices correspond to the order condition. At that time please
refer to the window "Terminal — Trade". The line of the delayed order is removed and the line of the
open position appears.
A delayed order can be removed or changed by command from context menu of window "Terminal — Trade —
Modify or Delete Order" or by double-clicking on required order. After that, to make a change, it is necessary to
fill the field "Price" with the new data and press the button "Modify". The order can be deleted by the “Delete”
command from context menu.
Stop Loss
A stop Loss order is intended to minimize losses in case the financial instrument price has started moving in the
unprofitable direction. The order is always connected either with an open position or with pending order. In both
cases to change the order it is necessary to run the context menu command of the window "Terminal — Trade —
Modify or Delete Order" or to double-click the left mouse button on the required position (pending order).
To place the order one should enter the required value in the field "Stop Loss". In case the order is changed in
this field it will store a new value. To delete this order it is necessary to indicate a zero value in this field. After
each of these actions one should press the button "Modify Order".
Authorised and regulated by the FCA
28 Throgmorton Street, London EC2N 2AN, United Kingdom
Tel: +44-20-7330-9000 | Fax: +44-20-7628-3272
Email: [email protected]
Registered Office: 150 Aldersgate Street, London EC1A 4AB
- Registered in England and Wales Company No. 2878581
Page 17 of 19
The execution of the Stop Loss order attached to the open position occurs in two stages:
‧
‧
after a Stop Loss order placement, Henyep Investment makes an order execution. The chart window will
mark the order price level within the chart for analysis.
trade position closing can occur on the condition that the future prices are equal to specified order level.
The order execution occurs at that time and in the window "Terminal — Trade" open position line will be
removed, and in the tab "Account History" is stored and the information about the trade operations being
carried out.
Attention: Stop Loss works only with opened positions and does not respond to pending orders. Stop Loss
placement on pending orders is enabled only after Pending Order becomes an opened position.
Take Profit
A Take Profit order is intend to allow the user to profit after the financial instrument price reaches the predicted
level. An order can be placed for execution together with Market Order or Pending Order. The order can be also
be changed or removed. In this case, one needs to follow the pattern action of the Stop Loss order. Please
note that the field "Take Profit" should be filled in.
Trailing Stop
A Stop Loss order is intended to minimize losses in case the chart of the financial instrument price has started
moving in the unprofitable direction. When an opened position becomes profitable, a Stop Loss order can be
moved manually placed at a certain distance from the current price. Trailing Stop is used to automate this
process and maximize the potential profit. This tool is especially useful during a strong unit-directional motion of
the price (by the pronounced trend without a deep backoff) and also in case there is limited ability to watch price
movements in the markets closely.
To set a Trailing Stop it is necessary to run the context menu command in the window "Terminal — Trade —
Trailing Stop". Next the user must customize the desired value of distance between the order level and the
current price.
As each tick-quotation is displayed the terminal will check for position profitability. If an open position is
profitable and a Stop Loss Order is not placed and the predicted level of Trailing Stop is in the loss zone, this
mechanism will be idle. The terminal traces the boundary in price levels. As soon as the price moves into the
profitable zone (profit at the points is equal or is more than the parameter Trailing Stop), the command for Stop
Loss placement will be executed automatically. The order level is set at the distance indicated from the current
price.
In case the price moves into a very profitability position, Trailing Stop automatically moves Stop Loss behind the
price. If the incoming prices decrease the profitability of the position then no order modification occurs. Thus,
there is a limitation of losses of the opened position without participation of the user. For each automatic
modification of the Stop Loss Order there is a record placed in the journal.
The execution of a Trailing Stop Order can be stopped if one shows the parameter "None" in the order
management menu. To cut off all Trailing Stops it is necessary to run the command "Delete All".
Attention: Trailing Stop woks on the client terminal and not on the server like Stop Loss or Take Profit. Therefore,
by exit from terminal, in contrast to the specified above orders, Trailing Stop will not be worked. At the deactivated
terminal there is only Stop Loss, placed by Trailing Stop that can be executed
Expert Advisors
Authorised and regulated by the FCA
28 Throgmorton Street, London EC2N 2AN, United Kingdom
Tel: +44-20-7330-9000 | Fax: +44-20-7628-3272
Email: [email protected]
Registered Office: 150 Aldersgate Street, London EC1A 4AB
- Registered in England and Wales Company No. 2878581
Page 18 of 19
This function is not available for users of HY Traader 4
MAILBOX TAB
The "Mailbox" tab allows Henyep Investment to communicate with users. It is important that users check the
their mailbox often for important announcements and other information.
This tab contains all incoming messages delivered by Heneyp Investmnet. The content of the selected e-mail
can be viewed by double-clicking the left mouse button on the required heading or with the help of the command
from the context menu "View" one can view the content of the selected e-mail, and delete the message by the
command "Delete". It is also possible to send letters to the system administrator and to the technical support
departments using this tab. To create a message run the command from the context menu "Create".
JOURNAL TAB
The "Journal" tab contains information about all actions of the user within the Client Terminal for the current
session. All information will be removed after the user logs off and starts a new session. All information of
actions preformed by the user during its operating session is displayed in this tab such as all trading operations.
To check the previous messages it is necessary to run the command "Open" and choose the required file.
Authorised and regulated by the FCA
28 Throgmorton Street, London EC2N 2AN, United Kingdom
Tel: +44-20-7330-9000 | Fax: +44-20-7628-3272
Email: [email protected]
Registered Office: 150 Aldersgate Street, London EC1A 4AB
- Registered in England and Wales Company No. 2878581
Page 19 of 19