1
MetaTrader 4 and MetaEditor
User Manual
Version 1.2
© 2012 Global Futures and Forex, Ltd. All rights reserved.
Table of Contents
Welcome to the MetaTrader and MetaEditor User Manual ............................................... 4
Section 1: Opening MetaTrader for the First Time ............................................................ 5
Viewing the MetaTrader Workspace .............................................................................. 5
The Menu Bar ................................................................................................................ 6
MetaTrader Toolbars ...................................................................................................... 6
Market Watch Quote Board ............................................................................................ 7
The Navigator Window ................................................................................................. 10
The Chart ..................................................................................................................... 12
Connect ........................................................................................................................ 12
The Mini Terminal ........................................................................................................ 14
Trade Terminal ............................................................................................................. 16
The Terminal Window .................................................................................................. 17
The Data Window ......................................................................................................... 19
Strategy Tester ............................................................................................................. 20
Section 2: Opening and Managing Your Trades ............................................................. 21
Available Order Types in MetaTrader .......................................................................... 21
Viewing Pricing Information .......................................................................................... 22
Placing Orders with Mini Terminal ............................................................................... 25
Placing Orders in the Trade Terminal .......................................................................... 26
Calculating Stops or Limits ........................................................................................... 29
Placing Orders in the New Order Window ................................................................... 30
Saving Orders as a Template ...................................................................................... 31
Opening the Order Window .......................................................................................... 33
Placing Market Orders in the Order Window ................................................................ 34
Placing Pending Orders in the Order Window ............................................................. 35
Managing Orders in the Trade Terminal ...................................................................... 36
Managing Orders in the Terminal Window ................................................................... 37
Setting Stops and Limits in the Trade Terminal ........................................................... 37
Setting Stops and Limits in the Terminal Window ........................................................ 39
Modifying Orders in the Terminal Window ................................................................... 40
Deleting Orders in the Terminal Window ..................................................................... 41
Placing a Trailing Stop ................................................................................................. 41
Managing Order-Cancels-Another (OCA) Orders ........................................................ 43
Setting Up an Automated Close ................................................................................... 44
Applying a Partial Close ............................................................................................... 46
Closing Positions in the Terminal Window ................................................................... 47
Closing Offsetting Positions ......................................................................................... 48
Viewing Your Account History ...................................................................................... 49
Viewing and Setting Alerts in the Terminal Window ..................................................... 50
Setting Account Alarms (Trade Terminal) .................................................................... 52
Section 3: Using the Chart Tools ..................................................................................... 54
Opening Charts ............................................................................................................ 54
Opening Charts Offline ................................................................................................. 55
Viewing the Chart Window ........................................................................................... 56
Displaying the Chart Toolbar ........................................................................................ 57
Selecting a Chart Type and Time Frame ..................................................................... 58
Switching Between Chart Time Frames and Instruments with Fast Navigation ........... 61
1
Displaying Other Tools in the Chart Window ............................................................... 62
Displaying the Line Studies Toolbar............................................................................. 65
Drawing in the Chart .................................................................................................... 71
Drawing Channels on the Chart ................................................................................... 72
Drawing with the Gann Tools on the Chart .................................................................. 74
Drawing with the Fibonacci Tools on the Chart ............................................................ 76
Adding Shapes to the Charts ....................................................................................... 78
Using the Advanced Drawing Tools in the Charts ........................................................ 80
Configuring Drawings in the Chart ............................................................................... 83
Grouping Charts with Profiles ...................................................................................... 85
Placing Trades from the Chart ..................................................................................... 86
Managing Technical Indicators in the Chart ................................................................. 87
Managing Expert Advisors ........................................................................................... 92
Applying Pivot Points to the Chart ................................................................................ 93
Adding the Currency Index to a Chart .......................................................................... 94
Displaying Detailed Candlesticks in a Chart ................................................................ 95
Applying an Autochartist™ Custom Indicator ............................................................... 96
Managing Templates in the Chart Window .................................................................. 97
Closing Charts and Recovering Them ......................................................................... 98
Section 4: Opening MetaEditor for the First Time ........................................................... 99
Opening MetaEditor ..................................................................................................... 99
Viewing the MetaEditor Workspace ........................................................................... 100
The Menu Bar ............................................................................................................ 101
The MetaEditor Toolbar ............................................................................................. 101
The Toolbox Window ................................................................................................. 103
The Navigator Window ............................................................................................... 107
The Code Window ...................................................................................................... 110
The Options Window .................................................................................................. 111
Section 5: Using MetaTrader’s Autotrading Tools ......................................................... 113
Enabling Autotrading Tools ........................................................................................ 114
Finding Autotrading Tools in the Online Library ......................................................... 116
Creating an Expert Advisor ........................................................................................ 118
Testing an Expert Advisor .......................................................................................... 120
Viewing the Results of the Expert Advisor Test ......................................................... 123
Attaching an Expert Advisor to a Chart ...................................................................... 128
Modifying an Expert Advisor Attached to a Chart ...................................................... 131
Removing an Expert Advisor from the Chart .............................................................. 132
Creating a Custom Indicator ...................................................................................... 133
Adding a Custom Indicator to the Chart ..................................................................... 136
Modifying a Custom Indicator Attached to a Chart ..................................................... 138
Creating a Script ........................................................................................................ 139
Executing a Script on the Chart ................................................................................. 141
Removing a Script Attached to a Chart ...................................................................... 143
Modifying an Expert Advisor, Custom Indicator or Script ........................................... 145
Deleting an Expert Advisor, Custom Indicator or Script from the Navigator .............. 146
Adding a Library to an Expert Advisor or Script ......................................................... 147
Setting Keyboard Shortcuts for Autotrading Tools in the Navigator Window ............. 149
Section 6: Generating Reports ...................................................................................... 151
Generating MetaTrader 4 Reports ............................................................................. 151
Section 7: Customising the Appearance and Settings in MetaTrader ........................... 153
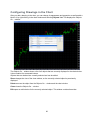
Changing the Language in MetaTrader ..................................................................... 153
2
Customising the Toolbars .......................................................................................... 154
Adding RSS Feeds to Connect .................................................................................. 155
Filtering News in Connect .......................................................................................... 156
Adding Twitter Feeds in Connect ............................................................................... 158
Filtering Twitter Feeds in Connect ............................................................................. 158
Changing the Mini Terminal and Trade Terminal Settings ......................................... 160
Customising the Appearance of the Chart Window ................................................... 161
Changing the Colour of the Chart Window ................................................................. 161
Customising Viewing Settings on the Chart Window ................................................. 163
Specifying MetaTrader User Settings ........................................................................ 165
Viewing MetaTrader Server Settings ......................................................................... 165
Specifying Chart and History Data Properties ............................................................ 166
Customising Object Properties on the Chart .............................................................. 167
Specifying Order Settings .......................................................................................... 168
Customising Autotrading Settings .............................................................................. 169
Entering Email and Server Settings ........................................................................... 170
Entering Reporting Settings ....................................................................................... 171
Customising Sounds for MetaTrader ......................................................................... 172
Accessing the History Centre ..................................................................................... 173
Exporting Quotes ....................................................................................................... 176
Managing Global Variables ........................................................................................ 177
Using the Advanced Security System ........................................................................ 177
Appendix A: MetaTrader Hot Keys ................................................................................ 178
3
Welcome to the MetaTrader and MetaEditor User
Manual
In this user manual, you’ll find instructions on how to use the features and tools in MetaTrader. If
you’re new to the program, you can walk step-by-step through this manual to learn how to login and
access specific MetaTrader features. If you’ve been using automated trading systems for a while,
we’ve included a detailed table of contents so you can quickly reference how to use a specific section
or tool in the MetaTrader platform.
What are MetaTrader and MetaEditor?
MetaTrader is an online trading system that allows you to place trades, manage open positions and
pending orders, and conduct technical analysis. You can also use MetaTrader with automatic trading
and analysis tools. Once these tools are active in the chart window, MetaTrader automatically
executes and manages orders based on market conditions and the settings you specified.
This version MetaTrader offers more tools and flexibility than many versions on the market. This user
manual provides a comprehensive look at all of these tools in MetaTrader.
This manual also provides an overview of MetaEditor, an application installed with MetaTrader that
develops autotrading tools. With MetaEditor, traders can import, create and modify expert advisors,
custom indicators, scripts and other MetaTrader autotrading tools.
Before You Use MetaTrader and MetaEditor
MetaEditor is a development tool. If you plan on creating and editing autotrading files, you should be
familiar with the MQ4 programming language. You can learn more about this at:
http://www.mql4.com.
Even if you aren’t familiar with programming, you can use the application to download autotrading
files.
Tips for Using This Manual
This guide uses the following notes to emphasise important information about MetaTrader.
Describes information on the action of a tool or feature in MetaTrader. When you see
this symbol, it provides a larger context for information and procedures.
Provides hints, tricks and shortcuts that may help you as you place and monitor trades
in MetaTrader.
Alerts you of critical information that you need to know when you perform a particular
procedure.
4
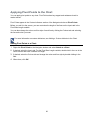
Section 1: Opening MetaTrader for the First Time
Before you start trading, you’ll want to launch the MetaTrader platform and become familiar with its
workspace. In this section, you’ll receive an overview of the tools and features that you’ll use while
trading in MetaTrader.
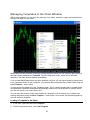
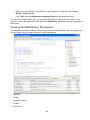
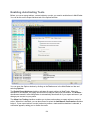
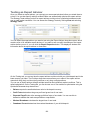
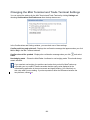
Viewing the MetaTrader Workspace
The MetaTrader workspace contains all of the features and charts you need to trade.
A. Menu Bar
B. Toolbar
C. Market Watch
D. Navigator
E. Terminal
F. Status Bar
G. Chart window
H. Connect window
MetaTrader has a customisable interface. You can open, move, arrange, resize, and
close windows as you see fit.
5
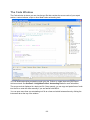
The Menu Bar
At the top of the workspace, you’ll see the MetaTrader menu bar. You can use options in the seven
menus that appear here to manage windows and other tools while you trade.
File – Displays menu options for opening and printing charts, managing chart profiles, and displaying
account information.
View – Contains menu options for displaying MetaTrader windows and toolbars. You can also
manage your language preferences and access the Strategy Tester from this window.
Insert – Displays menu options for displaying indicators, drawing and analytic objects, and text in the
chart window.
Charts – Contains menu options for managing the appearance of the chart window. You can change
the time frame and chart type as well as display grid features.
Tools – Contains tools for placing orders, displaying the History Centre, accessing MetaEditor, and
customising the interface.
Window – Displays menu options for arranging the windows in the MetaTrader workspace.
Help – Contains menu options for displaying MetaTrader online help, accessing the MQL.4 (the
MetaTrader programming language) community and viewing version information.
MetaEditor is an application installed with MetaTrader that enables traders to import,
create, and modify expert advisors, custom indicators, scripts, and other autotrading
tools. See Section 4: Opening MetaEditor for the First Time for more information.
MetaTrader Toolbars
MetaTrader groups its most commonly used tools on four toolbars. You can access these by clicking
the View menu, selecting Toolbars and then clicking on the menu option for the toolbar you want.
The Standard toolbar contains tools for displaying windows in the MetaTrader workspace.
The Charts toolbar displays tools for managing the appearance of the chart window.
The Line Studies toolbar contains tools for displaying drawing and analytic objects and text in the
chart window.
The Periodicity toolbar displays tools for managing time frames of the chart window.
6
You can customise all of the toolbars so that they contain only the tools that you use.
For more information, see Customising the Toolbars in Section 7: Customising the
Appearance and Settings in MetaTrader.
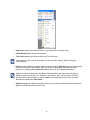
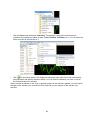
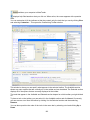
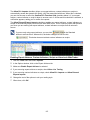
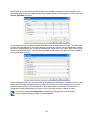
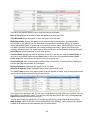
Market Watch Quote Board
You can monitor the real-time bid and ask prices of the available instruments in the Market Watch
quote board. These are displayed on two tabs.
The Symbols tab displays a list of instruments to trade and their prices.
The arrow beside the instrument symbol shows if the price is higher or lower than the previously
listed price. The Bid and Ask prices also show market direction. If the price is lower than the last
reported one, the numbers appear in red. If the price is higher than the last reported one, the
numbers appear in blue.
You can rearrange the instruments as desired by clicking on the symbol you want and dragging it to a
new location.
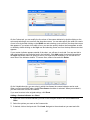
If you right-click on an instrument when the Symbols tab is selected, you can access a drop-down
menu with several options.
7
•
New Order displays the Order window so you can place an order to trade.
•
Chart Window opens a new chart window.
•
Tick Chart changes the Symbols tab to the Tick Chart tab.
You can also double-click an instrument to view the Order window. See Opening the
Order Window.
•
Hide removes a single instrument symbol from the window. Hide All temporarily removes all
instrument symbols in the window. Hide only works on instruments that have no open
positions or pending orders. Show All displays the list of all available instruments.
When you hide an instrument in the Market Watch window, that instrument will also be
hidden in other tools as well. For example, if you want to open a chart of the AUD/CAD,
but the currency pair is hidden, it will not appear in the drop-down menu when you click
the File menu and select New Chart.
•
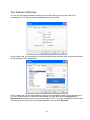
Symbols displays the Symbols window where you can further customise which instruments
appear in the Market Watch quote board.
8
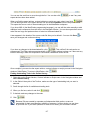
From this window, you can select the instrument that you want to appear in the Market Watch
window by selecting the instrument and clicking Show or Hide. Hidden instruments will have
a gray symbol next to their name. You can also view information, such as pricing and size, for
each instrument by clicking Properties.
•
Sets allows you to save the instruments displayed in the Market Watch quote board as a set
and select it from a list.
The next set of menu options control the appearance of the Market Watch quote board.
•
High/Low expands the quote board to display the high and lows for the instruments.
•
Time also expands the quote board to display the time that the bid and ask prices were
recorded.
•
Auto Arrange resizes the columns automatically if the quote board size changes.
•
Grid displays lines between the rows and columns in the quote board
You can click on the Tick Chart tab to display a chart of the selected instrument with its price
movements measured by the tick.
9
The Tick Chart captures the buy prices with a buy line (which appears in red when you first open
MetaTrader). If you right-click in the tab, you can view the ask price movements by right-clicking in
the window and selecting Ask Line. This appears on the chart as a blue line.
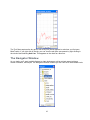
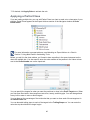
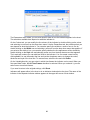
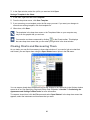
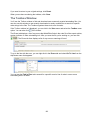
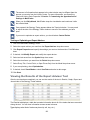
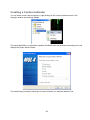
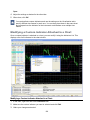
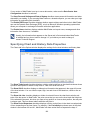
The Navigator Window
As you trade, you’ll want to add indicators to chart windows as well as activate expert advisors,
custom indicators, and scripts. The Navigator Window is where you can view all of the available tools.
10
The Navigator window is divided into two tabs. On the Common tab, you can select menu options
from a grouped list. To display the available menu options, click + next to the group name. To hide
them, click – next to the group name.
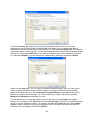
Accounts displays the list of open accounts. If you have more than one account, you can use this
menu to select the one that you want. If you right-click on an account, you can access a drop-down
menu which includes options to login to an account, delete an account, or open a new practice
account.
Indicators shows a list of up to 100 different technical indicators (depending on your account type)
that you can add to the chart window. Many traders use technical indicators to forecast where the
market may be going. You can right-click on the indicator you want and click Attach to Chart from
the drop-down menu to display it in a chart window.
Expert Advisors contains a list of all available expert advisor strategies; these are programs that
automatically analyse market conditions and place trades based on criteria you set.
Custom Indicators displays a list of trader-modified technical indicators.
Scripts contains a list of available scripts; these are programs that perform a single trading action
once.
You can download expert advisors, custom indicators, scripts, and libraries from other
sources or create them in MetaEditor, an application installed with MetaTrader that
develops autotrading tools. See Section 4: Opening MetaEditor for the First Time to
learn more about MetaEditor and Section 5: Using MetaTrader’s Autotrading Tools
for more information on these tools.
If you right-click on a specific indicator, expert advisor, script, or custom indicator, you can select Add
to Favourites from the drop-down menu. You can then view these on the Favourites tab on the
Navigator window.
11
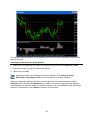
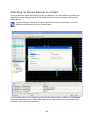
The Chart
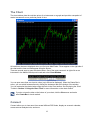
The chart window plots the real-time prices of an instrument on a graph and provides a snapshot of
market movements over a particular period of time.
At least three charts are displayed when you first open MetaTrader. Prices appear on the right side of
the chart and the time and date appear along the bottom.
There are several ways to open the chart window. One of the most common is to right-click on an
instrument in the Market Watch quote board and select Chart Window.
You can open more than one chart at a time (up to 99 can be displayed). When the Charts Bar is
active, you can switch between them by clicking the instrument tab at the bottom of the window.
You can customise the chart window using the tools in the Chart toolbar. See Displaying the Chart
Toolbar in Section 3: Using the Chart Tools for more information on the chart window.
If you do not see the tabs on the bottom of your chart, click the View menu and make
sure Charts Bar is check marked.
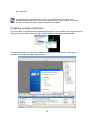
Connect
Connect allows you to view news from several different RSS feeds, display an economic calendar,
access account analysis tools, and more.
12
Before you use Connect, you need to make sure that Expert Advisors is active to use it. If
Connect is not already open when you first login to MetaTrader, you can open it by
displaying the Expert Advisors list in the Navigator window and dragging it to a chart.
MetaTrader replaces the chart and all existing autotrading tools running in that chart with
Connect, so you may need to open Connect in a new chart so you do not lose your
current chart and its settings.
Like the chart windows, you can maximise the Connect window by clicking
.
At the top of the window, you’ll see several buttons.
•
News displays market headlines and news stories. Several feeds are offered, but you can add
additional feeds. You can also filter stories by time frame or keyword. When you select keyword,
you can also set an alarm for when a news item with that keyword appears.
•
Calendar displays a daily economic calendar. Here, you can view upcoming economic
announcements and their possible impact on a region.
If you click Timezone, a message appears explaining that the time zone that you see is
based on your computer’s local time. If you want to change which time zone appears in
Connect, you’ll have to change your computer’s settings.
•
Twitter You can add Twitter feeds from sources that you follow.
•
Dashboard allows you to access MT4i where you can run P&L reports and publish your trading
information. You can filter by instruments, time frames, and time of trade. You can also view
market sentiment to see what other traders are trading.
13
•
Live Chat opens the Live Help window.
•
Webinars displays a list of upcoming webinars and seminars.
•
Free Guides displays an index with all complementary trading guides.
•
Open Account opens the account registration page.
While the Dashboard contains fields for balance, equity, and margin data, you should not
use these to moderate your account. When you sign up for MetaTrader 4, you will also
receive access to an online trading application, which displays the most accurate trading
activity on your account. All transaction/order history information that appears in this
online trading application is considered the most accurate and legally-binding. Because
of this, we recommend that you have both MetaTrader 4 and the online trading
application open when trading to compare equity values.
For more information on customising the views for the News and Twitter sections, see
Section 7: Customising the Appearance and Settings in MetaTrader.
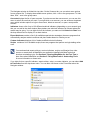
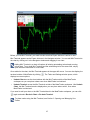
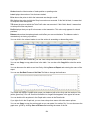
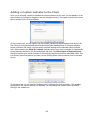
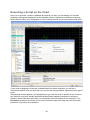
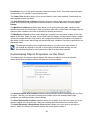
The Mini Terminal
The Mini Terminal displays real-time prices and the current market direction of a specific instrument.
You can also use it to place one-click market orders or set up a trade with multiple stops and limits.
14
Before you use Mini Terminal, you need to make sure that Expert Advisors is active to use it.
Mini Terminal appears under Expert Advisors in the Navigator window. You can add Mini Terminal to
the chart by clicking on it in the Navigator window and dragging it to a chart.
Adding Mini Terminal to a chart will replace all existing autotrading tools already running
in that chart. To run both Mini Terminal and the autotrading tool at the same time, simply
open the same instrument in a new chart.
Once added to the chart, the Mini Terminal appears in the upper left corner. You can also display the
terminal outside of MetaTrader by clicking
displays two menu options:
. The Tasks and Settings window opens, which
•
Undock Chart moves the chart window with the Mini Trader outside of the MetaTrader
workspace so you can place orders even when MetaTrader is minimised.
•
Undock Terminal moves the Mini Terminal outside of the MetaTrader workspace. Like Undock
Chart, the Mini Terminal remains displayed so you can place orders with it, even when
MetaTrader is minimised.
If you need to add your chart or the Mini Terminal back to the MetaTrader workspace, you can click
again and select Re-dock Chart or Re-dock Terminal.
To place trades using the Mini Terminal, see Section 2: Opening and Managing Your
Trades.
15
Trade Terminal
When you want to monitor market moves or place trades quickly, you can use the Trade Terminal.
This displays a number of MetaTrader tools and features in a separate window.
Before you use Trade Terminal, you need to make sure that Expert Advisors is active to use it.
Trade Terminal appears under Expert Advisors in the Navigator window. You can open the Trade
Terminal by clicking and dragging it from the Navigator window to a chart.
MetaTrader will replace the chart and all existing autotrading tools already running in that
chart with the Trade Terminal. However, you may need to open the Trade Terminal in a
new chart so you do not lose your current chart and its settings.
The Trade Terminal consists of three central areas:
•
The Market Watch window contains several Mini Terminals which display current prices and
market direction. The instruments that appear here are based on the selections in the Market
Watch quote board. To add or edit instruments, you’ll need to edit the Market Watch quote board.
You can enter one-click market orders or set up a trade with multiple stops and limits by clicking
in a specific Mini Terminal.
•
The Account Summary shows your account balance, current equity, floating P/L, and margin.
•
The Order List displays all of your open positions and pending orders. You can also access tools
to manage orders, such as trading alarms.
While the Account Summary contains fields for balance, equity, and margin data, you
should not use these to moderate your account. When you sign up for MetaTrader 4, you
will also receive access to an online trading application, which displays the most accurate
trading activity on your account. All transaction/order history information that appears in
16
this online trading application is considered the most accurate and legally-binding.
Because of this, we recommend that you have both MetaTrader 4 and the online trading
application open when trading to compare equity values.
You can also display the Trade Terminal outside of MetaTrader. In the Open and Pending Orders
section, click Settings and check Undock Terminal. You can continue to use the Trader Terminal,
even when MetaTrader is minimised. To redock the window, click Settings and uncheck Undock
Terminal.
To place trades using the Mini Terminal, see Section 2: Opening and Managing Your
Trades for more information.
The Terminal Window
You can monitor your trading activity, manage your expert advisors, and perform other trading tasks
in the Terminal window. This usually appears at the bottom of the MetaTrader workspace. These
features are arranged in the window on several tabs.
If the Terminal window is not displayed, you can view it by clicking the View menu and
selecting the Terminal menu option.
The Trade tab displays your open positions and pending orders. This is where you’ll manage all of
your trades.
While the Trade tab contains fields for balance, equity, and margin data, you should not
use these to moderate your account. When you sign up for MetaTrader 4, you will also
receive access to an online trading application, which displays the most accurate trading
activity on your account. All transaction/order history information that appears in this
online trading application is considered the most accurate and legally-binding. Because
of this, we recommend that you have both MetaTrader 4 and the online trading
application open when trading to compare equity values.
The Account History tab compiles a list of all executed trades. You can also view your profit and loss,
credits, deposits, and withdrawal information.
17
The Alerts tab shows a list of alerts. You can also use this tab to set alarms to notify you when an
instrument has either reached a specific price or crossed an indicator trend line. See Viewing and
Setting Alerts in Section 2: Opening and Managing Your Trades for more information.
The Mailbox tab displays electronic messages sent to MetaTrader.
The Experts tab shows information about the expert advisors that are active in your account. You can
also view positions the expert advisor opened or closed.
The Journal tab displays system messages about your account, such as login times, orders filled or
edited and positions closed.
Not all tabs will appear when you first open the Terminal window. For example, the
Experts tab does not appear when you first open MetaTrader. This tab remains hidden
until you receive input from MetaEditor, an application installed with MetaTrader that
enables traders to import, create and modify expert advisors, or another MQL4
program. See Section 4: Opening MetaEditor for the First Time for more information.
18
The Data Window
The Data Window displays price information for the instrument in the displayed chart. You can view
the open, high, low, and close as well as the date, time, and volume. When an indicator or a custom
indicator has been attached to a chart, you can view information about it in this window.
You can display the Data Window by clicking the View menu and selecting Data Window.
You can right-click in the Data Window to view the following menu options:
Copy allows you to copy information from the Data Window.
Last Data displays a column in the Data Window which contains the latest open, high, low, and
close, when checked.
Auto Arrange automatically resizes the columns in the Data Window if the window size changes,
when checked.
Grid displays a border around the rows and columns in the Data Window, when checked.
You can choose which information appears in the Data Window by selecting Show and then
checking or unchecking the options in the drop-down menu.
19
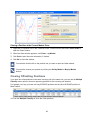
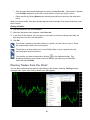
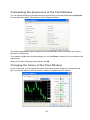
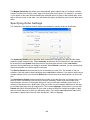
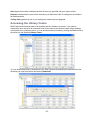
Strategy Tester
With MetaTrader, you can create expert advisors to help you analyse markets and make trades
automatically. The Strategy Tester window allows you to test expert advisor strategies against
already saved market history data and modify expert advisors as needed.
The Settings tab is where you specify which expert advisor, the testing period, modelling, and other
information.
The Journal tab displays a list of system messages about the expert advisor’s test, such as orders
filled and positions closed.
The Results tab displays a table that contains information about all of the trades that were executed
during the test.
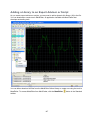
The Graph tab shows the test results. After a test, you can view a graph which maps your balance
(with a blue line) and the number of lots (with a green line). You can view this information in a legend
that appears in the upper left corner.
The Report tab displays statistics about how the test was performed.
The Optimisation Results tab displays a table that contains information about all of the trades that
were executed during the optimisation.
The Optimisation Graph tab displays a graph which maps your profitable trades (in a green line) and
your unprofitable trades (in a red line).
Not all tabs will appear when you first open the Strategy Tester window. For example,
the Results tab, Graph tab, and Report tab appear only after the expert advisor has
been tested. The Optimisation Results and Optimisation Graph appear only when an
expert advisor has been optimised. See Testing an Expert Advisor in Section 5: Using
MetaTrader’s Autotrading Tools.
20
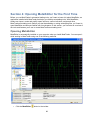
Section 2: Opening and Managing Your Trades
Now that you’re familiar with some of the windows in MetaTrader, we’ll look at the tools that you’ll use
to place and monitor your trades. This section describes the various order types that are available in
MetaTrader and the tools you can use to manually manage your orders in the market.
Available Order Types in MetaTrader
When you trade with MetaTrader, there will be times when you need to manually place an order to
open a position in the market. MetaTrader allows you to do this using several types of trading orders.
Orders in MetaTrader will be filled at the nearest market price. Sometimes, this price
may be different (either higher or lower) than the price you requested. This price
difference is called slippage. Slippage is possible on all orders.
From the New Order window, you can choose to place the following orders:
Market Order – Places a buy or sell order on an instrument at the current market price.
Pending Order – Enters your order when the market reaches a specific price.
There is a difference between orders and positions. All trades are placed as orders.
When the price of the order meets the market price, it becomes an actively traded
position. You can modify and cancel orders, but you can only close positions.
When you select Pending Order in the New Order window or the Order Type drop-down menu in
the Mini Terminal or Trade Terminal window, you can choose these types of orders:
•
Buy Limit – Places a buy order at a specific ask price. When you place a buy limit, the price
should be below the current market price.
•
Sell Limit – Places a sell order at a specific bid price. When you place a sell limit, the price
should be above the current market price.
•
Buy Stop – Places a buy order at a particular ask price. When you place a buy stop, the price
should be above the current market price.
•
Sell Stop – Places a sell order at a particular bid price. When you place a sell stop, the price
should be below the current market price.
Take-profit – Places an order to exit an active position to capture any existing profits that you may
have.
Stop-loss – Places an order to exit an active position to minimise any current losses that you may
have.
Trailing Stop Orders – Places a stop order at a specific number of pips away from the current
market price. Once the market moves in your favour by that number, that Stop-loss order will then
automatically update as long as the market moves your way so that it trails the current price by the
number of points you set. When the market moves against your position after the trailing Stop-loss
has been set, the Stop-loss remains set at the last trailing price that it reached when the market was
moving in your favour. You can use the trailing stop to help protect profits without limiting any
potential gains on your open positions.
21
In MetaTrader 4, trailing stops will run as long as you are logged into the platform.
If you set a trailing stop and then log out of MetaTrader before the market moves in
your favour by the number of points that you entered, then the trailing stop-loss order
will not be placed.
If you set a trailing stop and log out of MetaTrader after the market moves in your
favour, triggering the trailing stop, the stop-loss order will not trail the market. It will
work as a hard stop at the last price that the stop-loss was at when you logged off.
When you log into MetaTrader 4 again, if the stop-loss hasn’t been triggered, it will
resume trailing the current market price by the number of points that you specified
between the stop and the current price.
In the Mini Terminal window, you can also select Order-cancels-order (OCO) order types. An OCO
allows you to set both a stop and a limit order. When market movements cause either order to be
filled, the unfilled order is automatically cancelled. You can set two different OCO order types and
enter the specific price or a value in pips.
OCO Breakout – Helps you place a Buy Stop and a Sell Stop. You would typically use this when
you expect a major price movement, but you don’t know whether the move will be a rise or a fall.
OCO Reversion – Helps you place a Buy Limit and a Sell Limit. You would typically use this if you
expect a move in either direction followed by a return towards the current price.
In the Trade Terminal window, you can also group pending orders into an Order-Cancels-Another
(OCA) order. In this grouping, when one order is filled, all of the remaining orders are deleted.
If you place an OCA order and you do not have a Virtual Private Server (VPN)
subscription, your OCA will stop running when you close MetaTrader.
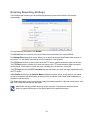
Viewing Pricing Information
Before you place an order, you’ll want to monitor the price and determine a good point to enter the
market. You’ll also want to pick points for your take profit or stop loss orders.
22
You can monitor the real-time bid and ask prices of the available instruments in the Market Watch
quote board.
In addition to the Market Watch quote board, you can also view the Popup Prices window, which
displays a list of symbols and prices. You can view this by right-clicking in Market Watch and
selecting Popup Prices.
If you right-click on the Popup Prices window, you can choose how you want the window to appear
on screen. Always on Top displays the Popup Prices window on top of other applications. Full
Screen expands the window so it fits your entire computer monitor. When selected, a checkmark
appears next to the menu option in the drop-down menu. You can deactivate the option by
unchecking the menu option.
23
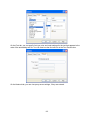
Before you trade, you may want to see the spread, margin, size and other details about the
instrument that you are interested in trading. You can view contract information by right-clicking in the
Market Watch quote board and selecting Symbols. When the Symbols window appears, select the
instrument you want and click Properties. This opens the Contract Specification window for the
instrument you selected.
You can view real-time prices and the current market direction of a specific instrument when you add
the Mini Terminal to a chart window.
You can also compare prices in the Market Watch window of the Trade Terminal.
24
Placing Orders with Mini Terminal
When the Mini Terminal is added to a chart, you can use it to place one-click buy and sell orders.
For an overview of the Mini Terminal window, see Displaying the Mini Terminal in
Section 1: Opening MetaTrader for the First Time.
You can use a number of features in the Mini Terminal window to place trades.
shows the number of positions open for the selected instrument. You can close all open
positions for the selected instrument at once by clicking the number.
opens the Tasks and Settings menu. You can use options in this menu to specify settings,
undock the chart or Mini Terminal window from MetaTrader, and view the number of automatic tasks
that are active in the window.
displays the New Order window. You can use this to place more complex orders as you trade.
You can also save your order settings as a template for future orders.
The Status Indicator section displays the options for placing your trade. You can set the size of the
trade as well as specify settings for stops or limits associated with the market order.
Lots sets the size of your trade. You can enter a number or use
to change the size.
When setting an associated stop or limit, you can choose any combination of these three fields.
S/L – Stop-loss (or a stop)
T/S – Trailing stop
T/P – Take-profit (or a limit)
In these fields, you can enter in a number in pips or if you need help determining the best value, click
CTRL and click the field to access the Calculator tool.
25
For more information about using the Calculator tool, see Calculating Stops or Limits.
You can also place stop or limit orders to enter the market. See Placing Pending Orders with Mini
Terminal for more information.
Prices appear in real-time in the Mini Terminal. The current sell price appears in red. The current buy
price appears in green. The spread appears between the two buttons.
Placing a Market Order in the Mini Terminal Window:
1. Make sure the Mini Terminal is displayed and Expert Advisors is on.
2. If desired, change the size of the order.
3. If desired, enter the number of pips to set your stop or limit in the appropriate field.
4. Click Sell or Buy.
5. Click Yes or No to confirm the order.
Once your order is placed, MetaTrader shows a dotted line in the chart for each order placed and
markers showing where orders were opened and closed.
Placing Orders in the Trade Terminal
You can place orders from several places in the Trade Terminal.
26
For an overview of the Trade Terminal, see Trade Terminal in Section 1: Opening
MetaTrader for the First Time.
The Market Watch window contains several Mini Terminals which display current prices and market
direction. You can use features in each Mini Terminal window to place trades.
shows the number of positions open for the selected instrument. You can close all open
positions for the selected instrument at once by clicking the number.
displays a drop-down menu with several commands.
New Order opens the New Order window where you can place more complex orders as you
trade. You can also save your order settings as a template for future orders.
Template displays a list of all saved order templates. You can also click Manage
Templates… from this menu to delete templates.
Close Position closes all orders for the selected instrument.
Symbol Information displays size, value, and other information about the selected symbol.
New Chart opens a new one hour chart of the selected instrument.
27
For more information on templates, see Saving Orders as a Template.
The Status Indicator section displays the options for placing a one-click trade. You can set the size of
the trade as well as specify settings for stops or limits associated with the market order.
Lots sets the size of your trade. You can enter a number or use
change the size.
When setting an associated stop or limit, you can choose any combination of these three fields.
S/L – Stop-loss (or a stop)
T/S – Trailing stop
T/P – Take-profit (or a limit)
In these fields, you can enter a number in pips or if you need help determining the best value, click
CTRL and click the field to access the Calculator tool.
For more information about using the Calculator tool, see Calculating Stops or Limits.
You can also place stop or limit orders to enter the market. See Placing Pending Orders
with Mini Terminal for more information.
Prices appear in real-time in the Market Watch window. The current sell price appears in red. The
current buy price appears in green. The spread appears between the two buttons.
Placing a Market Order in the Trade Terminal:
1. Make sure the Trade Terminal is open and Expert Advisors is on.
2. In the Mini Terminal of the instrument you want, change the size of the order.
3. If desired, enter the number of pips to set your stop or limit in the S/L or T/P fields.
4. If desired, enter the number of pips to set your trailing stop in the T/S field.
5. Click Sell or Buy.
6. Click Yes or No to confirm the order.
28
Once your order is placed, MT4 shows a dotted line in the chart for each order placed and markers
showing where orders were opened and closed.
Calculating Stops or Limits
When you need help calculating where you want to place your stops or limits in the Mini Terminal in
the chart or in the Trade Terminal, press CTRL and click the stop or limit field you want, which will
open the Calculation window.
You can choose one of three methods to calculate a stop and/or limit for your trade.
•
Fixed Cash allows you to enter how much money you want to risk.
•
% of Equity allows you to enter a percentage of your account equity.
•
% of Balance allows you to enter a percentage of your account balance.
Select an option and enter a number in the appropriate field. Once MetaTrader calculates the values,
they appear below the entry field.
You can click Set… to add the calculation value to the Mini Terminal. To cancel, click × in the
window.
29
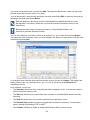
Placing Orders in the New Order Window
You can use more in-depth order types by opening the New Order window.
You can open the New Order window by:
•
Clicking
in the Mini Terminal.
•
Clicking
in the terminals in the Trade Terminal window and selecting New Order.
You can use the drop-down menus in the New Order window to specify your trade. What menus you
see will depend on what you select when you click Order Type. Most order types (except Buy and
Sell) require you to set your entry as either a specific price or as a set value in pips away from the
current price.
Whatever order type you choose, you can also set a stop-loss, take-profit, or trailing stop order to
protect your order.
If you set a stop-loss or take-profit order, you can choose between setting your stops and limits at a
set value in pips, a fixed price, a fixed risk, a percentage of equity, or a percentage of balance.
Placing Orders:
1. Make sure either the Mini Terminal or Trader Terminal is displayed and Expert Advisors is on.
2. Click
. If you’re using Trade Terminal, select New Order. The New Order window opens.
3. Select the order you want from the Order Type drop-down menu.
4. For any order type (except Buy or Sell), enter the entry price you want in either the Price or Pips
fields.
30
5. Enter a number in the Size field or use the drop-down menu to select a way to determine size
and then enter in a number in the Size field.
6. If desired, set a stop-loss and/or take-profit order by choosing a set option from the drop-down
menu. You can then enter the pips, price, or percentage that you want.
7. If desired, set a trailing stop by choosing Pips from the Trailing Stop drop-down menu and
entering the number of pips to set your stop.
8. If desired, click
to expand the Order Comment section and enter a message in the
Comment field.
9. When done, click Place Order.
Saving Orders as a Template
If you plan on frequently placing a particular order, you can save your order settings by clicking Save
Template.
The Save Template button appears:
•
After you click
in the Mini Terminal.
•
After you click
in the terminals in the Trade Terminal window and select New Order.
Both of these buttons open the New Order window. After you enter the order settings, you can click
Save Template. An additional field appears and you can enter a new name for the template. When
done, click Save. You can then click Place Order to enter the order.
31
Once saved, you can access the template from the Mini Terminal by clicking CTRL as you select
A drop-down menu appears with the templates in it.
You can also click
in the Trade Terminal window and select Template to open a drop-down
menu where you can select the template you want.
You can delete a template at by accessing the Manage Templates window. You can access it:
•
From the Mini Terminal, click CTRL as you select
click
•
Click
. In the drop-down menu that appears,
.
From the Trade Terminal window, click
Templates…
, selecting Template, and clicking Manage
next to the template to delete it.
32
.
Opening the Order Window
You can place manual orders using the Order window.
There are several ways to open the Order window:
•
Select New Order from the Tools menu.
•
Click
•
Double-click on an instrument in the Market Watch quote board.
•
Right-click on a position in the Terminal window and select New Order from the drop-down menu.
in the Standard toolbar.
Once open, you can use the following features to specify your trade:
A. Chart – View the current by-tick price movements of the instrument. The blue line represents
the current ask price and the red shows the current bid price.
B. Symbol – Select an instrument to trade.
C. Volume – Specify the number of lots you want to trade.
D. Type – Choose whether your order is a market order or a pending order.
In MetaTrader, 1.0 equals 100,000 units and .10 equals 10,000 units.
33
Placing Market Orders in the Order Window
When you first open the Order window, the Type menu is set to Market Execution so you can place
market orders.
The Market Execution section displays the current price and options for placing your trade.
If the market is particularly volatile, it may take a few seconds to process your order. MetaTrader
displays a pending message, a progress bar to show you how much further the trade has to process
and a Cancel Order button, if you no longer want to place the order.
Once the order is processed, the Order Execution section appears in the Order window. This displays
a confirmation message, informing you that your trade was successful. From this message, you can
print out the order information by clicking Print or close the window by clicking OK.
Placing a Market Order:
1. Double-click an instrument in the Market Watch quote board.
2. Make sure the instrument you want is selected. Click the Symbol drop-down menu to select an
instrument, if not.
3. Click Volume drop-down menu to select the number of lots you want to trade.
4. Make sure Market Execution is selected in the Type drop-down menu.
5. If desired, enter text in the Comment text box.
6. Click either the Sell by Market or Buy by Market button.
7. Click Print to print the order information, if desired.
8. Click OK to close the window.
While you can open the Order window a number of different ways, our examples access
the Order window by double-clicking in the Market Watch quote board.
34
Placing Pending Orders in the Order Window
You can also place pending orders; these enter your order when the market reaches a specific price.
The Order window displays some of the same fields as it does when you enter a market order. When
you select Pending Order from the Type menu, a new section, Pending Order, appears. You can
select what kind of pending order you want, the price and the expiration date of the trade.
If you are using a pending order to enter the market, you can enter a specific price in the At Price
text box.
You can specify how long you want your pending order to be available by using the Expiry checkbox.
After you click the checkbox, you can select a specific expiration date and time.
Selecting Pending Order also opens the Stop Loss and Take Profit text boxes. If desired, you can
set the prices you want for these orders.
If you place a stop loss or take profit order, the chart in the Order window displays a line representing
these pending orders.
If you enter an inappropriate price for either the Stop Loss or Take Profit text boxes and click Place
to enter your order, MetaTrader displays a notification message. If you are entering both types of
pending orders, MetaTrader lets you know if the stop loss (SL) or take profit (TP) is wrong. Click OK
and then adjust the price.
Placing a Pending Order:
1. Double-click an instrument in the Market Watch quote board.
2. Make sure the instrument you want is selected. Click the Symbol drop-down menu to select an
instrument, if not.
3. Click Volume drop-down menu to select the number of lots you want to trade.
4. Click Type and select Pending Order.
5. In the Pending Order section, select one of the pending order types from the Type drop-down
menu.
6. Enter the price.
35
7. Click the Expiry checkbox and select a date.
8. If desired, enter a price in the Stop Loss or Take Profit text boxes.
9. Click Place.
10. Click Print to print the order information, if desired.
11. Click OK to close the window.
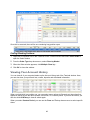
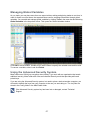
Managing Orders in the Trade Terminal
You can view your open positions and pending orders in the Open and Pending Orders section of the
Trade Terminal.
You can also view open positions and pending orders on the Trade tab of the Terminal
window. Which one you choose is a matter of personal preference. For more information, see
Managing Orders in the Terminal Window.
The Open and Pending Orders section contains tools to help you monitor and manage your open
positions and pending orders.
Close displays a menu with different options for closing positions and deleting pending orders. You
can choose to close all positions at once or specific positions by type.
Tools features a menu with different options for placing and managing one-click stop and limit
orders. You can even close orders or place partial close orders.
You need to select an order row to view the Selected Orders menu options.
OCA creates an order-cancels-all group with at least two selected pending orders. You can also use
this to cancel an order-cancels-all group of pending orders as well.
36
Summary allows you to group your orders by symbol, direction, duration, or other information. When
you make a selection, MetaTrader displays the list of orders in a separate window, along with
information about profit, pips, and volume.
MT4i Live allows you to login to MT4 Live and publish your trading history to their website.
Settings contains two commands: Confirmations and Preferences is where you specify
confirmations for quick buy/sell and close all. Checking Undock Terminal moves the Trade Terminal
outside the MetaTrader workspace.
You can also access commands for a particular order in its row. Each row has a
use to close the position and its related orders instantly.
Each row also has
autotrading action.
. This changes to
that you can
to show that the Trade Terminal is carrying out an
Managing Orders in the Terminal Window
You can view your open positions and pending orders as well as your closed trades on two tabs in
the Terminal window.
You can also view open positions and pending orders in the Open and Pending Orders
section of the Trade Terminal. Which one you choose is a matter of personal
preference. For more information, see Managing Orders in the Trade Terminal.
You can manage all of your open positions and pending orders in the Trade tab of the Terminal
window. You can also view your balance, equity and margin data in this tab.
When you right-click in a position row, you can select menu options to open an order, modify or
delete an order or close an order.
You can also right-click in the tab and select menu options to add the Commissions, Taxes and
Comments columns to the table. You can also choose to display the value in the Profit column in
points, term currency or deposit currency.
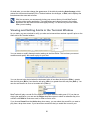
Setting Stops and Limits in the Trade Terminal
You can add stops and limits to all or individual orders and positions in the Open and Pending Orders
window. When you click Tools, you can choose All Orders, or when you have orders and positions
already selected, Selected Orders.
37
To select an order or position, click its row. To select a series of rows, press the SHIFT
key and click the first and last rows. To select several rows not in a series, press the
CTRL key and click in the rows that you want.
You can then select the type of order you want.
•
Close immediately cancels the order or exits the position.
•
Partial Close allows you to select a percentage that MetaTrader will use to close your position.
Partial Close depends on the lot size on your account and MetaTrader will automatically
round down to the nearest lot size permitted.
•
S/L and T/P allow you to select a pip value away from your entry price for your stop or limit. You
can also choose:
o
Break-even places the value for your stop or limit at the selected position’s entry price.
o
Fixed Price opens a window where you can specify a price.
o
None removes an existing stop or limit from an order or position.
•
Trailing Stop allows you to select a pip value for the stop to trail your order. You can also select
None to remove the trailing stop from the position.
•
Break-even Exit places an order based on the set up of your trade at the selected position’s
entry price. Traders use Break-even Exit if they have a losing position and want to close the
position at the entry price.
•
Automated Close allows you to define rules for exiting an open position. You can place multiple
stop or limit orders to scale out of a position. You can then save these rules as templates to reuse
in the future.
If you place a trailing stop or automated close and you do not have a Virtual Private
Server (VPN) subscription, these orders will stop running when you close MetaTrader.
For more information about using Automated Close, see Setting Up an Automated Close.
38
You can also access these menu options when you click
in a specific row. If the order or position
has automated tasks associated with it, this
appears in the row and when you click it, an
additional option called Tasks in Progress appears. This opens the Automated Tasks in Progress
window, where you can view which automated tasks are linked to the trade.
Setting Stops and Limits in the Terminal Window
Once your order becomes a position, you can view it on the Trade tab in the Terminal window. If you
didn’t specify a stop-loss or take-profit order when you first placed your order, you can add those
orders by right-clicking in a position row and selecting Modify or Delete Order to open the Order
window.
You can see if a position has a stop-loss or take-profit order associated with it by looking at the Stop
Loss (S/L) or Take Profit (T/P) columns in the Trade tab of the Terminal window. In the Order
window, the Stop Loss and Take Profit text boxes will display zeroes if no orders were placed when
the original order for the positions was placed.
When you open the Order window from the Trade tab, it displays the Modify Order menu option in
the Type drop-down menu and appears already set with details about the position’s original order.
You can specify information about your stop-loss or take-profit orders in the Modify Order section.
You can click the Level text box and enter in a new number. When you enter a number of points, you
can view what the price would be in the Copy As buttons. If this price seems right, click Copy As to
have the price appear in the Stop Loss or Take Profit text boxes.
If you enter an inappropriate price for either the Stop Loss or Take Profit text boxes, MetaTrader
disables the Modify… button in the window. You need to correct the prices to enable this.
Protecting a Position with Stop Loss and Take Profit Orders:
1. Right-click in a position row in the Trade tab of the Terminal window and select Modify or Delete
Order to open the Order window.
2. Make sure Modify Order is selected in the Type drop-down menu.
3. In the Modify Order section, enter the number of points in the Level text boxes.
39
4. Click the Copy As button above the Stop Loss or Take Profit text box.
5. If you want to add both a stop loss and take profit order to the position, repeat steps 3 and 4 for
the other order.
6. Click Modify…
7. Click Print to print the order information, if desired.
8. Click OK to close the window.
Modifying Orders in the Terminal Window
If you’ve already placed a stop-loss and take-profit order or you have a pending order, you can
manually modify these by right-clicking an order in the Trade tab of the Terminal window and
selecting Modify or Delete Orders.
When you modify a pending order, the Symbol, Volume and other text boxes are greyed out. You
cannot edit these.
Modifying Pending Orders:
1. Right-click in a position row and select Modify or Delete Orders to open the Order window.
2. From the Type drop-down menu, select Modify Order.
3. Change the price in the Stop Loss or Take Profit text boxes, if desired.
4. Click Modify…
5. Click Print to print the order information, if desired.
6. Click OK to close the window.
40
Deleting Orders in the Terminal Window
If market conditions change and you don’t want your pending orders to become positions, you can
manually delete your order by right-clicking an order in the Trade tab of the Terminal window and
selecting Modify or Delete Orders.
Deleting Pending Orders:
1. Right-click in a position row and select Modify or Delete Orders to open the Order window.
2. Click Delete.
3. Click Print to print the order information, if desired.
Click OK to close the window.
Placing a Trailing Stop
On the Trade tab of the Terminal window, you can modify or close your pending orders by rightclicking on an order row and selecting the menu option you want. One way to modify your order is to
add a trailing stop.
In MetaTrader 4, trailing stops will only run when you are logged into the platform. For
more information on how trailing stops work, see Available Order Types in MetaTrader.
41
One way to place a trailing stop is to right-click in a position row and select Trailing Stop. This
displays a drop-down menu where you can select the number of points you want (10 points = one
pip).
Once active, the trailing stop appears in the S/L column of the Trade tab.
The Trailing Stop drop-down menu also contains the Custom… menu option. When you select this,
you can enter a specific number of points in the Custom window.
If you place a trailing stop and eventually want to remove it, you can right-click on your order, select
Trailing Stop and click None.
You can also remove all trailing stops from your open positions by selecting Delete All in the Trailing
Stop drop-down menu.
When you set a trailing stop, your stop needs to be more than 15 points away from the
current price.
Placing a Custom Trailing Stop:
1. Right-click in a position row in the Trade tab of the Terminal window and select Trailing Stop.
2. In the drop-down menu that appears, select Custom…
3. Enter number of points you want.
4. Click OK.
You can also set trailing stops from several other places in MetaTrader.
You can enter trailing stops in pips as you place orders from the Mini Terminal or the
42
Market Watch window in the Trade Terminal. See Placing Orders in the Min Terminal or
Placing Orders in the Trade Terminal.
You can also enter them when you open the New Order window. See Placing Orders in
the New Order Window.
You can also set trailing stops from the Tools drop-down menu from the Open and
Pending Orders window. See Setting Stops and Limits in the Trade Terminal.
Managing Order-Cancels-Another (OCA) Orders
In the Trade Terminal window, you can group pending orders into an Order-Cancels-Another (OCA)
order. In this grouping, when one order is filled, all of the remaining orders are deleted.
If you place an OCA order and you do not have a Virtual Private Server (VPN)
subscription, your OCA will stop running when you close MetaTrader.
To create an OCA group, you’ll need to have at least two pending orders. A single order can belong
to multiple OCA groups, and orders in a group can be for different symbols.
Creating an OCA group:
1. Make sure the Trade Terminal is open.
2. Make sure there are two pending orders in the Open and Pending Orders section.
3. Select the two pending orders.
4. Click OCA.
5. Select Create OCA Group. The Create OCA Group window opens.
6. Enter a name for the OCA group.
7. Check the pending orders that you want in the table.
8. Click Create OCA Group.
If you need to cancel the OCA group, you can click OCA and select Delete OCA Group.
Cancelling the OCA group only stops the Trade Terminal from running the OCA rule on
those orders. Pending orders will not be deleted.
43
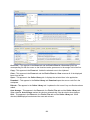
Setting Up an Automated Close
With an Automated Close, you can place conditional stop and limit orders for exiting an open
position. You can then save the templates you create to reuse in the future.
If you place an automated close and you do not have a Virtual Private Server (VPN)
subscription, your order will stop running when you close MetaTrader.
You can access Automated Close from the Open and Pending Order window of the Trade Terminal.
Click Tools and then select either of the All Orders and Selected Orders menus. You can also
select Automated Close for a specific order or position by clicking
in the row.
When you click Create…, the Automated Close window appears. This displays one condition box.
At the top of the condition box, you can specify the automated trigger. You can select from the three
drop-down menus that define the first condition of the automated close:
•
The Condition drop-down menu is where you can select what event starts the automated close.
Your condition can centre on a net profit, profit and loss, or how long you’ve had the trade open.
•
The Threshold drop-down menu is where you can specify if the condition is greater than or equal
to or lesser than or equal to.
•
The Size field is where you can enter a pip or minutes value, depending on the menu item you
selected in the Condition drop-down menu.
You can then select one or more of the checkboxes in the Action area to tell MetaTrader what you
want to do when the condition is met.
44
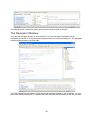
If you want to add more rules to the Automated Close, you can click Add a Rule to open a second
condition box. If you want to remove a condition box, click
.
You can also modify existing templates to create new ones. Click Load Template at the
top of the window and then make the changes as desired.
When done, click Save Template. An additional field appears and you can enter a new name for the
template.
Click Save and then you can then click Apply Rules to activate the rule.
Once saved, you can select the template you want by navigating to the Automated Close and
selected the template you want.
When you need to delete a template, you can also select Manage Templates… from the Automated
Close menu.
A window opens with a list of templates. Click
next to the template to delete it.
Setting Up an Automated Close:
1. Make sure the Trade Terminal is displayed and Expert Advisors is on.
2. In the Open and Pending Orders window, click the order you want.
3. Click
. Then selected Automated Close and Create...
4. Select the condition from the Condition drop-down menu.
5. Select the item from the Threshold drop-down menu.
6. Enter a number in the Size field.
7. Check one or more of the checkboxes in the Action area and enter either a value or text in the
field.
8. Click Save Template.
9. Enter a new name for the template.
10. Click Save.
45
11. If desired, click Apply Rules to activate the rule.
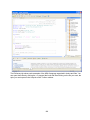
Applying a Partial Close
If you are trading multiple lots, you can add Partial Close to a chart to scale out or close parts of your
position. Partial Close appears in the Expert Advisors section of the Navigator window as Order
Partial Close.
For more information on expert advisors, see Attaching an Expert Advisor to a Chart in
Section 5: Using MetaTrader’s Autotrading Tools.
Before you add it to the chart window, you’ll need to have a position in the same instrument as the
chart with multiple lots. You also need to enter the order number of the position in the Value column
next to the Order Number row on the Inputs tab.
You can specify the targets for when you want the positions to close in the Profit Targets row. When
you first open the window, three targets are set at ten, twenty, and thirty pips. You can change these
to any level or enter in more or fewer targets.
You can then set the percentage of the total order that you want to close each of these targets at in
the Partial Close row.
You can also add trailing stops to each of the targets in the Trailing Stops row. You can enter the
value the stop should trail the target in pips.
46
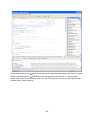
The number of percentages and trailing stops that you have should always be equal to
the number of targets. The final percentage in the Partial Close row should be 100 if
you want to close out your position entirely. If you want to not have a trailing stop on a
particular target in the sequence, you’ll need to enter a zero for that particular target.
Once set, you can view the settings for the partial close in the upper left corner of the screen. If you
don’t want to see the settings on the chart, you can change the Display Info field to false.
Applying a Partial Close:
1. Right-click Order Partial Close in the Navigator window and select Attach to a Chart.
2. Make sure everything you want is checked on the Common tab.
3. Click the Inputs tab.
4. For the Order Number variable, double-click in the row in the Value column and enter the
position with multiple lots.
5. For the Profit Targets variable, double-click in the Value column and enter the number of targets
that you want.
6. For the Partial Close variable, double-click in the Value column and enter in the percentages of
how you want the target to close.
7. If desired, set Trailing Stops for each target by double-clicking in the Value column and entering
the stop value.
8. When done, click OK.
You can save the settings for a partial close as an expert set by clicking Save. This
allows you to name and save the set to your computer. When you want to reload the
settings, click Load and you can navigate to the folder where the set is.
Closing Positions in the Terminal Window
When you need to close a position at the current market price, you can right-click in a position row in
the Terminal window and select Close Order.
The Order window appears with a Close… button that displays the instrument, volume and order
number.
47
Closing a Position at the Current Market Price:
1. Right-click in a position row in the Trade tab of the Terminal window and select Close Order to
open the Order window.
2. When the Order window appears, click Close… by Market.
3. Click Print to print the order information, if desired.
4. Click OK to close the window.
You can also double-click on the position row you want to open the Order window.
You can also reverse your position by clicking the Sell by Market or Buy by Market
buttons.
Closing Offsetting Positions
If you have two offset positions in the same currency pair in the same size, you can use the Multiple
Close By menu option to close out opposing positions for the currency pair selected.
For example, let’s say you have two long EUR/USD positions and one short EUR/USD position in
MetaTrader 4.
You can use Multiple Close By to close the offset positions.
48
Once this is executed, there will be one remaining long position open.
Closing Offsetting Positions:
1. Right-click in a position row in the Trade tab of the Terminal window and select Close Order to
open the Order window.
2. From the Order Type drop-down menu, select Close by Market.
3. When the Order window appears, click Multiple Close by….
4. Click OK to close the window.
Viewing Your Account History
You can view all of your executed trades on the Account History tab of the Terminal window. Here,
you can also view your profit and loss, credits, deposits and withdrawal information.
When you right-click in a position row, you can select menu options to filter and sort the orders that
appear in the tab by the last three months, last month, or a custom period. If you sort the orders, you
can also click All History to view all orders again.
When you select Custom Period, you can use the From and To drop-down menus to select specific
dates.
49
On both tabs, you can also change the appearance of the table by selecting Auto Arrange, which
resizes the columns automatically if the Terminal window size changes, or Grid, which displays the
lines between the rows and columns.
With live accounts, we recommend viewing your account history in both MetaTrader 4
and the online trading application. The transactions and values you see in the trading
application are the most accurate and legally-binding. You should rely on these values
when you are trading.
Viewing and Setting Alerts in the Terminal Window
As you trade, you can set alerts to notify you when an instrument has reached a specific price on the
Alerts tab in the Terminal window.
You can create or modify these price alert settings in the Alert Editor. This is where you can set
conditions and specify the sound to play for your alert.
You can choose to be alerted when the instrument price is less than the bid price (Bid >), greater
than the bid price (Bid <), less than the ask price (Ask >) or greater than the ask price (Ask <). You
can also set the alert to occur at a certain time (Time =).
MetaTrader will play a sound file if the application is open when the alert goes off. If you plan on
closing the application, you can use the Action drop-down menu to select an alternate way to be
notified: select Mail to receive an email, or File to receive a file.
If you choose Sound from the Action drop-down menu, you can select the sound file you want to
play from a drop-down menu. If you have other sound files that you would like to use on your
50
computer, you can click
. This opens the Open window and you can navigate to the folder where
your sound files are stored. When you find one, click on it and select Open.
To see what the alert would sound like, you can click Test in the Alarm Editor window.
If the alert is designed to hit a price and the market bounces around that price, your alert may go off
more than once. You can use the Timeout drop-down menu to set a period of time between when
the alert goes off and when it can go again.
You can use the Maximum Iterations drop-down menu to choose to have the alert sound between
one and 1000 times.
MetaTrader will send an alert to your email when your address is setup in the Email tab
of the Options window. See Entering Email and Server Settings in Section 7:
Customising the Appearance and Settings in MetaTrader for more information.
Creating an Alarm:
1. Right-click on the Alerts tab in the Terminal window and select Create.
2. To begin entering information in the Alert Editor, click Enable On/Off.
3. Click the Action drop-down menu and select Sound, File or Mail.
4. Make sure the instrument you want is selected. Click the Symbol drop-down menu to select an
instrument, if not.
5. Click the Condition drop-down menu and select Bid >, Bid <, Ask >, Ask < or Time = and enter
a value.
6. Click the Source drop-down menu and select an alert. If you selected Sound, you can also click
, select the file you want and click Open, if desired.
7. If desired, click the Timeout drop-down menu and select a time.
8. If desired, click the Maximum Iteration and select a number.
9. Click OK.
When an alert is set, it appears in the Alerts tab. You can see how many times the alert has sounded
in the Counter column.
Once you’ve created an alert, you can right-click in the chart window and access other menu options.
•
Modify reopens the alert in Alert Editor so you can edit it.
•
Delete immediately removes the alert from the chart and the Terminal tab.
51
•
Enable On/Off allows you to turn the alert on or off. When enabled, the alert will display this icon
in its row. When disabled, it will display this icon
.
Setting Account Alarms (Trade Terminal)
You can set an alarm to notify you when the account balances listed in the Account Info section of
the Trade Terminal rise or fall. When they do, you can choose to have MetaTrader close any open
positions that you have or stop expert advisors from placing trades.
When you click
, you can view the Alarm window.
52
When you click
, you are placing an alarm on that account detail. If you clicked the wrong
account detail, you can click the Alarm on Item drop-down menu to select another one.
In the Level for Alarm section, you can choose a threshold option from the drop-down menu. You
can choose from four options: less or equal to, greater or equal to, not exactly equal to, or not equal
to. Then, you can enter the number you want.
Alarms turn off when they are triggered, but you can use the Repeat drop-down menu to set a
timeframe for how often they repeat.
Alarms also display a pop-up window in MetaTrader when they are triggered. You can also have an
email sent to you if you check Send Email.
MetaTrader will send an alert to your email when your address is setup in the Email tab
of the Options window. See Entering Email and Server Settings in Section 7:
Customizing the Appearance and Settings in MetaTrader for more information.
When an alarm is triggered, you can set MetaTrader to:
•
Close All Orders. When the alarm is triggered and this option is selected, MetaTrader tries to
close all open positions and delete all pending orders.
•
Close All Charts. When the alarm is triggered and this option is selected, MetaTrader tries to
close all charts other than the Trade Terminal. Closing the chart prevents autotrading tools on
other charts from placing any further trades.
When an alarm is set, the icon is
. When the alarm is triggered, the icon is
.
Setting Account Alarms from the Trade Terminal:
1. Make sure the Trade Terminal is open.
2. In the Account Info section, click
next to the account detail.
3. Select whether you want the value of the selected information to be higher or lower than a certain
point.
4. Specify how often the alarm repeats by selecting a time frame in the Repeat section.
5. If your email settings are configured, check Send Email.
6. If desired, select Close All Orders or Close All Charts.
7. When done, click Save.
If you need to disable an account alarm, you can click
and click Turn Off.
53
to open the Alarm window
Section 3: Using the Chart Tools
As you trade, you’ll discover that the chart window is essential for monitoring your trades, performing
technical analysis and running expert advisors, custom indicators, scripts and other autotrading files.
In this section, you’ll learn more about the chart window and the features you can use in it.
Opening Charts
In Section 1, you learned that the chart window plots the real-time prices of an instrument on a graph
and provides a snapshot of market movements over a particular period of time.
There are several ways to open the chart window.
•
Right-click an instrument in the Market Watch quote board and select Chart Window.
•
Click an instrument in the Market Watch quote board and drag it into the MetaTrader main
window area.
•
Click New Chart in the File menu and select the instrument you want.
•
Click New Window in the Window menu and select the instrument you want.
•
Click the Chart Window button in certain windows.
•
Click
in the Chart toolbar.
54
You can open up to 99 charts at one time and switch between them by clicking on the instrument
chart tab at the bottom of the chart window.
When you open a chart, MetaTrader displays the available price history for that chart. The amount of
time shown depends on the time frame you selected and the settings in the Charts tab. See
Specifying Chart and History Data Properties in Section 7: Customising the Appearance and
Settings in MetaTrader for more information.
Opening Charts Offline
Some traders prefer to open offline charts. These show you the available price history, but do not
update to show the real-time prices of the instrument.
You can open an offline chart by clicking the File menu and selecting Open Offline. This opens the
Open Offline Chart window, where you can view the available instruments and time frames as well as
how many bars, candles or line ticks are available in the chart.
To open one, select the chart you want and click Open.
When the chart opens, you’ll see (Offline) appear in the chart header.
55
Viewing the Chart Window
Once the chart window is open, you’ll notice a few features.
A. The Price section displays the current market prices of the instrument.
B. The legend shows the instrument symbol and current price information.
C. The Time Frame Interval section displays times and/or dates, based on the selected time
frame.
D. The Ask Line shows the current ask price.
When you open a chart window for the first time in MetaTrader, the chart displays the price
movements of the selected instrument as a continuous line, measuring intervals by the minute.
The amount of time shown in the chart depends on the time frame you selected. For example, if you
selected the five-minute time frame on a line chart, you can view the closing price of an instrument for
the five-minute period.
You can scroll back and forth in the chart history by clicking in the chart window and dragging your
cursor to the left or right.
You can also change the scale of the price moves in the chart by clicking the Price section and
dragging up and down or clicking the Time Frame Interval section and dragging left or right.
56
You can change colours, fonts and other settings in the chart. For more information, see
Customising the Appearance of the Chart Window in Section 7: Customising the
Appearance and Settings in MetaTrader.
Displaying the Chart Toolbar
When you first open MetaTrader, you’ll notice the Chart toolbar appears at the top of the window.
You can use these tools to change and manage the way the chart displays pricing information.
If you don’t see the Chart toolbar, you can display it by selecting View, clicking
Toolbars and selecting Charts.
MetaTrader groups the tools on the toolbar by type. The first three buttons on the toolbar specify the
chart type. If you click one, it remains active until you click another chart type button.
•
Bar Chart displays the price moves of the selected instrument as a sequence of bars. Each
bar displays the high, low, open and close of the instrument and represents the trading activity for
the time frame selected in the chart.
•
Candlestick Chart tracks the price moves of the selected instrument as a sequence of blocks
or candles. Each candle displays the high, low, open and close of the instrument and represents
the trading activity for the chart time frame. With candlesticks, you can analyse the market, spot
trends and forecast their direction.
•
Line Chart displays the price moves of the selected instrument as a continuous line. The line
connects the close prices for the time frame selected in the chart.
•
Zoom In magnifies the most recent price moves and displays them on the chart.
•
Zoom Out decreases the magnification of the chart.
•
AutoScroll updates the chart so that it always scrolls to the right to show the latest price
moves.
•
Chart Shift arranges the chart so the latest price moves appear at a certain point in the
chart. When active, you can click the triangular marker at the top of the chart window and set it
anywhere between the right side of the chart and the middle of the chart.
•
Indicators displays a drop-down menu with indicators. You can select between the most
commonly used indicators or click the folder where the indicators are organised by type. When
you select one, MetaTrader opens a window so you can specify settings for the indicator and then
57
view it in or below the chart. For more information on indicators, see Managing Indicators in the
Chart Window in this section.
•
Period displays the selected time frame for the chart. You can also use this to change the
time frame of the chart from one minute (M1) to one hour (H1) to daily.
•
Templates displays a drop-down menu for loading and saving a chart template. With a chart
template, you can save the chart type, time frame, indicators, expert advisors and other settings
and apply it to any chart. For more information on templates, see Managing Templates in the
Chart Window in this section.
You can set the chart to zoom in to a precise point by checking the Scale Fix option in
the Charts Setup window. See Customising Viewing Settings on the Chart Window in
Section 7: Customising the Appearance and Settings in MetaTrader for more
information.
If you are scrolling through the chart and analysing chart history, make sure that
AutoScroll and Chart Shift are deactivated.
Selecting a Chart Type and Time Frame
When you open the chart for the first time in MetaTrader, Bar Chart is selected in the Chart toolbar
and One Hour (H1) selected in the Period
any time.
drop-down menu. You can change both of these at
You can change the chart type by:
•
Clicking one of the buttons in the Chart toolbar to switch between bar, candlestick or line
chart.
•
Clicking Charts in the menu bar and selecting the Bar Chart, Candlesticks or Line Chart
menu options.
58
When you first open MetaTrader, the chart types would look like this:
Bar
Candlestick
Line
You can display more information about the candlesticks in the chart. See Displaying
Detailed Candlesticks in a Chart for more information.
There are several ways to change the time frame in the chart.
•
Click Period
and select a time frame menu option from the drop-down menu.
•
Display the Periodicity menu bar by clicking View, selecting Toolbars and clicking Periodicity.
You can then click the time frame icons.
•
Click Charts in the menu bar and select Periodicity. You can then select the time frame you
want.
•
Right-click in the chart window, select Periodicity and then select the time frame.
59
No matter which method you use, you can select one of the following time frames:
•
1 Minute (M1)
•
5 Minutes (M5)
•
15 Minutes (M15)
•
30 Minutes (M30)
•
1 Hour (H1)
•
4 Hours (H4)
•
Daily (D1)
•
Weekly (W1)
•
Monthly (MN)
60
Switching Between Chart Time Frames and Instruments
with Fast Navigation
You can quickly switch between charts and time frames or scroll to a particular point in time on the
chart using the Fast Navigation text box. You can display this field by double-clicking in the lower left
corner of the chart.
Once open, you can enter a specific time, date, symbol or all of these and press Enter on your
keyboard. You can use the table below to see how to enter times and dates.
[time (hours:minutes)]
example: 08:30; 8:30;
[date]
example: 2004.10.16; 16.10.2004; 16.10.04;
[date and time]
example: 2004.10.16 8:30; 16.10.2004 8:30;
16.10.04 8:30;
[symbol]
example: GBPUSD; EURUSD;
[chart period]
example: M1; M5; M15; M30; H1; H4; D1; W1;
MN;
[symbol], [chart period]
example: GBPUSD, M30; EURUSD, D1;
61
Displaying Other Tools in the Chart Window
After you specify a chart type and time frame, you can set the chart window to display other tools to
help you trade.
Displaying a Grid
When you first open MetaTrader, the chart displays vertical and horizontal grid lines. You can
right-click in the chart window and select Grid from the drop-down menu to activate or
deactivate it.
62
Displaying Trading Volume
You can display the current trading volume for the selected instrument by right-clicking in the
chart window and selecting Volumes from the drop-down menu.
Refreshing the Chart
During volatility, you may need to update the chart window. You can do so by right-clicking in
the chart window and selecting Refresh.
63
Saving as a Picture
You can save the active chart window or workspace as a .gif or .bmp file by right-clicking in
the chart window and selecting Save As Picture... You can also choose the size the active
chart to a specific pixel size.
64
Printing the Chart
You can print the active chart. To preview it before you print, right-click in the chart window
and select Print Preview. When you’re ready to print, right-click in the chart window and
select Print...
You can also access the tools listed here from the Charts or File menu in the menu
bar.
Displaying the Line Studies Toolbar
If you are planning on drawing in the chart window, you may want to display the Line Studies
toolbar. This contains a number of MetaTrader drawing tools.
enables you to click on other drawing objects and drag them to new locations in the chart. This is
active when you first open the chart window.
turns your cursor into a cross when you move around the chart window. When this is selected,
you can find out the distance between the points and the current price value by clicking on a point in
the line and dragging to another point.
65
adds a vertical line on the chart. These can be used to mark the beginning of a trend or specify a
time when you entered the market. When this is selected, click in the chart to place the line.
adds a horizontal line on the chart. These can be used to plot a horizontal support or resistance
level. When this is selected, click in the chart to place the line.
66
plots a diagonal trendline drawn through a series of high or low price points in the chart window.
When this is selected, click where you want your line to begin and drag your cursor to place the line.
You can add multiple trendlines to the chart.
plots two parallel lines that remain equidistant, no matter where you place them in the chart
window. When this is selected, click where you want the channel to begin and drag your cursor to
place it. You can then click on the secondary line and drag it in the chart.
draws six parallel lines at specific distances defined by the Fibonacci sequence (0.618, 1.000,
1.618, 2.618, 4.236). When it is selected, click where you want the channel to begin and drag your
cursor to place it.
67
adds a label to a particular part of the chart. When selected, you can click in the chart window
where the label should be. This opens the Text window with the Common tab displayed. Here, you
can enter a name for the label, add the text you want and change the colour, size or font. You can
also specify where the label should anchor on the Parameters tab or select if the text label should
appear on all chart time frames on the Visualisation tab.
68
adds a comment to the chart window. As you scroll, the comment remains displayed over the
chart. When selected, you can click in the chart window where the comment text should be. This
opens the Label window with the Common tab displayed. Here, you can enter a name for the
comment, add the text you want and change the colour, size or font. You can also specify the time
and the angle of the comment on the Parameters tab or select if the text label should appear on all
chart time frames on the Visualisation tab.
69
displays a drop-down menu, so you can select from eight different types of icons to add to the
chart window. If you add too many of these icons to the window, you select the Delete All Arrows
menu option to remove all icons from the window.
MetaTrader draws all trend lines on the charts as rays, lines which start at one point
and continue in one direction toward infinity. You can change this using the Objects
List. See Configuring Drawings in the Chart in this section for more information.
70
Drawing in the Chart
As you trade, you’ll want to examine the chart, looking for possible patterns and trends in the price
movements. MetaTrader offers a number of drawing tools so you can plot support and resistance
levels, identify simple and complex patterns and create other notations on the chart.
You can select over 30 different tools by clicking on the Insert menu in the menu bar and selecting
the tool you want from the drop-down menu or its related menu.
When you click Lines, you can select from one of four different types of lines to draw on the chart.
Vertical Line places a vertical line in the chart window. When selected, click where you want your
line to be to place it.
Horizontal Line places a horizontal line in the chart window. When selected, click where you want
your line to be to place it.
Trendline allows you to draw a diagonal line through a series of high or low price points in the chart
window. When selected, click where you want your line to begin and drag your cursor to place it.
You can learn more about these three types of lines in the Displaying the Line Studies
Toolbar in this section of the guide.
71
When Trendlines by Angle is selected, click where you want your line to begin and drag your cursor
to place the line on a specific degree.
Remember, you can change MetaTrader settings so all your trendlines have a
beginning and end point using the Objects List. See Configuring Drawings in the Chart
in this section for more information.
Drawing Channels on the Chart
When you click on the Insert menu and select Channels, you can select from one of four different
types of channels to draw.
Fibonacci Channels draws
six parallel lines at specific
distances defined by the
Fibonacci sequence (0.618,
1.000, 1.618, 2.618, 4.236).
When it is selected, click
where you want the
channel to begin and drag
your cursor to place it.
72
Linear Regression is a
statistical analysis tool that
is used for forecasting
future values of an
instrument. When it is
selected, click where you
want the channel to begin
and drag your cursor to
place it.
Equidistant draws two
parallel lines that remain
equidistant, no matter
where you place them.
When it is selected, click
where you want the
channel to begin and drag
your cursor to place it. You
can then click on the
secondary line and drag it
in the chart.
73
Standard Deviation draws
three parallel lines that are
separated by a set
deviation. Once placed, you
can click and drag the
channel along the price
moves and the channel
distance will adjust based
on those prices. When
Standard Deviation is
selected, click where you
want the channel to begin
and drag your cursor to
place it.
You can change the deviation in Standard Deviation lines by double-clicking on the line
and then right-clicking to select StdDev Properties. On the Parameters tab, you can
enter a new value in the Deviations text box.
Drawing with the Gann Tools on the Chart
W. D. Gann considered a 45-degree line to be significant when analysing market moves. Under
certain market conditions, traders could draw a 45-degree line on a chart and forecast that moves
above the line were bullish while those below that line were bearish. If price movements crossed the
line, it indicated that the trend was changing.
When you click on the Insert menu and select Gann, you can select from one of three different types
of Gann tools to add to the chart.
A Gann line is a
trendline drawn at an
angle of 45 degrees.
When Gann Line is
selected, click where
you want the line to
begin.
74
A Gann fan displays a
set of trendlines drawn
from one point at
different angles. When
Gann Fan is selected,
click where you want
to place the fan.
A Gann grid displays a
series of intersecting
45-degree lines. When
Gann Grid is
selected, click where
you want the grid to
begin and drag your
cursor to size the grid.
75
Drawing with the Fibonacci Tools on the Chart
Leonardo Fibonacci discovered a number sequence where each successive number represents a
sum of two preceding ones: 1, 1, 2, 3, 5, 8, 13, 21, 34, 55, 89, 144, etc. Many traders use these
values to forecast points of support or resistance.
When you click on the Insert menu and select Fibonacci, you can select from one of five different
types of Fibonacci tools to add to the chart.
When a severe drop or
rise occurs, you can use
a Fibonacci retracement
to forecast where stops
or losses may be placed.
When Retracement is
selected, click and drag
a line between the
highest and the lowest
price points on the chart.
You can add a Fibonacci
expansion to forecast
where the third wave will
end.
When Expansion is
selected, click and drag
to create a line between
the highest and the
lowest price points on
the chart, just as you did
for the retracement.
When done, a second
trend line will appear.
You can double-click on
the trend lines to adjust
the expansion.
76
A Fibonacci time zone
consists of a series of
vertical lines placed at
Fibonacci intervals from
each other. You can use
Fibonacci Time Zones to
forecast possible times
when the market may
experience a significant
price change. When
Time Zones is selected,
you can create this
drawing object by
clicking and dragging.
A Fibonacci fan displays
a set of trendlines drawn
from one point at
different angles. You can
use this to forecast
support levels for a
possible ascending or
descending trend. When
Fan is selected, click and
drag to create a line
between the high and the
low.
77
You can use Fibonacci
arcs to forecast support
and resistance levels.
When Arcs is selected,
click where you want the
centre of your arc to be
and drag to size the arc.
Adding Shapes to the Charts
When you click on the Insert menu and select Shapes, you can select from one of three different
shapes to add to the chart.
Rectangle draws a
rectangle of any size
on the chart. When
this is selected, click
where you want one of
the corners of the
rectangle to start and
drag to size.
78
Triangle draws a
rectangle of any size
on the chart. When
this is selected, click
where you want the
three corners to be.
Once you place the
third point, the triangle
appears on the
screen.
Ellipse draws an
ellipse of any size on
the chart. When this is
selected, click where
you want the edge of
the ellipse to be.
You can change the colour, line style and other settings of the shapes you draw on the
chart using the Objects List. See Configuring Drawings in the Chart in this section for
more information.
79
When you click on the Insert menu and select Arrows, you can add eight different types of icons to
the chart.
Thumbs Up/Thumbs
Down
Up Arrow/Down Arrow
Stop Sign
Check Sign
Left/Right Price Label
You can also place all of these icons using the drop-down menu in the Line Studies
menu bar. This also contains an option for removing all icons from chart window. See
Displaying the Line Studies Toolbar in this section for more information.
Using the Advanced Drawing Tools in the Charts
The Insert menu also includes four other menu options for adding technical analysis drawing or label
objects to the chart.
Andrew’s Pitchfork is a set
of three trendlines used to
identify lines of support or
resistance. If you suspect
that a channel trend is
forming around price
movements in the chart, you
can use this drawing object
to verify your assumptions.
When Andrew’s Pitchfork is
selected, you can click on a
high or a low to specify the
middle of the pitchfork and
then click two significant
peaks or troughs beside it to
compose the prongs.
80
Cycle Lines are a row of
vertical lines placed at equal
intervals. Usually, one
interval corresponds with one
cycle. When Cycle Lines is
selected, click a point in the
chart window and drag to
adjust the interval.
You can add a label to a
particular part of the chart by
clicking Text Label. As you
scroll, the comment remains
displayed over the chart.
When selected, you can click
in the chart window where
the label should be. The
Label window appears with
the Common tab displayed.
Here, you can enter a name
for the label, add the text you
want and change the colour,
size or font. You can also
specify where the label
should anchor on the
Parameters tab or select if
the text label should appear
on all chart time frames on
the Visualisation tab.
81
You can add a comment to
the chart by clicking Text.
When selected, you can click
in the chart window where
the comment text should be.
The Text window appears
with the Common tab
displayed. Here, you can
enter a name for the
comment, add the text you
want and change the colour,
size or font. You can also
specify the time and the
angle of the comment on the
Parameters tab or select if
the text label should appear
on all chart time frames on
the Visualisation tab.
82
Configuring Drawings in the Chart
After you add a drawing to the chart, you can change its appearance and properties as well as add a
label to it by right-clicking in the chart window and selecting Objects List. This displays the Objects
On… window.
The Objects On… window shows a list of all objects that are currently displayed in the chart window.
It also contains four command buttons.
Objects that are checked are currently selected and can be edited.
Show changes the view of the chart window, so the currently selected object is prominently
displayed.
Delete removes the object from the Objects On… window and the chart window.
Close closes the Objects On… window.
Edit opens an edit window for the currently selected object. This window contains three tabs.
83
The Common tab contains settings for entering the name for the object, adding a description and
changing the colour, line style or other appearance settings of the selected object.
Drawing objects like Rectangle and Ellipse appear filled. If you want to see just the outline of the
shape, uncheck Draw Object as Background.
The Parameters tab is where you can enter specific data on where the object appears in the chart.
The selections available here depend on what the selected object is.
The Time and Value fields enable you to specify where an object is placed on the chart.
You can use the Angle in Degrees field to set the angle of the text or the drawing object.
The Arrow Code field adds an object code when you add an arrow icon to the chart window.
When selected, the Ray checkbox draws all lines on the charts as lines that start at one point and
continue in one direction toward infinity. This is selected when you first open MetaTrader.
The Visualisation tab contains settings so you can specify in which time frames the object will appear
on the chart. When you first draw the object, Show on All Time frames is automatically selected.
Editing Drawings in the Chart:
1. Right-click in the chart window with your drawing objects and select Objects List.
84
2. In the Objects On… window, select the object you want and click Edit.
3. In the Common tab, make sure the name is correct and enter a description, if desired.
4. Use the drop-down menus to specify the colour of the drawing object and the line style.
5. Click on the Parameters tab and make changes as necessary.
6. If you want to specify a time frame, click on the Visualisation tab, uncheck Show On All The
Time frames and check the time frames you want.
7. When done, click OK.
8. Select another object in the Objects On… window to edit, if desired.
9. When done, click Close.
If you don’t want to configure all of the drawings at once, you can also double-click on a
single drawing object in the chart window to select it. Right-click on it and select the
…Properties menu option. This will open the edit window for the currently selected
object.
Grouping Charts with Profiles
MetaTrader allows you to open multiple charts and save them in a profile. Many traders use this to
compare their most commonly traded instruments. You can use the Profiles menu option in the File
menu to save multiple groups of charts.
When you click the File menu and select Profiles, you can:
•
Display one of the existing profiles by selecting its name from the drop-down menu that
appears. When selected, a check appears beside it to show you that it is active.
•
Return to the original profile by choosing Default.
•
Move between profiles by clicking Next or Previous.
85
•
Save several charts already displayed as a set by clicking Save As… Once saved, it appears
in the Profiles drop-down menu with a check beside it to show you that it is active.
•
Delete a profile by clicking Remove and selecting the profile you want from the drop-down
menu.
When you open a profile, each chart window appears with its settings in the same location as it was
when it saved.
Saving a Profile:
1. Click the File menu and select Profiles.
2. When the drop-down menu appears, select Save As…
3. In the Save Profile window, you can type in a new name or select an existing name from the
drop-down menu to save over that profile.
4. Click OK.
If you make a change to the chart windows in a profile, you don’t have to save it. These
are automatically saved in the current profile.
The profiles in the drop-down menu or the Profiles folder on your computer may vary
from the graphic that you see here.
You can also use these commands by clicking
in the Standard toolbar. This
displays a drop-down menu similar to the one that you see when you click the File
menu and select Profiles.
Placing Trades from the Chart
You can place trades from the chart by right-clicking in the window, selecting Trading and then
clicking a menu option from the drop-down menu that appears.
86
New Order
Opens a position in the market at the current price. The Order window opens with a Market
Execution order type selected. You can change the Type drop-down menu and select Pending
Order if you want to place a buy limit or a sell stop.
Buy Limit at.../Sell Stop at...
Places a buy limit or a sell stop at the listed price. The Order window opens with the Pending Order
type selected.
Placing a Market Order from the Chart Window:
1. Right-click in the chart window of the instrument you want, select Trading.
2. From the drop-down menu, click New Order.
3. Click Volume drop-down menu to select the number of lots you want to trade.
4. If desired, enter text in the Comment text box.
5. Click either the Sell by Market or Buy by Market button.
6. Click OK to close the window.
Placing a Pending Order from the Chart Window:
1. Right-click in the chart window of the instrument you want, select Trading.
2. From the drop-down menu, click Buy-Limit at.../Sell Stop at… order.
3. Click Volume drop-down menu to select the number of lots you want to trade.
4. If desired, click the Expiry checkbox and select a date.
5. If desired, enter a price in the Stop Loss or Take Profit text boxes.
6. Click Place.
7. Click OK to close the window.
For more information, see Placing Market Orders in the Order Window or Placing
Pending Orders in the Order Window in Section 2: Opening and Managing Your
Trades.
Managing Technical Indicators in the Chart
Many traders use technical indicators to forecast where the market may be going. In MetaTrader, you
can select up to 30 different technical indicators to appear in the chart.
There are several ways to add an indicator to a chart.
•
Click + next to Indicators in the Navigator window to display the list of indicators. Then click and
drag the indicator to the chart window.
•
Right-click on the indicator you want in the Navigator window and select Attach to a Chart.
87
•
Click the Insert menu and select Indicators. This displays a drop-down menu where the
indicators are organised in folders by type (Trend, Volumes, Oscillator, etc.). You can select the
folder and click on the indicator in it.
•
Click
in the Charts toolbar. This displays a drop-down menu with a list of the most recently
used indicators and then the indicator folders. You can select the indicator you want or click on
the folder and select the indicator.
When you add an indicator to the chart, a settings window for that indicator appears. You can specify
settings for the indicator over several tabs. The ones that you see depend on the indicator you
selected.
88
The Parameters tab is where you can enter specific data on how the indicator appears in the chart.
The selections available here depend on what the indicator is.
On the Colours tab, you can modify the line colours of the indicator by double-clicking on the colour
and selecting a new one from the drop-down menu. Like the Parameters tab, the selections that you
see depend on what the indicator is. You can also specify line width on a scale of one to five by
double-clicking on the Width row and selecting a new one from the drop-down menu that appears. If
you select a line width of one, you can also specify whether the line appears as solid or dotted by
double-clicking on the Style row and selecting a new one from the drop-down menu that appears.
The Levels tab is where you can add level lines to the indicator. You can create a new level by
clicking Add. You can then select the line and use the drop-down menus to change the colour,
thickness and style of the level line. To remove lines, select the line and click Delete.
On the Visualisation tab, you can select in which time frames the indicator can be used. When you
first open MetaTrader, the All Time Frames checkbox is selected. When you uncheck it, you can
select one or more time frames.
If you need to return to the original settings, click Reset.
Indicators will appear either in the chart or in an indicator window below the chart. The name of the
indicator in the separate indicator window appears in the upper left corner of that window.
89
You can add as many indicators to the charts as you would like, but it is advisable to use no more
than five at a time.
Attaching an Indicator to the Chart Window:
1. Right-click on the indicator you want in the Navigator window and select Attach to a Chart.
2. Select the options you want on the tabs that appear.
3. When done, click OK.
Indicators should not be confused with custom indicators. See Section 5: Using
MetaTrader’s Autotrading Tools for more information on custom indicators.
When an indicator is attached to the chart, you can right-click in the chart window and select
Indicators List. This opens the Indicators on… window. You can use this to view the indicators
already attached to the chart. When you select an indicator, you can click Edit to open the settings
window for that indicator or click Delete to remove it from the chart.
90
If you use a particular indicator regularly, you can save it to your Favourites tab by rightclicking on it and selecting Add to Favourites. You can also set a hot key shortcut so
you can activate an indicator by pressing a key or two on your keyboard. See Setting
Keyboard Shortcuts for Autotrading Tools in the Navigator Window in Section 5: Using
MetaTrader’s Autotrading Tools for more information.
91
Managing Expert Advisors
With MetaTrader, you can use automated trading strategies called expert advisors to perform prompt
technical analysis of price data and manage trading activities based on current market conditions.
When an expert advisor is attached to the chart, you can right-click in the chart window to modify, test
and delete it.
The EUR/USD chart window with the expert advisor, MACD Sample, attached. To show you that it’s
attached, the name appears in the upper right corner of the chart window.
If you are using an EA and do not have a Virtual Private Server (VPN) subscription, your
EAs will stop running when you log out of MetaTrader.
You can verify if the expert advisor is active or not by looking for one of three types of icons in the
upper right corner of the chart. A
means that the expert advisor was attached and is actively
trading. A
shows that the expert advisor was attached, but that live trading is disabled for it. A
means that all expert advisors have been disabled.
For more information on expert advisors, see Section 5: Using MetaTrader’s
Autotrading Tools.
92
Applying Pivot Points to the Chart
You can apply pivot points to any chart. Pivot Points show key support and resistance levels in
market moves.
Pivot Points appear in the Custom Indicators section of the Navigator window at Pivot Points.
Before you add it to the screen, you can customise the length of the lines on the Inputs tab in the
Pivot Bars Length variable.
You can also change the colour and line style of each line by clicking the Colours tab and selecting
the line and colour you want.
For more information on custom indicators, see Adding a Custom Indicator to the Chart.
Adding Pivot Points to a Chart:
1. Right-click Pivot Points in the Navigator window and select Attach to a Chart.
2. If desired, select the Inputs tab. For the Pivot Bars Length variable, double-click in the row in the
Value column and enter a number for length.
3. If desired, select the Colours tab and change the colour and line style by double-clicking in the
field.
4. When done, click OK.
93
Adding the Currency Index to a Chart
You can add a currency index to any chart as you would a custom indicator. The currency indices,
such as the dollar index, are often used as a benchmark of one currency against several others.
The Currency Index appears in the Custom Indicators section of the Navigator window as Currency
Index. When you first add it to the chart, you can specify which currency will be the focus of the
index, the range of prices, how it appears in the chart, and other details.
For more information on custom indicators, see Adding a Custom Indicator to the Chart.
Adding Currency Index to a Chart:
1. Right-click Currency Index in the Navigator window and select Attach to a Chart.
2. Click the Inputs tab.
3. For the Currency variable, double-click in the row in the Value column and enter the threecharacter currency code for the currency you want.
4. Adjust the settings as desired in the other tabs.
5. When done, click OK.
You can add more than one currency index to a chart. Simply repeat the steps add more.
94
Displaying Detailed Candlesticks in a Chart
While you can change the chart type to display candlesticks, you can display more information about
the candlesticks in the chart with the Candlesticks custom indicator.
Detailed candlesticks appear in the Custom Indicators section of the Navigator window as
Candlesticks.
For more information on custom indicators, see Adding a Custom Indicator to the Chart.
Displaying Detailed Candlesticks in a Chart:
1. Right-click Candlesticks in the Navigator window and select Attach to a Chart.
2. Make sure everything you want is checked on the Common tab.
3. If desired, make sure the colors that you want are selected on the Inputs tab.
4. When done, click OK.
95
Applying an Autochartist™ Custom Indicator
The Autochartist custom indicators in MetaTrader scan the instrument of selected chart over multiple
timeframes to identify chart patterns. Depending on the patterns detected, Autochartist can forecast
possible market trends and determine their strength.
There are several types of Autochartist custom indicators that you can add to a chart.
•
Autochartist Fibonacci Patterns scans for Fibonacci patterns and displays any found
Fibonacci patterns on the chart. Additional details about the patterns are seen in the top left
corner of your chart.
•
Autochartist Key Levels forecasts support and resistance trends in current market moves.
Like the Fibonacci patterns, you’ll see a pattern display in the corner of the screen when
Autochartist detects a pattern.
•
Autochartist Power Stats looks at market volatility and provides a price range depicting
where the market may be in the next given period. Once again, when Autochartist detects a
pattern, a display appears in the upper corner providing details about the identified patterns.
You can also view the levels that Autochartist believes the market will reach.
Once added to the chart, the Autochartist information appears in the upper left corner.
Applying an Autochartist Custom Indicator:
1. Right-click on the Autochartist custom indicator in the Navigator window and select Attach to a
Chart.
2. Make sure everything you want is checked on the Common tab.
3. When done, click OK.
One thing to note is that it can take up to 30 seconds for a pattern to be recognised and
loaded onto a chart.
96
Managing Templates in the Chart Window
With a chart template, you can save the chart type, time frame, indicators, expert advisors and other
settings and apply it to any chart.
MetaTrader includes a number of already existing templates which you can select by right-clicking in
the chart window and selecting Template. From the drop-down menu, select one of the listed
templates. The chart window updates immediately.
If you’ve used MetaTrader before and have template (.tpl) files, you can import these by placing them
in the Templates folder on your computer. You can then import template files in MetaTrader using the
Load Template… menu option.
You may notice the default.tpl in the Templates folder. This is a basic template that is created during
the MetaTrader installation and applied automatically whenever the chart window is opened. While
you can edit this file, you cannot save over it.
You can save the contents of the chart window as a template or save changes you’ve made to an
existing template by using the Save Template… menu option. Once saved, the template appears by
name in the list of templates.
Loading a Template in the Chart:
1. In the chart, right-click and select Template.
2. From the drop-down menu, click Load Template.
97
3. In the Open window, select the .tpl file you want and click Open.
Saving a Template in the Chart:
1. In the chart, right-click and select Template.
2. From the drop-down menu, click Save Template.
3. If you are saving a new template, enter the file name you want. If you want your changes to
overwrite an existing template, click that template file.
4. When done, click Save.
The templates in the drop-down menu or the Templates folder on your computer may
vary from the graphic that you see here.
You can also use these commands by clicking
in the Charts toolbar. This displays
the same drop-down menu that you see when you right-click in the chart window.
Closing Charts and Recovering Them
As you trade, you may find it necessary to close chart windows. If you need to look at a chart that
was closed, you can reopen them using the Open Deleted menu option in the File menu.
You can reopen closed chart windows as long as the settings in the Charts tab in the Options window
are set to do so. See Specifying Chart and History Data Properties in Section 7: Customising the
Appearance and Settings in MetaTrader for more information.
To reopen a closed chart, click the File menu and select Open Deleted. In the drop-down menu that
appears, select the instrument and time frame that you want.
98
Section 4: Opening MetaEditor for the First Time
Before you use MetaTrader’s automated trading tools, you’ll want to learn a bit about MetaEditor, an
application installed with MetaTrader that helps you develop autotrading tools. With MetaEditor,
traders can import, create and modify expert advisors, custom indicators, scripts and other
MetaTrader autotrading tools. Before you start downloading or coding autotrading files, you’ll want to
open MetaEditor and become familiar with its workspace. In this section, you’ll receive an overview of
the tools and features you’ll use to create MetaTrader autotrading tools.
Opening MetaEditor
MetaEditor is automatically installed on your computer when you install MetaTrader. You can open it
while working in MetaTrader using one of the following methods.
•
Click the MetaEditor
button in the toolbar.
99
•
Right-click on an indicator, expert advisor, custom indicator or script and select Create,
Modify or Online Library.
•
Click Tools and select MetaQuotes Language Editor from the drop-down menu.
If you do not have MetaTrader open, you can open MetaEditor by clicking the Start menu on your
computer, clicking the MetaTrader folder and clicking MetaEditor. MetaEditor uses the same login as
MetaTrader.
Viewing the MetaEditor Workspace
The MetaEditor workspace contains all the features you need to create MetaTrader autotrading tools,
such as expert advisors, custom indicators, scripts and libraries.
•
Menu bar
•
Toolbar
•
Navigator window
•
Toolbox
•
File window
100
•
Status bar
The Menu Bar
At the top of the workspace, you’ll see the MetaEditor menu bar. You can use the five menus that
appear here to access that MetaEditor options that you’ll use to create and edit autotrading tools.
File – Displays menu options for creating and opening autotrading tool files. You can also access
recently opened files.
Edit – Contains the menu option for finding and replacing a text string in an autotrading tool file.
View – Displays menu options for displaying MetaEditor windows and toolbars. You can also manage
your language preferences from this menu.
Tools – Contains tools for accessing MetaTrader and arranging the windows in the MetaEditor
workspace.
Help – Contains menu options for displaying the MetaTrader online help, accessing the MQL.4 (the
MetaTrader programming language) community and viewing version information.
The MetaEditor Toolbar
You can access the most commonly used tools on the MetaEditor toolbar. If this isn’t displayed, click
the View menu and select Toolbar.
opens the Expert Advisor wizard. You can use this to immediately create an expert advisor,
custom indicator, script, library or other autotrading tool.
displays the Open window. If you’ve previously created a file, you can click this to navigate to the
file location and select it.
saves the code file of the autotrading tool you created. All MetaEditor files are saved as .mq4
files.
opens or closes the Toolbox window.
opens or closes the Navigator window.
cuts a selected section of code in a .mq4 file.
copies a selected section of code in a .mq4 file.
pastes a selected section of code in a .mq4 file into another file.
reverses the last action you just completed.
repeats the last action you just completed.
verifies if the code in the open file works as programmed. The Errors tab opens
automatically in the Toolbox window to show you if there are any errors or warnings. When the
compilation is successful, MetaEditor saves the file.
101
switches your computer to MetaTrader.
displays help files based on what you click on. When active, the cursor appears with a question
mark.
You can customise all of the toolbars so that they contain only the tools that you use by clicking View
and selecting Customise… This opens the Customising Toolbar window.
This window is where you can specify what appears in the selected toolbar. The Available section
shows any menu options that are currently not in the toolbar and can be added. The Selected section
displays all of the options that are currently displayed in the toolbar.
The tools that appear in the Available and Selected section depend on which toolbar you right-clicked
on.
To place a tool on the toolbar, you can select it in the Available section and click Insert. Conversely,
you can remove a tool from the toolbar by clicking it in the Selected section and then selecting
Remove.
You can also reposition the order of the tools in the menu bar by selecting a tool and clicking Up or
Down.
102
If you need to return to your original settings, click Reset.
When you are done reordering the toolbars, click Close.
The Toolbox Window
You’ll use the Toolbox window to find and download user-community created autotrading files. You
can also use this window to test recently downloaded or newly created files or search for specific
code strings in the files. The Toolbox organises these tools over four tabs.
If the Toolbox window isn’t displayed, you can click in the View menu and select the Toolbox menu
option. You can also click
in the toolbar.
The Errors tab displays a list of any errors that MetaEditor finds in the code file of the expert advisor,
custom indicator or other autotrading tool. After you save the file you’re working on, you can click
. The Errors tab then displays a list of any errors or warnings it found.
To go to the line with the error, you can right-click in the Errors tab and select Go To Line from the
drop-down menu that appears.
You can use the Find in Files tab to search for a specific word or line of code in one or more
autotrading files in a folder.
103
Click the Find in Files menu option in the Edit menu to open the search window. Type the word you
want and use the drop-down menu to select the location you want. When done, click Find.
You can view the list of files and the line in the Find in Files tab. To go to the line, you can right-click
in the Find in Files tab and select Go To Line from the drop-down menu that appears. You can also
double-click one of the results. The corresponding file is displayed with the cursor on the found text
and the line is marked with a green arrow in the margin field.
104
If you search for a line of code and then click the Find in Files menu option to start a
new search, MetaEditor clears the Find in Files tab.
The Online Library tab displays a list of trader created autotrading files. You can use the toolbar
along the top of this window to switch your search between expert advisors, custom indicators,
scripts and other files. You can use the scroll bar to move through the list. You can also click
to see if any new files have been added. When you find the item you want, select it and
click
. You can also right-click in the item row and select Download from the drop-down
menu. This opens the source code file in the workspace.
The Help tab displays online help files for creating or editing the MetaTrader autotrading tools using
the MetaQuotes Language 4 (MQL4). You can use the toolbar along the top of this window to
navigate through the files to find the code you want. You can also use the Dictionary tab in the
Navigator window to select specific topics to appear on the Help tab.
If you right-click an item in any of these tabs, you can view a drop-down menu. The options that
appear in the menu depend on the tab you selected. Some of the menu options that you may see
are:
105
Go to Line – This appears in the Errors tab and the Find in Files tab. Go to Line opens the
corresponding file with the cursor on the found text and a green arrow in the margin field of the line.
Copy – This appears in the Errors tab. It adds the selected error to the clipboard.
Clear – This appears in the Errors tab and the Find in Files tab. Clear removes all of the displayed
items from the tab.
Open – This appears in the Online Library tab. It displays the selected item in the application.
Download – This appears in the Online Library tab. Download opens the source code file in the
workspace.
Refresh - This appears in the Online Library tab. It updates the list to see if any new files have been
added.
Auto Arrange – This appears in the Errors tab, the Find in Files tab and the Online Library tab.
When checked, Auto Arrange resizes the columns automatically if the tab window size changes.
Grid – This appears in the Errors tab, the Find in Files tab and the Online Library tab. When
checked, Grid displays lines between the rows and columns.
106
The Help tab menu contains the menu options that are in the toolbar on the tab.
The Navigator Window
You’ll use the Navigator window to view code files. You can use these to research how an
autotrading tool works or to copy and paste existing code into a new autotrading tool. The Navigator
window organises these over three tabs.
The Files tab displays the folders and files that are in the Experts folder of your computer. You can
open these files by clicking the + to expand the folder and then double-clicking on the file you want.
107
The Dictionary tab shows code examples of the MQL4 language organised in books and files. You
can open these files by clicking the + to expand the book and then clicking on the file you want; the
topic you want opens in the Help tab of the Toolbox window.
108
The Search tab allows you to search the dictionary for a specific programming topic. When you enter
words in the field and click
, MetaEditor lists the search results in the tab. To view a result,
double-click on the search result you want. Like the Dictionary tab, the topic you want opens in the
Help tab of the Toolbox window.
109
The Code Window
The Code window is where you can view the text file that contains the source code of your expert
advisor, custom indicator, script or other MetaTrader autotrading tools.
You can download existing autotrading tools using the Toolbox or create them using the Expert
Advisors wizard. See Section 5: Using MetaTrader’s Autotrading Tools for more information.
The source code is displayed in a basic text file. Once opened, you can copy and paste lines of code
into the file or enter the code manually if you are familiar with MQL4.
You can open more than one autotrading tool file at a time and switch between them by clicking the
instrument tab at the top of the window.
110
The Options Window
You can use the Options window to specify font and style settings in the source code of the
autotrading tool. The Options window organises these over four tabs.
On the General tab, you can specify how text is formatted in the tab when more than one autotrading
tool file appears in the Code window.
On the Colours tab, you can enter settings to specify text and highlight colour in the autotrading tool
file. In the Elements section, select the code element you want and use the Foreground and
Background drop-down menus to select colours from a chart. If you want to change the colours back
to the way they were when you first installed MetaEditor, you can click Reset All.
111
On the Font tab, you can specify font type, size and script settings for the text that appears in the
code of the autotrading tool file. You can view how the text will look in the Text Preview box.
On the Network tab, you can view proxy server settings, if they are entered.
112
Section 5: Using MetaTrader’s Autotrading Tools
Most trading advisors recommend that traders follow a set trading strategy and stick to it. MetaTrader
offers a variety of automated trading tools that may help you do just that:
•
Expert Advisors. These automated trading strategies perform real-time technical analysis of
price data and manage trading activities based on current market conditions.
•
Custom Indicators. These modified technical indicators analyse the price moves of an
instrument.
•
Scripts. These perform an automated analytic or trading function on request. Unlike expert
advisors, which continually work and execute orders based on market moves, a script only
performs a function once.
In this section, we’ll discuss how to use each of these three automated trading tools.
113
Enabling Autotrading Tools
Before you use an expert advisor, custom indicator or script, you need to enable them in MetaTrader.
You can do this on the Expert Advisors tab of the Options window.
You can open the Options window by clicking on the Tools menu in the MetaTrader tool bar and
selecting Options.
The Enable Expert Advisors checkbox activates all expert advisors in MetaTrader. When the
checkbox is not checked, the expert advisors will not analyse chart price movements. The Disable…
checkboxes beneath it allow MetaTrader to automatically deactivate all of your expert advisors if you
change your account or your profile.
The Allow Live Trading checkbox enables you to place orders when an expert advisor or script is
active. When this is checked, you can also choose to select the Ask Manual Confirmation checkbox
below it. If your expert advisor or script is about to perform a trade and this checkbox is selected, a
notification appears, asking you to confirm the trade.
114
The Allow DLL Imports checkbox allows your expert advisors, custom indicators or scripts to
automatically access the dynamic-link library (.dll) files associated with them. When this is checked,
you can also choose to select the Confirm DLL Function Calls checkbox below it. If your expert
advisor, custom indicator or script is about to access a set of .dll files and this checkbox is selected, a
notification appears, asking you to confirm the request.
The Allow External Experts Imports checkbox enables your expert advisors, custom indicators or
scripts to automatically import functions from other MQL4 files. This is a security option that protects
you when you are working with expert advisors, custom indicators or scripts from an unknown
source.
If you are only using expert advisors, you can click
in the Standard
toolbar to activate them. When active, the button changes to look like this:
. This button does not activate custom indicators or scripts.
Enabling Expert Advisors, Custom Indicators, Scripts or Libraries in MetaTrader:
1. Click the Tools menu and select Options.
2. In the Options window, click on the Expert Advisors tab.
3. Make sure Enable Expert Advisors is selected.
4. If you are using expert advisors or scripts, check Allow Live Trading.
5. If you are using custom indicators or scripts, check Allow DLL Imports and Allow External
Experts Imports.
6. Change the rest of the options to suit your trading style.
7. When done, click OK.
115
Finding Autotrading Tools in the Online Library
When you first open MetaTrader, you can access a few expert advisors, custom indicators and other
autotrading tools from the Navigator window. You can also download additional autotrading tools
using the Online Library in MetaEditor; this is a MetaTrader developer application that helps you
import, create and modify expert advisors.
You can access the Online Library by right-clicking on the Expert Advisor, Custom Indicator or Script
menu in the Navigator window and select Online Library. This opens MetaEditor. For an overview of
this application, see Section 4: Opening MetaEditor for the First Time.
The Online Library opens in the Toolbox window of Meta Editor. You can use the toolbar along the
top of this window to switch your search between expert advisors, custom indicators, scripts and
libraries. When you’re searching for expert advisors, make sure Experts is selected.
116
You can use the scroll bar to move through the list. You can also click
expert advisors have been added.
to see if any new
When you find the expert advisor, custom indicator or script you want, select it and click
You can also right-click in the expert advisor row and select Download from the drop-down menu.
This opens the source code of the autotrading tool in the MetaEditor workspace.
.
If you know MQL.4 (the MetaTrader programming language), you can edit the code manually or add
additional code components from the tools in the Navigator window. You can also open other source
code files and copy and paste sections of code into the downloaded file.
A star appears in the header of the source code file after you’ve edited it. You can click Save
save your changes and continue working.
to
If you have no changes to the downloaded file, click
. This verifies if the code works as
programmed. The Errors tab opens automatically in the Toolbox window to show you if there are any
errors or warnings. When the compilation is successful, MetaEditor saves the file.
Once compiled, you can view the expert advisor, custom indicator or script you want in the Navigator
window of MetaTrader. To return to MetaTrader, click
.
Finding Autotrading Tools in the Online Library:
1. Right-click on the Expert Advisor, Custom Indicator or Script menu in the Navigator window and
select Online Library.
2. In the Online Library tab of the Toolbox, make sure the type of autotrading tool you want is
selected.
3. Scroll through the list of available autotrading tools.
4. When you find one, select it and click
.
5. If desired, make any changes to the code.
6. Click
.
Because EAs are created by separate and independent third parties, we are not
responsible for their completeness, reliability or accuracy. In other words, you use them
at your own risk. If you have questions on how an EA works, you will need to contact
117
the EA provider.
If you edited an expert advisor and if, after you compiled it, the icon is gray in the
Navigator window, there is an error and you cannot use the expert advisor. You’ll need
to review and edit your code and then compile the code again.
Creating an Expert Advisor
If you know MQL.4 (the MetaTrader programming language), you can create a new expert advisor by
right-clicking on the Expert Advisors menu in the Navigator window and selecting Create.
This opens MetaEditor, an application installed with MetaTrader that helps you create expert
advisors, and displays the Expert Advisor wizard.
118
The Expert Advisor wizard helps you specify which type of expert advisor you want and name the file.
Once you click Next, the wizard opens the General Properties window. Here, you can add
parameters to the file in the wizard by clicking Add. Once added, you can change what kind of
parameter the expert advisor uses by right-clicking on it and selecting Change Type. This displays a
drop-down menu of several strings. You can also change the initial value for the parameter by rightclicking on it and selecting Edit Value. If you want to change the name of the parameter, right-click on
it and select Rename. You can also remove a parameter by selecting it and clicking Delete.
When you click Finish, the wizard closes and opens a text file with the code for the parameters in it.
You can continue to add code for the expert advisor. The source file (*.MQ4) is saved in the Experts
folder.
The expert advisor appears as a selection in the Navigator window of MetaEditor, under the
Templates folder on your computer.
Creating an Expert Advisor:
1. In MetaTrader, right-click on the Expert Advisors menu in the Navigator window and select
Create.
2. When the Expert Advisor Wizard opens in MetaEditor, make sure Expert Advisor is selected and
click Next.
3. Enter the expert advisor name, the developer’s name and the developer’s website.
4. If desired, click Add to add a parameter to the expert advisor. If you need to customise it, rightclick on the parameter and select Change Type, Edit Value or Rename, as desired.
5. Click Finish.
6. Make the changes you want to the code file, as desired.
7. Click
.
You can switch back to MetaTrader without closing MetaEditor by clicking
the toolbar.
119
in
Testing an Expert Advisor
Once you create an expert advisor, you can test your own expert advisors before you attach them to
a chart. You can also specify settings so MetaTrader can automatically optimise the expert advisor.
The Strategy Tester shows you how an expert advisor would work on a particular instrument under
one or more market conditions. You can access the Strategy Tester by clicking View and selecting
Strategy Tester.
You can select the expert advisor you want to test using the Expert Advisor drop-down menu, which
contains a list of all available expert advisors. If you want to see or modify the settings of the expert
advisor before you run it, you can click the Expert Properties button. This displays a window with
information about the expert advisor on three tabs.
On the Testing tab, you can test how the expert advisor would work with your initial deposit and in the
base currency you want. The Positions drop-down menu allows you to select if the expert advisor
opens both long (buy) and short (sell) positions or only long or short positions.
You can run an expert advisor through multiple tests that mimic different market conditions. This is
called optimisation. On the Testing tab, you can choose one of five models for optimisation using the
Optimised Parameter drop-down menu.
•
Balance reports the smallest balance value in the deposit currency.
•
Profit Factor determines the gross profit and gross loss of one trade.
•
Expected Payoff looks at the average profit/loss factor of one trade. You can use this to
determine whether the trade was profitable or unprofitable.
•
Maximal Drawdown calculates the largest loss of one trade.
•
Drawdown Percent determines the maximal drawdown of your initial deposit.
120
MetaTrader will run the expert advisor through every possible combination of the parameter. If you
want MetaTrader to test the expert advisor using random, selective combinations, you can check the
Genetic Algorithm checkbox.
On the Inputs tab, you can select variables that affect how the expert advisor works. The inputs that
you see in this tab depend on the expert advisor you selected; you can use the checkboxes to select
the lot size, trailing stop levels, or other information and double-click in the Value, Start, Step or Stop
column to change the values. You can also click Load to add inputs to the expert advisor or Save to
save the variables as a set.
On the Optimisation tab, you can select limiting parameters for optimisation. As MetaTrader runs the
expert advisor through subsequent tests, it stops the test when one of the parameters is met. The
parameters that you see in this tab depend on the expert advisor you selected; you can use the
checkboxes to select parameters and double-click in the Value column to change its value.
You need to check the Optimisation checkbox on the Settings tab of the Strategy
Tester for these settings to apply to the optimisation.
121
You can determine how well an expert advisor would do with a particular instrument by selecting it
from the Symbol drop-down menu. You can view information about the spread, contract size and
other details about the selected instrument by clicking Symbol Properties.
You can also select a time frame, from one minute (M1) to one hour (H1) to Daily, using the Period
drop-down menu.
If you want to view this instrument with this time frame on the chart, click Open Chart.
MetaTrader stores historical data for all symbols and time frames so you can research the price
moves of an instrument over time or test how an expert advisor strategy would perform during a
particular market event. With historical data, you can use the Model drop-down menu to select three
modelling types for testing.
•
Every Tick tests a strategy based on the smallest available timeframe.
•
Control Points uses the last 12 bars of the current timeframe and then calculates the next
possible price moves using fractal interpolation.
•
Open Prices Only looks at the current open, high, low and close of data on the chart. This is the
fastest method to analyse price moves on the chart.
When you want the expert advisor to go through optimisation, you can click the Optimisation
checkbox.
If you want to modify the expert advisor before you test it, you can click Modify Expert to open Meta
Editor and made the changes you want. Once the expert advisor is compiled, you can return to
MetaTrader and continue your test.
If you think the market will behave like it did at some point in the past, you can click the Use Date
checkbox and use the drop-down menus to specify a date. You can select any date back to January
1, 1999.
You can watch a visualisation of the expert advisor being tested or optimised by checking Visual
Mode. When this is checked, MetaTrader displays a chart with the expert advisor and performs the
test or optimisation. You can use the playback scrollbar to adjust the playback speed or stop the
playback temporarily by clicking Pause. If you checked the Use Date checkbox, you can click Skip
Ahead and select the date you want to see.
When you are ready to run the test, click Start. MetaTrader shows a progress bar so you can monitor
the amount of time it takes to run the test. At any time during the test, you can click Stop to close the
test.
122
The amount of information that appears in the chart window may be different than the
amount you receive from the History Centre. For more information, see Specifying
Chart and History Data Properties in Section 7: Customising the Appearance and
Settings in MetaTrader.
When you click Skip Ahead, MetaTrader stops the visualisation and continues it after
the selected date.
Once opened, the Strategy Tester appears below the Terminal window. You may need
to adjust the size of the Strategy Tester window to see all of the windows you have
open.
If you want to optimise an expert advisor, you should select Control Points.
Testing or Optimising an Expert Advisor:
1. Click View and select Strategy Tester.
2. Select the expert advisor you want from the Expert Advisor drop-down menu.
3. Click Expert Properties and specify the settings you want on the three tabs. Click OK when
done.
4. If desired, click Modify Expert and modify the expert advisor.
5. Select an instrument from the Symbol drop-down menu.
6. Select the time frame you want from the Period drop-down menu.
7. Select Every Tick, Control Point, or Open Prices Only from the Model drop-down menu.
8. If you are optimising, check Optimisation.
9. If desired, check Visual Mode or check Use Date and select a date range.
10. Click Start.
Viewing the Results of the Expert Advisor Test
After the test has been completed, you can see the results of the test in Results, Graph, Report and
Journal tabs of the Strategy Tester window.
The Results tab displays a table that contains information about all of the trades that were executed
during the test. You can view information across several columns.
Type displays what kind of trade was placed (a sell, buy, etc.).
123
Order shows the ticket number of trade position or pending order.
Lots displays the number of lots that were traded.
Price shows the price at which the instrument was bought or sold.
S/L displays the price at which the Stop Loss order was executed. If this field is blank, it means that
no stop-loss order was placed.
T/P shows the price at which the Take Profit order was executed. If this field is blank, it means that
no take profit order was placed.
Profit displays what your profit or loss was on the transaction. This value only appears for closed
positions.
Balance shows how the trades placed would affect your account balance. The balance value is
recorded only at closing of positions.
You can click in the column header to sort the entries in ascending or descending order.
If you right-click in the Results tab, you can view a drop-down menu with other menu options.
You can use Copy to copy select lines in the table. You can also click Copy All to select the entire
table.
You can also save the table as an .htm file by clicking Save as Report and entering the name of the
report.
You can use Set Date From and Set Date To fields to change the timeframe.
The Graph tab displays a graph which maps your balance (with a blue line) and the number of lots
(with a green line). You can view this information in a legend that appears in the upper left corner.
You can double-click anywhere in the Graph tab to return to the Results tab.
If you right-click in the Graph tab, you can view a drop-down menu with other menu options.
You can use Copy to copy the entire graph so you can paste it in another file. You can also save the
graph as a .gif file by clicking Save as Picture and entering the name of the file.
124
The Report tab displays statistics about how the test was performed.
Bars in Test displays the number of bars that appeared in the history data.
Ticks Modelled shows the number of ticks that were used in the test.
Modelling Quality displays the quality of ticks modelled during testing with a percentage and a
colour band. A gray band shows if a date range was specified in the testing settings. A red band
shows that modelling was not performed on a portion of the time frame. During that part of the test,
only data of the time frame selected in the testing settings were used. A green band shows that
modelling was performed. The shade of green becomes brighter as the modelling quality gets higher.
Initial Deposit shows the amount of your initial deposit.
Total Net Profit displays the result of all trades. In this row, you can also view the Gross Profit, or
the sum of all profitable trades and the Gross Loss, or the sum of all unprofitable trades. Profit
Factor displays a comparison of the gross profit and the gross loss.
Expected Payoff looks at the average profit/loss factor of one trade. You can use this to determine
whether the trade was profitable or unprofitable.
Maximal Drawdown calculates the largest loss of one trade.
Absolute Drawdown shows the largest loss is below initial deposit value.
The Total Trades section of the report breaks down the number of trades, long or short positions and
what were your largest consecutive profits and losses.
If you right-click in the Report tab, you can view a drop-down menu with other menu options. You can
use Copy to copy the entire report. You can also save the report as an .htm file by clicking Save as
Report and entering the name of the report.
You can also change the appearance of the table by right-clicking in the Report tab and selecting
Auto Arrange, which resizes the columns automatically if the Strategy Tester window size changes
or Grid, which displays the lines between the rows and columns.
125
If you selected Open Prices Only from the Model Type drop-down menu in the
Settings tab, the Modelling Quality field will display an ‘n/a’ and a red band.
The Journal tab displays a list of system messages about the expert advisor’s test, such as orders
filled and positions closed.
Whenever you test an expert advisor, MetaTrader saves the entries that appear on the Journal tab as
a .log file. You can view this by right-clicking in the Journal tab and selecting Open from the dropdown menu. You can also select Copy to copy all journal entries. If you want to remove these
entries, you can select Clear All Journals.
You can also change the appearance of the journal table by right-clicking in the Journal tab and
selecting Auto Arrange. This resizes the columns automatically if the Strategy Tester window size
changes or Grid, which displays the lines between the rows and columns.
If you clicked Optimisation in the Settings tab, two additional tabs appear in the Tester window: the
Optimisation Results tab and the Optimisation Graph tab.
The Optimisation Results tab displays a table that contains information about all of the trades that
were executed during the optimisation.
Pass shows the pass number.
Profit displays the gross profit minus the gross loss.
Total Trades shows the total number of open positions.
Profit Factor displays the ratio between gross profit and gross loss in a percent. If a one appears in
this row, it means that these values are equal.
Expected Payoff shows the average profit/loss of one trade.
Drawdown $ displays the largest drawdown related to the initial deposit.
Drawdown % shows the largest drawdown related to the initial deposit in a percentage.
Inputs displays the changeable values of inputs at each pass.
You can click in the column header to sort the entries in ascending or descending order.
126
If you right-click in the Optimisation Results tab, you can view a drop-down menu with other menu
options. You can use Copy to copy select lines in the table. You can also click Copy All to select the
entire table. You can also save the table as an .htm file by clicking Save as Report and entering the
name of the report.
If you want to rerun the results of the test again, click Set Input Parameters to return to the Settings
tab.
If you only want to view the results of profitable passes, you can check Skip Useless Results. You
can also display or hide the Inputs column by checking (or unchecking) Show Input Parameters.
You can also change the appearance of the journal table by right-clicking in the Optimisation Results
tab and selecting Auto Arrange, which resizes the columns automatically if the Strategy Tester
window size changes or Grid, which displays the lines between the rows and columns.
The Optimisation Graph tab displays a graph which maps your profitable trades (in a green line) and
your unprofitable trades (in a red line).
You can double-click anywhere in the Optimisation Graph tab to return to the Optimisation Results
tab.
If you right-click in the Optimisation Graph tab, you can view a drop-down menu with other menu
options.
You can use Copy to copy the entire graph. You can also save the graph as a .gif file by clicking
Save as Picture and entering the name of the file.
127
Attaching an Expert Advisor to a Chart
Once you have the expert advisor as you want, you display it in the chart window by clicking and
dragging it from the Navigator window. This opens a window so you can specify settings for the
expert advisor.
If you are using an EA and do not have a Virtual Private Server subscription, your EAs
will stop running when you log out of MetaTrader.
On the Common tab, you can specify how you want the expert advisor to perform. The Positions
drop-down menu allows you to select if the expert advisor opens both long (buy) and short (sell)
positions or only long or short positions.
128
You can click the Enable Alerts checkbox so that MetaTrader sends you a message when the expert
advisor has placed a trade. You can also click Disable Alerts Once Hit so MetaTrader only sends a
notification once.
In the Live Trading section, you can click Allow Live Trading to enable or disable the expert advisor
in live trading. You can also click Ask Manual Confirmation to have MetaTrader send you a
notification when the expert advisor opens a position.
The Safety section contains options for specifying how to handle dynamic-link library (.dll) files. While
you may have already specified how MetaTrader handles these for all expert advisors, custom
indicators and scripts in the Options window, you can specify individual settings for the selected
expert advisor here. When checked, the Allow DLL Imports checkbox allows your expert advisor to
automatically access dynamic-link library (.dll) files associated with them. When this is checked, you
can also choose to select the Confirm DLL Function Calls checkbox below it. If your expert advisor
is about to access a set of .dll files and this checkbox is selected, a notification appears, asking you
to confirm the request.
The Allow External Experts Imports checkbox enables your expert advisor to automatically import
functions from other MQL4 files. This is a security option that protects you when you are working with
an expert advisor from an unknown source.
129
On the Inputs tab, you can view the variables used to calculate the expert advisor. The variables are
specific to the expert advisor you selected. You can change the variable values by double-clicking in
the variable row. You can also click Load to add inputs to the expert advisor or Save to save the
variables as a set.
If you need to return to the original settings, click Reset.
You can verify if the expert advisor has been attached to the chart by looking for one of three types of
icons in the upper right corner of the chart. A
means that the expert advisor was attached and is
actively trading. A
shows that the expert advisor was attached, but that live trading is disabled for
it. A means that all expert advisors have been disabled.
Remember, the Expert Advisors button in the Standard toolbar must be active in order
for your expert advisor to work.
Attaching an Expert Advisor to a Chart:
1. Right-click on the Expert Advisors you want in the Navigator window and select Attach to a
130
Chart.
2. Select the options you want on the Common tab.
3. If desired, click on the Inputs tab. Click Load. Navigate to the external set you want and click
Open.
4. Click OK.
You can only click and drag tested expert advisors in the chart window.
Only one expert can be attached to a chart. If you attach an expert advisor to a chart
that already has one, the new expert advisor will be added and the old one removed
from the chart.
Modifying an Expert Advisor Attached to a Chart
If you want to make a change to an expert advisor once it’s already attached to a chart, you can rightclick in the chart, select Expert Advisors and click Properties in the drop-down menu. This opens a
window so you can specify settings for the expert advisor.
Modifying an Expert Advisor Attached to a Chart:
1. In the chart, right-click and select Expert Advisors.
2. From the drop-down menu, click Properties.
131
3. Make your changes as desired.
4. Click OK.
Removing an Expert Advisor from the Chart
You can remove expert advisors from the chart using several methods. An expert advisor stops
working when you close the chart attached to it or close the MetaTrader application. You can also
right-click in the chart and select Remove from the drop-down menu.
Removing an Expert Advisor from the Chart:
1. In the chart, right-click and select Expert Advisors.
2. From the drop-down menu, click Remove.
No confirmation appears when you remove an expert advisor from the window.
132
Creating a Custom Indicator
You can create a new custom indicator by right-clicking on the Custom Indicators menu in the
Navigator window and selecting Create.
This opens MetaEditor, an application installed with MetaTrader that develops autotrading tools, and
displays the Expert Advisor wizard.
The wizard helps you specify which type of custom indicator you want and name the file.
133
Once you click Next, the wizard opens the General Properties window. Here, you can add
parameters to the file in the wizard by clicking Add. Once added, you can change what kind of
parameter the custom indicator uses by right-clicking on it and selecting Change Type. This displays
a drop-down menu of several strings. You can also change the initial value for the parameter by rightclicking on it and selecting Edit Value. If you want to change the name of the parameter, right-click
on it and select Rename. You can also remove a parameter by selecting it and clicking Delete.
When you click Next again, you can view the Drawing Properties window. Here, you can use the
wizard to specify where the custom indicator appears. Your custom indicator will automatically
appear in the chart unless you check Indicator in Separate Window, which displays the custom
indicator in a window below the chart. You can then specify the range it will have by checking
Minimum and Maximum and entering in a value.
You can specify how you want the indicator to look in the chart by clicking Add in the Indexes
section. You can right-click the Type field and select Change Type to specify if the indicator appears
as a line, section, histogram or arrow. You can also right-click the Colour field and select Change
Colour to specify what colour you want the indicator to be. If you make a mistake, you can also
remove an index by selecting it and clicking Delete.
134
When you click Finish, the wizard closes and opens a text file with the code for the parameters in it.
You can continue to add code for the custom indicator. The source file (*.MQ4) is saved in the
Indicators folder in the Navigator window of MetaEditor.
Creating a Custom Indicator:
1. In MetaTrader, right-click on the Custom Indicators menu in the Navigator window and select
Create.
2. When the Expert Advisor Wizard opens in MetaEditor, make sure Custom Indicator is selected
and click Next.
3. Enter the custom indicator name, the developer’s name and the developer’s website.
4. If desired, click Add to add a parameter to the custom indicator. If you need to customise it, rightclick on the parameter and select Change Type, Edit Value or Rename, as desired.
5. Click Next.
6. If desired, check Indicator in Separate Window. Then, check Minimum and Maximum and
enter in a value.
7. If desired, click Add in the Indexes section. Then right-click the Type field and select Change
Type to choose the type you want from a drop-down menu. You can also right-click the Colour
field and select Change Colour to select a colour.
8. Click Finish.
9. Make the changes you want to the code file, as desired.
10. Click
.
Once compiled, you can view the custom indicator in the Custom Indicators list in the
Navigator window of MetaTrader. You can switch back to MetaTrader by clicking
in the MetaEditor toolbar.
135
Adding a Custom Indicator to the Chart
Once you’ve imported, created or modified the custom indicator as you want, you can display it in the
chart window by clicking and dragging it from the Navigator window. This opens a window so you can
specify settings for the custom indicator.
On the Common tab, you can specify how this custom indicator will handle dynamic-link library (.dll)
files. While you may have already specified how MetaTrader handles these for all expert advisors,
custom indicators and scripts, you can specify individual settings for the selected custom indicator
here. When checked, the Allow DLL Imports checkbox allows your custom indicator to automatically
access dynamic-link library (.dll) files associated with them. The Allow Import of External Experts
checkbox enables your custom indicator to automatically import functions from other MQL4 files. This
is a security option that protects you when you are working with a custom indicator from an unknown
source.
On the Inputs tab, you can view the variables used to calculate the custom indicator. The variables
are specific to the custom indicator you selected. You can change the variable values by doubleclicking in the variable row.
136
On the Colours tab, you can modify the line colour of the custom indicator by double-clicking on the
colour and selecting a new one from the drop-down menu. You can also specify line width on a scale
of one to five by double-clicking on the Width row and selecting a new one from the drop-down menu
that appears. If you select a line width of one, you can also specify whether the line appears as solid
or dotted by double-clicking on the Style row and selecting a new one from the drop-down menu that
appears.
If your custom indicator appears outside of the chart, you will see a Levels tab. You can use this to
add a horizontal line at a particular level in the indicator. Click Add to add a horizontal line and use
the Style drop-down menus to specify a colour, line style and line thickness. You can add one or
more lines to the indicator window. To remove lines, select a line and click Delete.
On the Visualisation tab, you can select in which time frames the custom indicator can be used.
When you first open MetaTrader, the All Time frames checkbox is selected. When you uncheck it,
you can select one or more time frames.
If you need to return to the original settings, click Reset.
Adding a Custom Indicator to a Chart:
1. Right-click on the custom indicator you want in the Navigator window and select Attach to a
Chart.
2. Select the options you want on the Common tab.
3. If desired, click on the Inputs tab. Click Load. Navigate to the external set you want and click
137
Open.
4. Adjust the settings as desired in the other tabs.
5. When done, click OK.
You can duplicate custom indicators and use the settings on the Visualisation tab to
specify different time frames for each one. You can then place these in the same chart
and compare how the indicator for the instrument would behave over multiple time
frames.
Modifying a Custom Indicator Attached to a Chart
Once a custom indicator is attached to a chart, you can modify it using the Indicators List. This
displays a list of all indicators in the chart window.
Modifying a Custom Indicator Attached to a Chart:
1. In the chart, right-click and select Indicators List.
2. Make sure the custom indicator you want is selected and click Edit.
3. Make your changes as desired.
138
4. Click OK.
5. If you need to edit another custom indicator, select it, click Edit, and repeat the steps above.
6. When done, click Close.
You can also remove custom indicators from the chart using the Indicators List. In the
Indicators window, select the indicator you want to remove and click Delete.
Creating a Script
You can create a new script by right-clicking on the Scripts menu in the Navigator window and
selecting Create.
This opens MetaEditor, an application installed with MetaTrader that develops autotrading tools, and
displays the Expert Advisor wizard.
The wizard helps you specify which type of script you want and name the file.
139
When you click Finish, the wizard closes and opens a text file so you can view and edit the code.
You can continue to add code for the script. You can view the file in the Scripts menu of the
Navigator window in MetaTrader.
Creating a Script:
1. In MetaTrader, right-click on the Scripts menu in the Navigator window and select Create.
2. When the Expert Advisor Wizard opens in MetaEditor, make sure Script is selected and click
Next.
3. Enter the script name, the developer’s name and the developer’s website.
4. Click Finish.
5. Make the changes you want to the code file, as desired.
6. Click
.
Once compiled, you can view the script in the Scripts list in the Navigator window of
MetaTrader. You can switch back to MetaTrader by clicking
MetaEditor toolbar.
140
in the
Executing a Script on the Chart
Once you’ve imported, created or modified the script as you want, you can display it in the chart
window by clicking and dragging it from the Navigator window. Depending on what the script does,
MetaTrader will either see a confirmation or view a settings window so you can customise the script.
If your script is designed to execute a command based on certain conditions, you will see a
confirmation window. After you click Yes, you may see the settings window, depending on the type of
script.
If the settings window appears, you can specify how you want the script to perform on the Common
tab. While you may have already specified how MetaTrader handles permissions for all expert
advisors, custom indicators and scripts, you can specify individual settings for the script here. The
Positions drop-down menu allows you to select if the script opens both long (buy) and short (sell)
positions or only long or short positions.
141
You can click the Enable Alerts checkbox so that MetaTrader sends you a message when the script
has placed a trade. You can also click Disable Alerts Once Hit so MetaTrader only sends a
notification once.
In the Live Trading section, you can click Allow Live Trading to enable or disable the script in live
trading. When this is checked, you can also choose to select the Ask Manual Confirmation
checkbox below it. If your script is about to perform a trade and this checkbox is selected, a
notification appears, asking you to confirm the trade.
The Safety section contains options for specifying how to handle dynamic-link library (.dll) files. When
checked, the Allow DLL Imports checkbox allows a script to automatically access .dll files
associated with them. When this is checked, you can also choose to select the Confirm DLL
Function Calls checkbox below it. If your script is about to access a set of .dll files and this checkbox
is selected, a notification appears, asking you to confirm the request.
The Allow Import of External Experts checkbox enables your script to automatically import
functions from other MQL4 files. This is a security option that protects you when you are working with
a script from an unknown source.
On the Inputs tab, you can view the variables used to calculate the script. The variables are specific
to the script you selected. You can change the variable values by double-clicking in the Value column
of the variable row.
142
If you need to return to the original settings, click Reset.
Executing a Script on the Chart:
1. Right-click on the script you want in the Navigator window and select Executing a Script on the
Chart.
2. If the confirmation window appears, click Yes to confirm the settings. If the settings window
appears, select the options you want on the Common tab.
3. If desired, click on the Inputs tab. You can click Load to navigate to the external set you want and
click Open.
4. Click OK.
Only one script can be attached to a chart at a time. When a chart already has an
attached script, a confirmation window appears, verifying that the new script will be
added and the old one removed from the chart.
Removing a Script Attached to a Chart
Unlike expert advisors, which continually work and execute orders based on market moves, a script
only performs a function once. Normally, a script shuts down by itself, but there are several ways that
you can remove it.
143
The script will be removed from the chart if you:
•
Exit MetaTrader.
•
Change the instrument or time frame.
•
Click on a script in the Navigator window and drag it to the chart.
•
Right-click in the chart and select Remove Script.
144
Modifying an Expert Advisor, Custom Indicator or Script
Once added to the Navigator window, you can edit an expert advisor, custom indicator or script
before you add it to the chart if you know MQL.4. Right-click on the autotrading tool in the Navigator
window and select Modify from the drop-down menu. This opens MetaEditor and displays the source
code of the file.
Modifying an Expert Advisor, Custom Indicator or Script:
1. Right-click on the autotrading tool you want in the Navigator window and select Modify.
2. In MetaEditor, make the changes you want to the code file, as desired.
3. Click Save.
4. Click
.
MetaEditor is an application installed with MetaTrader that enables traders to import,
create and modify expert advisors, custom indicators, scripts and other autotrading
tools. See Section 4: Opening MetaEditor for the First Time for more information.
145
Deleting an Expert Advisor, Custom Indicator or Script
from the Navigator
If you make a mistake or change your mind after you add an expert advisor, custom indicator or script
to the Navigator window, you can permanently remove it from MetaTrader.
Deleting an Expert Advisor from the Navigator:
1. Right-click on the expert advisor, custom indicator or script you want in the Navigator window and
select Delete.
2. Click Yes to confirm.
If an expert advisor, custom indicator or script is attached to a chart, deleting it from the
Navigator window does not stop it from performing autotrading. You need to remove it
from the chart.
146
Adding a Library to an Expert Advisor or Script
As you create expert advisors or scripts, you may want to add a dynamic-link library (.dll) to the file.
You can download or create one in MetaEditor, an application installed with MetaTrader that
develops autotrading tools.
You can either download .dll files from the MetaEditor Online Library or create one using the tools in
MetaEditor. To access MetaEditor from MetaTrader, click the MetaEditor
toolbar.
147
button in the Standard
To download a library, make sure the Online Library tab is open in the Toolbox window and that
Libraries is selected.
You can use the scroll bar to move through the list. You can also click
library files have been added.
to see if any new
When you find the library file you want, select it and click
. You can also right-click in the
library row and select Download from the drop-down menu. This opens the library source code file in
the workspace.
To create a new library from scratch, click New in the File menu. This opens the Expert Advisor
window. Make sure Library is selected.
148
Once you click Next, the wizard opens the General Properties window. When you click Finish, the
wizard closes and opens a text file with the code for the parameters in it.
You can edit the code manually or add additional components from the tools in the Navigator window.
You can also open other source code files and copy and paste sections of code into the downloaded
file.
A star appears in the header of the library source code file after you’ve edited it. You can click Save
to save your changes and continue working.
Once your edits are made, click
. This verifies if the code works as programmed. The
Errors tab opens automatically in the Toolbox window to show you if there are any errors or warnings.
When the compilation is successful, MetaEditor saves the file.
See Section 4: Opening MetaEditor for the First Time for more information on
MetaEditor.
Setting Keyboard Shortcuts for Autotrading Tools in the
Navigator Window
If you think you will use an expert advisor, custom indicator or script frequently, you can set a
keyboard shortcut or hot key to open the autotrading tool automatically in the chart.
149
When you right-click on one of these items in the Navigator window, you can select Set Hotkey. This
opens the Navigator Hot Key window, where you can select an item from the list and set a keystroke
combination.
If you make a mistake, you can click Reset to remove the hot key from the selected indicator, expert
advisor, custom indicator or script. To remove all of the hot keys from these items, click Reset All.
Setting Keyboard Shortcuts in the Navigator Window:
1. In the Navigator window, right-click on a specific indicator, expert advisor, custom indicator or
script and select Set Hotkey.
2. In the Navigator Hot Key window, make sure the item you want is selected. If not, scroll to it.
3. Click Set.
4. Use the drop-down menu in the Control column to select either ALT or CTRL.
5. Enter the keyboard button in the Key column.
6. Click Close.
MetaTrader already has a number of commands set as hot keys. For a full list, see
Appendix A: MetaTrader Hot Keys. If you accidentally set an indicator, expert advisor,
custom indicator or script to a hot key that’s already used by the system, click Reset
and change the hot key to another combination.
150
Section 6: Generating Reports
Using an online trading application, you can access a variety of statements that you can use to
monitor your trading activity on MetaTrader. In this section, you’ll learn how to use this tool.
Generating MetaTrader 4 Reports
When you sign up for a live account with MetaTrader 4, you will also receive access to a special
online trading platform, which you’ll use to generate your reports and statements. You’ll use your
MetaTrader 4 login to access this.
If you have a practice account, you will not receive the online trading platform.
While you won’t be able to place trades from the online trading platform, it will show you the most
accurate transaction and order history on your MetaTrader 4 account.
Generating reports in the online trading platform:
1. Open the online trading platform. This link is sent to you when you open an account.
2. Enter your username and password. Click >> to login.
3. Select the report you want from the Type of Report drop-down menu.
4. Enter the dates you want in the From and To dates. Depending on the report, you may also be
able to choose other options.
5. Click Show Report to generate the report.
151
With live accounts, it is recommended having both MetaTrader 4 and the online trading
platform open when trading to compare equity values. Please remember that the equity
value in the online platform is the most accurate and legally-binding. You should rely on
this value when you are trading.
152
Section 7: Customising the Appearance and
Settings in MetaTrader
As you become more familiar with MetaTrader, you may want to change some of the settings to
make the platform fit your trading style. In this section, we’ll look at ways to customise windows and
other tools in MetaTrader.
Changing the Language in MetaTrader
You can select the language you want the functionality of MetaTrader to appear in by clicking the
View menu and selecting Languages. You can then select the language you want from the dropdown menu.
You will need to restart MetaTrader for the language change to take effect. When you re-login,
MetaTrader will display its windows in the language you specified.
153
Customising the Toolbars
You can modify the options that appear in the four toolbars in MetaTrader by right-clicking on the
toolbar and selecting Customise… from the drop-down menu. This displays the Customising Toolbar
window for that specific toolbar.
This window is where you can specify what appears in the selected toolbar. The Available section
shows any menu options that are currently not in the toolbar and can be added. The Selected section
displays all of the options that are currently displayed in the toolbar.
The tools that appear in the Available and Selected section depend on which toolbar you right-clicked
on.
To place a tool on the toolbar, you can select it in the Available section and click Insert. Conversely,
you can remove a tool from the toolbar by clicking it in the Selected section and then selecting
Remove.
You can also reposition the order of the tools in the menu bar by selecting a tool and clicking Up or
Down.
If you need to return to your original settings, click Reset.
When you are done reordering the toolbars, click Close.
154
Adding RSS Feeds to Connect
In Connect, you can add a feed to the News section by clicking Add a Feed. The Add a News Feed
window opens.
You can add a feed in one of two ways:
•
You can choose feeds from the six providers by clicking their icon. A list of available feeds for
that provider appears.
You can rename the feed, if desired, and click the checkbox to have an alert display when
MetaTrader receives a new story.
•
You can also enter the web address or URL of a feed manually by selecting the Click here…
link. You can then copy and paste or type the feed address in the Feed URL field. You can
then click Check Feed.
155
MetaTrader will check to make sure that the feed is valid. If it’s not, an error message
appears. If it is, you can rename the feed, if desired, and click the checkbox to have an alert
display when MetaTrader receives a new story.
At any time, you can click Back to go to the previous screen or Cancel to exit the window entirely.
Filtering News in Connect
In Connect, you can filter stories that appear in the News section by keyword.
When you first open Connect, the filter is set to display all news stories. You can narrow down the
selection of stories by clicking All Selected Feeds and selecting one of the preset filters.
You can also add your own filter by clicking Add a Filter. The Add a Filter window will open.
156
You need to name the filter and then type the keyword in the field. You can click the checkbox to
have an alert display when MetaTrader receives a new story that matches the keyword.
If you want to enter more than one keyword, you need to separate the keywords by
commas. For example, if you were looking for information about the EUR/USD, you
would enter “EUR/USD, EURUSD” in the field.
When done, click Add Filter.
If you need to modify the filter settings, select the filter you want and click Edit Filter in the Open and
Pending Orders section. The Edit Filter Details window opens.
You can click the field that you want to edit and make the changes as necessary. When done, click
Save Filter. Or if you want to remove the filter, click Delete Filter.
At any time, you can click Cancel to exit the window entirely.
157
Adding Twitter Feeds in Connect
In Connect, you can add a Twitter feed to the Twitter section by clicking Add a Tweeter.
The Add a Tweeter window opens. You can enter the name of the twitter follower. You can click the
Display New-item Alerts checkbox to have an alert display when MetaTrader receives a new tweet.
When done, click Add Tweets.
If you need to modify the Twitter settings, select the Twitter feed that you want and click Edit
Tweeter in the Open and Pending Orders section.
When the Edit Tweeter window opens, you can make the changes as necessary. When done, click
Save Changes. Or if you want to remove the tweeter, click Remove Tweeter.
At any time, you can click Back to go to the previous screen or Cancel to exit the window entirely.
Filtering Twitter Feeds in Connect
In Connect, you can filter which Twitter feeds appear in the Twitter section.
When you first open Connect, the filter is set to display all Twitter feeds. You can narrow down the
selection of tweets by clicking All Tweeters and selecting one of the Twitter feeds.
158
You can also add your own filter by clicking Add a Filter.
When the Add a Filter window opens, you need to name the filter and then type the keyword in the
field. You can click the checkbox to have an alert display when MetaTrader receives a tweet that
matches the keyword.
If you want to enter more than one keyword, you need to separate the keywords by
commas. For example, if you were looking for information about the EUR/USD, you
would enter “EUR/USD, EURUSD” in the field.
When done, click Add Filter.
At any time, you can click Cancel to exit the window entirely.
159
Changing the Mini Terminal and Trade Terminal Settings
You can control the settings for the Mini Terminal and Trade Terminal by clicking Settings and
choosing Confirmations and Preferences from the drop-down menu.
In the Confirmations and Settings window, you can check one of three settings.
Confirm quick buy and quick sell –Displays the confirmation message that appears when you click
Sell or Buy in the Mini Terminal windows.
Confirm close-all for symbols –Displays the confirmation message when you click
Close.
and select
Non-hedging mode – Places the MetaTrader 4 software in non-hedging mode. This should always
remain checked.
If you unselect non-hedging, the positions and orders that you hold in MetaTrader may
not match your true orders. Please remember that the equity value displayed in the
online trading application is the most accurate and legally-binding. You should rely on
this value when you are trading. If you have questions about the difference between the
two platforms, contact us.
160
Customising the Appearance of the Chart Window
You can change the setup of the chart window by right-clicking in the chart and selecting Properties
from the drop-down menu. This opens the Chart Properties window.
This window organises the various settings for the selected chart window on two tabs: the Colours
tab and the Common tab.
If you make a mistake while entering settings, you can click Reset to restore all of your settings to the
original ones.
When you are done customising the settings, click OK.
Changing the Colour of the Chart Window
On the Colours tab, you can specify the colours for the chart window background, foreground and
grid. You can also select colours for the bars, candles, line graph and other features.
161
You can use the Colour Scheme drop-down menu to select a set of pre-defined colour properties.
You can choose from three types of commonly used colour schemes.
To select a colour, click on the drop-down icon for the setting you want to change and select a colour
from the Colour Selection menu.
If you don’t see a colour you want to add, click Custom at the bottom of the Colour Selection menu.
This displays the Colour window. You can enter a colour code or use the colour view to click and
drag to mix the colour you want. When you have the colour you want, click Add to Custom Colours.
You can add up to 16 custom colours. When you are done, click OK.
162
Customising Viewing Settings on the Chart Window
On the Common tab, you can also specify settings. Some of these may already be selected based on
what you chose in the Charts toolbar.
The Offline Chart checkbox turns the chart offline; when checked, the chart window stops receiving
and drawing price data. The Offline Chart checkbox will be checked if you click the File menu and
select Open Offline.
The Chart on Foreground checkbox places the chart in the foreground. When this is checked, all
drawing objects will look as if they are under the price chart. The Chart on Foreground checkbox
will be checked if you click the Charts menu and select Foreground Chart.
The Chart Shift checkbox arranges the chart so the latest price moves appear at a certain point in
the chart. When active, you can click the marker at the top of the chart window and set it anywhere
between the right side of the chart and the middle of the chart. The Chart Shift checkbox will be
checked if you click the Charts menu and select Chart Shift.
The AutoScroll checkbox updates the chart so that it always scrolls to the right to show the latest
price moves. The AutoScroll checkbox will be checked if you click the Charts menu and select
AutoScroll.
The Scale Fix One to One checkbox sets the chart scale as "one to one”; the size of one point of the
vertical axis in pixels is equal to the distance between the bars axes in pixels. When placing lines and
other drawing objects or indicators on the chart, many traders prefer to set Scale Fix One to One
because it creates the most accurate objects or indicators.
The Scale Fix checkbox sets the current chart scale to a value that you specify in the Fixed
Maximum and Fixed Minimum text box.
163
When selected, the Bar Chart radio button displays the price moves of the selected instrument as a
sequence of bars.
When selected, the Candlestick Chart radio button displays the price moves of the selected
instrument as a sequence of blocks or candles. Each candle displays the high, low, open and close of
the instrument and represents the trading activity for the time frame selected in the chart.
When selected, the Line Chart radio button displays the price moves of the selected instrument as a
continuous line. The line connects the close prices for the time frame selected in the chart.
The Show OHLC checkbox displays or hides price information that appears in the upper left corner
of the chart window. You can view the open, high, low and close of the latest bar, candle or line on
the screen.
The Show Ask Line checkbox displays or hides a horizontal line on the chart that tracks the ask
price of the last quote. In MetaTrader, the price moves that you see on the chart track the bid prices
of the selected instrument, but when you open a long position or close a short position, the ask price
is always used. This line shows traders what the ask price is.
The Show Period Separators checkbox displays or hides vertical lines in the chart to mark periods
of time, depending on the time frame. For example, if the Periodicity drop-down menu in the chart
window is set between M1 and H1, MetaTrader will draw vertical lines to separate the days. If
Periodicity is set to H4, the period separators represent weeks; for D1, the period separators depict
months and, for W1 and MN1, they represent years.
The Show Grid checkbox displays or hides vertical and horizontal grid lines in the chart window. The
Show Grid checkbox will be checked if you click the Charts menu and select Grid.
The Show Volumes checkbox displays or hides the current trading volume for the selected
instrument in the chart window. The Show Volumes checkbox will be checked if you click the Charts
menu and select Volumes.
The Show Object Descriptions checkbox displays or hides the description of objects in the chart
window. If this option is enabled and there are descriptions of objects imposed into the chart
available, they will be shown directly in the chart.
164
Specifying MetaTrader User Settings
You can customise MetaTrader features and tools using the Options window. You can open this by
clicking on the Tools menu and selecting Options.
The Options window organises the various settings for MetaTrader on several tabs. In this topic,
you’ll see how to specify features on each tab.
Viewing MetaTrader Server Settings
The Server tab in the Options window displays the settings that specify how MetaTrader connects to
the servers.
The Server drop-down menu enables you to select one or more servers. This should already be set
with the server IP address and port number you need.
The Login and Password text boxes are where your login information is stored. If you need to
change your password, click Change. This opens the Change Password window, where you can
enter and confirm your new password.
165
If your version of MetaTrader is set up to use a data centre, make sure the Data Centre Auto
Configuration checkbox is selected.
The Keep Personal Settings and Data at Startup checkbox stores personal information and other
data about your trading. If you are using MetaTrader on a shared computer, you can clear your login
information by unchecking this checkbox.
The Enable DDE Server checkbox displays whether expert advisors and other tools in MetaTrader
can use the Dynamic Data Exchange (DDE), a tool on Microsoft Windows operating systems that
allows your computer to exchange information with other applications.
The Enable News checkbox displays whether MetaTrader can import news, messages and other
information from the server, if available.
Usually, the information that appears on the Server tab is first entered when MetaTrader
is installed and you do not need to change it. If you believe you need to change it,
contact Technical Support.
Specifying Chart and History Data Properties
The Charts tab in the Options window displays the settings for the chart windows and history data.
The Show Trade Levels checkbox displays or hides a horizontal line on the chart that shows where
a position was opened or where a Stop Loss or Take Profit order will occur.
The Show OHLC checkbox displays or hides price information that appears in the upper left corner
of the chart window. You can view the open, high, low and close of the latest bar, candle or line on
the screen.
The Show Ask Line checkbox displays or hides a horizontal line on the chart that tracks the ask
price of the last quote. In MetaTrader, the price moves that you see on the chart track the bid prices
of the selected instrument, but when you open a long position or close a short position, the ask price
is always used. This line shows traders what the ask price is.
The Show Period Separators checkbox displays or hides vertical lines in the chart to mark periods
of time, depending on the time frame. For example, if the Periodicity drop-down menu in the chart
window is set between M1 and H1, MetaTrader will draw vertical lines to separate the days. If
166
Periodicity is set to H4, the period separators represent weeks; for D1, the period separators depict
months and, for W1 and MN1, they represent years.
The Colour Print checkbox allows you to print all charts in colour when enabled. If unchecked, the
charts appear in black and white.
The Save Deleted Charts to Reopen checkbox saves the settings from charts that were deleted or
closed. When enabled, any chart can be restored when you click the File menu and select Open
Deleted.
The Max Bars in History drop-down menu allows you to specify how many bars, candles or line
ticks are saved with the chart history. When you open a chart history, MetaTrader will display only the
amount of bars, candles or line ticks as specified in the drop-down menu.
The Max Bars in Chart drop-down menu allows you to specify how many bars, candles or line ticks
appear in the chart. When you open a chart, MetaTrader will display only the amount of bars, candles
or line ticks as specified here. If the chart is set to display the latest price information or is refreshed
after being in offline mode, MetaTrader will discard older bars, candles or line ticks as specified in the
drop-down menu.
The settings you specify here will be used whenever you open a new chart window. If
you change any settings on this tab, it will not affect individual chart settings you may
have already specified on the Common tab of the Chart Properties windows.
Customising Object Properties on the Chart
The Objects tab in the Options window displays the settings for objects, such as line studies,
technical indicators and drawing items, that appear in the chart window.
The Show Properties After Creation checkbox displays the edit window immediately after you draw
an object. That way, you can specify settings for the object. When not checked, MetaTrader
configures your drawings with the current settings.
The Select Objects after Creation checkbox allows you to specify if you want the object you’ve just
drawn to appear in the chart window. When not checked, the last selected item remains active.
The Select Objects by a Single Mouse Click checkbox allows you to click once on an object to
select it. When not checked, you need to double click on an object to select it.
167
The Magnet Sensitivity drop-down menu automatically places objects that you’ve drawn a certain
number of pixels from an open, close, high or low price point on the chart. For example, if you select
10, the object on the chart will automatically be anchored within 10 pixels of the nearest open, close,
high or low price point on the chart. You can disable this option by selecting zero from the drop-down
menu.
Specifying Order Settings
The Trade tab in the Options window displays the settings for opening orders in MetaTrader.
The Symbol by Default section specifies which instrument to use when you open the New Order
window to place a market order. When Automatic is selected, the first instrument in the instrument
list is selected in the Symbol drop-down menu of the New Order window. When Last Used is
selected, the last instrument you traded is selected. When Default is selected, you can use the dropdown menu beside it to select a specific instrument.
The Size by Default section sets the lot size of the trade you want to fill. The number of lots you
entered in your last trade is used indefinitely when Last Used is selected. If you want to trade using a
constant number of lots, you can select Default and use the drop-down menu beside it to set the lot
size.
The Deviation by Default section specifies the number of pips that the price can change when you
place an order. If markets are fast moving or become extremely volatile, such as during a news
announcement, the price of the market that you’re trying to trade may suddenly jump or drop in a
moment. If this should occur, MetaTrader 4 fills your order, but at the nearest market price; this may
be a multiple pips away from the original price. This is called slippage. In this section, you can click
Default and specify that MetaTrader fill your order as long as the price is within the number of pips
above or below the price at which you placed the order. If you select Last Used, MetaTrader uses
the number of pips at which the last order was placed, if there is slippage.
168
Customising Autotrading Settings
The Expert Advisors tab in the Options window displays settings that specify how MetaTrader uses
expert advisors, custom indicators, scripts or libraries.
Enable Expert Advisors activates (or deactivates) all expert advisors in MetaTrader. When the
checkbox is not checked, the expert advisors will not analyse chart price movements. The Disable…
checkboxes beneath it allows MetaTrader to automatically deactivate all of your expert advisors if you
change your account or your profile.
Allow Live Trading enables you to place orders when an expert advisor or script is active. When this
is checked, you can also choose to select the Ask Manual Confirmation checkbox below it. If your
expert advisor or script is about to perform a trade and this checkbox is selected, a notification
appears, asking you to confirm the trade.
Allow DLL Imports allows your expert advisors, custom indicators or scripts to automatically access
dynamic-link library (.dll) files associated with them. When this is checked, you can also choose to
select the Confirm DLL Function Calls checkbox below it. If your expert advisor, custom indicator or
script is about to access a set of .dll files and this checkbox is selected, a notification appears, asking
you to confirm the request.
Allow External Experts Imports enables your expert advisors, custom indicators or scripts to
automatically import functions from other MQL4 files. This is a security option that protects you when
you are working with expert advisors, custom indicators or scripts from an unknown source.
169
Entering Email and Server Settings
The Email tab is where you can enter your email and server information.
To begin entering information, click Enable.
The SMTP Server text box is where you will enter the address of your SMTP server and the port
number.
The SMTP Login text box and SMTP Password text box are where you enter the login and
password for the trader server.
The From text box is where you enter your name and the email address on the SMTP; this is the
address from which the message will be sent.
The To text box is where you enter the name and email address that you want to send the message
to.
The Test button sends a message using the settings specified. If the test is successful, click OK. If
not, check the settings and test again.
170
Entering Reporting Settings
The Publisher tab is where you can publish reports about your account status to the internet
automatically.
To begin entering information, click Enable.
The Account text box is where you’ll enter the account number that you want published.
The Refresh Every drop-down menu allows you to specify how often MetaTrader sends a report to
the server. You can select time frames from five minutes to 1440 minutes.
The FTP Server text box is where you’ll enter the FTP server address where the report will be sent.
The FTP Path text box is where you’ll enter the name of the FTP server directory where the report
will be placed. You’ll need to include the path, including the root directory, in this field.
The FTP Login text box and FTP Password text box are where you enter the login and password for
the FTP server.
When Enable is selected, the Passive Mode checkbox becomes active. In active mode, the server
sets up a connection with MetaTrader to transfer data. In passive mode, MetaTrader establishes a
connection with the server.
The Test button posts a report to the server using the settings specified. If the test is successful, click
OK. If not, check the settings and test again.
MetaTrader will only publish reports for active accounts. If the account number entered
does not match with the one on file, MetaTrader will not publish the report.
171
Customising Sounds for MetaTrader
The Events tab displays a list of MetaTrader actions that play a sound file when active.
To begin entering information, click Enable.
You can double-click in the Event column to turn on or off a sound.
means the alarm was turned off.
means an alarm will sound.
In the Action column, you can double-click to display a drop-down menu of possible sounds. Simply
click on the new .wav file to select the sound.
If you have other sound files on your computer, you can double-click in the Action column and select
Choose Other… from the drop-down menu. This opens the Open window and you can navigate to
the folder where your sound files are stored. When you find one, click on it and select Open.
If you want to use sounds, you should choose a different sound file for each event. You can view
what each event does in the list below:
Connect signals that MetaTrader has successfully connected to the server.
Disconnect indicates that the connection to the server has been lost.
Email Notify signals that a new email has been received in the MetaTrader mailbox. You can view it
on the Mailbox tab of the Terminal window.
Timeout indicates that the time range for performing a specific trade operation has ended. For
instance, you might hear this sound if you place an order in an extremely volatile market and your
order was not placed.
OK signals that the trade operation you just executed was successfully performed.
News indicates that MetaTrader has received a new news story. When news feeds are available, you
can view it in the News tab of the Terminal window.
Expert Advisor signals that an expert advisor has performed a trade operation.
Expert Confirmation indicates that a manual confirmation is open and needs your confirmation.
When the Ask Manual Confirmation is selected in the Expert Advisors tab, MetaTrader displays a
notification, asking you to confirm the trade when your expert advisor or script is about to perform a
trade.
172
Alert signals that market conditions have hit the alert you specified with your expert advisor.
Requote indicates that the price of the instrument you placed the order for changed in the middle of
the trade operation.
Trailing Stop signals that one of your trailing stop orders has been triggered.
Accessing the History Centre
MetaTrader stores historical data for all symbols and time frames in its server. If you need to
research the price moves of an instrument over time or want to test how an expert advisor strategy
would perform on a particular event, you can access this historical data by clicking the Tools menu in
the menu bar and selecting History Centre.
You can download quotes for instruments from 1999 to present by selecting the instrument and the
timeframe you want from the list and clicking Download.
173
If you need to add a time point, you can click Add. This opens the Bar window, where you can enter
the time and modify the open, high, low or close.
You can also modify a time point by selecting a time point and clicking Edit or remove a time point by
selecting a time point and clicking Delete.
Data that appears in the History Centre is downloaded from MetaQuotes servers. Data
that appears in the History Centre can vary from the historical information stored on the
trade server.
Because the chart history is stored on the server, it may take MetaTrader a few
moments to generate the historical data.
You can save data from the History Centre as an external .csv, .prn or .htm file by clicking Export.
This opens the Save As window. Here, you can navigate to the folder you want, select a file type, add
a file name and click Save.
If you already have historical chart data from another source, you can click Import. This displays the
import window. Here, you can select a.csv, .prn, .txt, .htm or .hst file by clicking Browse and
navigating to the file.
Once selected, you can use:
•
The Separator drop-down menu to specify what kind of separator to use. You can select either a
comma, semicolon, space or tab.
•
The Skip drop-down menus to select how many columns or rows MetaTrader should use when
importing.
•
The Shift drop-down menu if you need to shift data by several hours in time.
•
The Selected Only checkbox to import only data that is selected in the history. You can select
data by clicking and pressing CTRL or SHIFT.
•
The Volumes checkbox to enable or disable MetaTrader’s ability to import volume.
174
When importing a file, the historical data should be written as follows (another separator
can be used instead of a space):
•
YYYY.MM.DD HH:MM O H L C V
•
YYYY-MM-DD HH:MM O H L C V
•
YYYY/MM/DD HH:MM O H L C V
•
DD.MM.YYYY HH:MM O H L C V
•
DD-MM-YYYY HH:MM O H L C V
•
DD/MM/YYYY HH:MM O H L C V
.hst files should also include both the following header:
struct HistoryHeader
{
int version;
// database version
char copyright[64]; // copyright info
char symbol[12]; // symbol name
int period;
// symbol timeframe
int digits;
// the amount of digits after decimal point in the symbol
time_t timesign;
// timesign of the database creation
time_t last_sync; // the last synchronization time
int unused[13]; // to be used in future
};
And the following bars array (with single-byte justification)
#pragma pack(push,1)
//---- standard representation of the quote in the database
struct RateInfo
{
time_t
ctm;
// current time in seconds
double
open;
double
low;
double
high;
double
close;
double
vol;
};
#pragma pack(pop)
175
Exporting Quotes
You can export current quotes to other programs using the Dynamic Data Exchange (DDE), a tool on
Microsoft Windows operating systems that allows your computer to exchange information with other
applications.
You’ll need to make sure that Enable DDE Server is checked on the Server tab in the
Options window. See Customising Autotrading Settings in this section for more
information.
History Data cannot be exported through the DDE. Only current quotes can be
exported.
176
Managing Global Variables
As you trade, you may have more than one expert advisor making and placing trades at one time. In
order for these to work at times, the expert advisors need to exchange information through global
variables. You can add and manage global variables by clicking Tools in the menu bar and selecting
Global Variables in the drop-down menu. This opens the Global Variables window.
Click Add to add a variable. Double-click in each column to specify the variable name and its value.
To remove a variable, select it and click Delete.
Using the Advanced Security System
MetaTrader uses 128-bit key encryption when trading. If you work with an organisation that needs
additional security, MetaTrader also offers an Advanced Security mode that provides public and
private keys.
If you are using the Advanced Security system, but need to place a trade at another computer, you
will need to transfer the keys from your computer to the one you are trading on. The .key files are
stored in the Config folder in the MetaTrader folder.
If the Advanced Security system key has been lost or damaged, contact Technical
Support.
177
Appendix A: MetaTrader Hot Keys
You can access tools and features in MetaTrader using the hot keys. These allow you to use the
keys on your computer keyboard to open or close tools and features without navigating through
menus or clicking in the toolbar.
Keystroke
Page Up
Page Down
Home
End
+
Delete
Backspace
Enter
Esc
F1
F2
F3
F4
F8
F9
F10
F11
F12
SHIFT+F12
SHIFT+F5
ALT+1
ALT+2
ALT+3
ALT+A
ALT+W
ALT+F4
ALT+Backsp
ace, CTRL+Z
Action
Scrolls the chart to the left.
Scrolls the chart to the right.
Moves the chart to the oldest point in the chart history.
Moves the chart to the most recent chart moves in the chart history.
Zooms out on the chart.
Zooms in on the chart.
Deletes the selected drawing and technical objects from the chart.
Deletes the last drawing or technical object created from the chart.
Opens or closes the Fast Navigation window in the chart.
Closes any windows.
Opens or closes the Online Help file.
Opens or closes the History Centre window.
Opens or closes the Global Variables window.
Opens or closes the MetaEditor application.
Opens or closes the Chart Properties window.
Opens or closes the New Order window.
Opens or closes the Popup Prices window.
Opens or closes the chart window in full-screen mode.
Moves the chart by one bar to the left.
Moves the chart by one bar to the right.
Switches to the previous profile.
Changes the chart type to bar chart.
Changes the chart type to candlesticks chart.
Changes the chart type to line chart.
Copies all test/optimisation results to the Clipboard.
Opens the Windows list. If you have more than one chart window open,
you can switch to a particular chart by selecting the chart you want and
clicking Activate.
Closes MetaTrader.
CTRL+B
Undeletes the last deleted drawing or analytical object.
Resizes the height of all indicator windows in a chart so that they're the
same size.
Opens the Objects List window. You need to have at least one object
drawn in a specific chart window.
CTRL+C,
CTRL+Insert
Copies the select drawing or analytical object to the chart.
CTRL+A
178
CTRL+D
CTRL+E
CTRL+F
CTRL+G
Opens or closes the Data window.
Activates or deactivates the Expert Advisors button.
Activates or deactivates the Crosshair cursor in the chart window.
Activates or deactivates the grid in the chart window.
Keystroke
Action
CTRL+H
Shows or hides the open, close, high or low prices in the upper-right
corner of the chart window.
CTRL+I
CTRL+L
CTRL+M
CTRL+N
CTRL+O
CTRL+P
CTRL+R
CTRL+S
CTRL+T
CTRL+W,
CTRL+F4
CTRL+Y
CTRL+F5
CTRL+F6
CTRL+F9
Opens the Indicators List window. You need to have at least one
indicator open in a specific chart window.
Displays or hides the volumes in the chart window.
Opens or closes the Market Watch quote board.
Opens or closes the Navigator window.
Opens the Setup window.
Prints the current chart window.
Opens or closes the Strategy Tester window.
Saves the chart as a .csv, .prn or .htm file.
Opens or closes the Terminal window.
Closes the currently displayed chart window.
Displays or hides the period separators in the chart window.
Switches to the next chart profile.
Moves to the next chart window when more than one chart is open.
Opens the Terminal window.
interactive markets is a trading name of GFT Global Markets UK Ltd. Trading forex, CFDs, and
spread bets is risky and not suitable for everyone. All of these products (excluding Binary CFDs and
Binary Spread Bets) are leveraged, and you can lose more than your initial deposit. Don’t trade more
than you can afford to lose. GFT Markets is a trading name of GFT Global Markets UK Ltd., and is
authorised and regulated by the Financial Services Authority (FSA) for forex, CFDs, and Spread
Bets. The FSA does not regulate Binary CFDs and Binary Spread Bets. © 2012 Global Futures and
Forex, Ltd. All rights reserved. CD04UK.160.101112
179