1
Chapter 14
Statistical Hypothesis
Testing and Differential
Expression Analysis
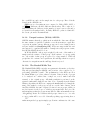
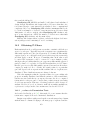
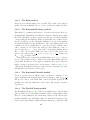
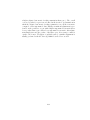
A brief description of the various statistical tests in GeneSpring GX appears below. See [26] for a simple introduction to these tests.
14.1
Details of Statistical Tests in GeneSpring GX
14.1.1
The Unpaired t-Test for Two Groups
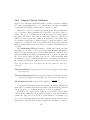
The standard test that is performed in such situations is the so called t-test,
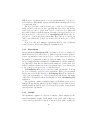
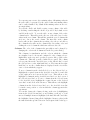
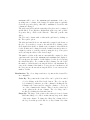
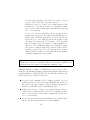
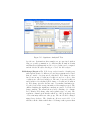
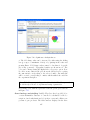
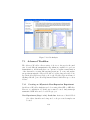
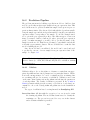
which measures the following t-statistic for each gene g (see, e.g., [26]):
2
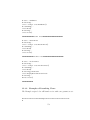
tg = smm1 −m
−m
1
2
r
(n −1)s2 +(n −1)s2
1
2
1
2
( n11 + n12 ) is the unbiased pooled variwhere sm1 −m2 =
n1 +n2 −2
ance estimate.
Here, m1 , m2 are the mean expression values for gene g within groups
1 and 2, respectively, s1 , s2 are the corresponding standard deviations, and
n1 , n2 are the number of experiments in the two groups. Qualitatively, this
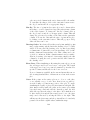
t-statistic has a high absolute value for a gene if the means within the two
sets of replicates are very different and if each set of replicates has small
standard deviation. Thus, the higher the t-statistic is in absolute value,
the greater the confidence with which this gene can be declared as being
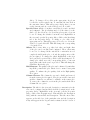
differentially expressed. Note that this is a more sophisticated measure than
the commonly used fold-change measure (which would just be m1 −m2 on the
451