1
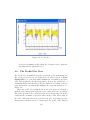
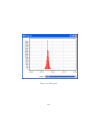
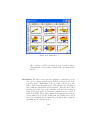
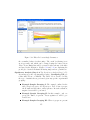
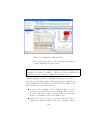
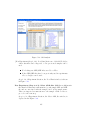
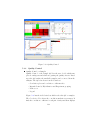
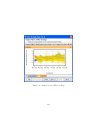
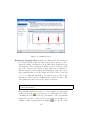
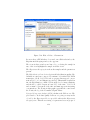
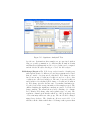
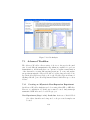
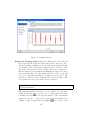
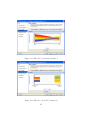
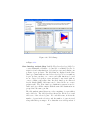
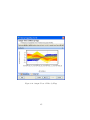
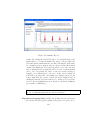
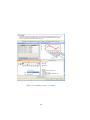
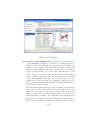
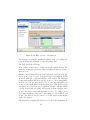
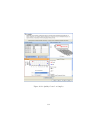
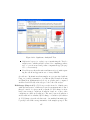
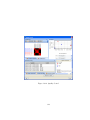
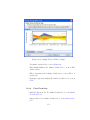
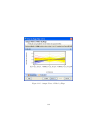
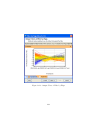
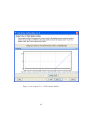
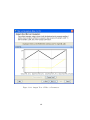
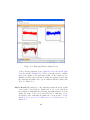
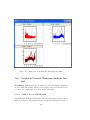
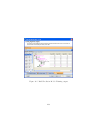
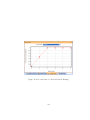
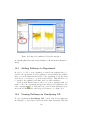
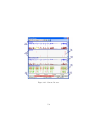
Visualization: The Profile Plot displays the mean profile over all rows by
default. This can be hidden by unchecking the Display Mean Profile
check box.
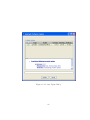
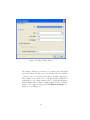
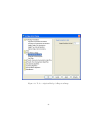
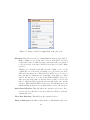
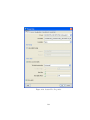
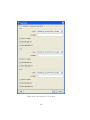
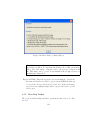
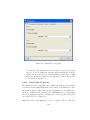
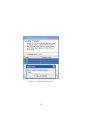
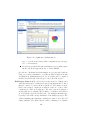
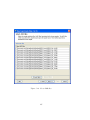
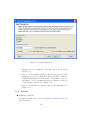
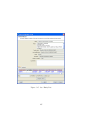
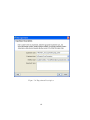
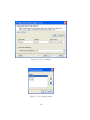
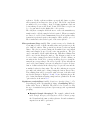
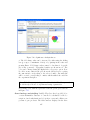
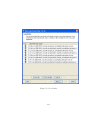
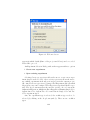
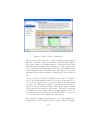
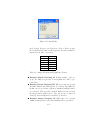
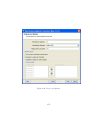
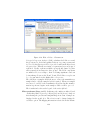
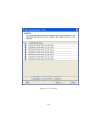
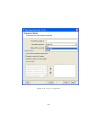
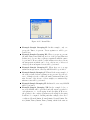
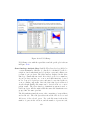
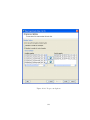
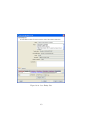
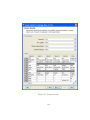
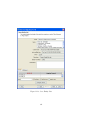
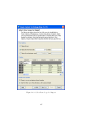
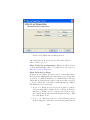
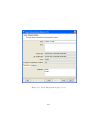
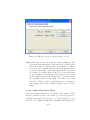
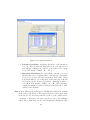
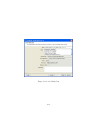
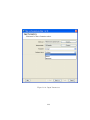
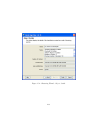
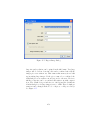
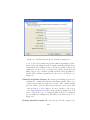
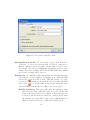
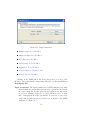
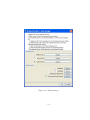
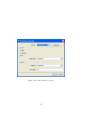
The colors of the Profile Plot can be changed from the properties
dialog. The colors of the profile plot can be changed from this dialog.
You can choose a fixed color or use one of the data columns to color
the profile plot by choosing a column from the drop-down list. The
colors range of the profile plot and the middle color can be customized
by clicking on the Customize button and choosing the minimum color,
the middle color and the maximum color. By default, the minimum
color is set to the median value of the data column.
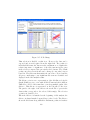
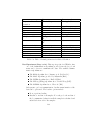
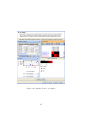
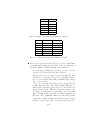
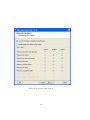
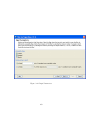
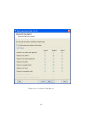
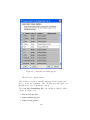
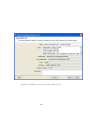
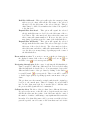
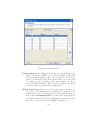
Rendering: The rendering of the fonts, colors and offsets on the Profile
Plot can be customized and configured.
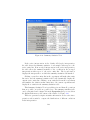
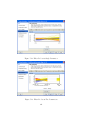
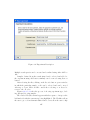
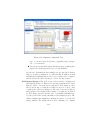
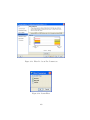
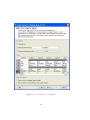
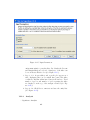
Fonts: All fonts on the plot can be formatted and configured. To
change the font in the view, Right-Click on the view and open the
Properties dialog. Click on the Rendering tab of the Properties
dialog. To change a Font, click on the appropriate drop-down
box and choose the required font. To customize the font, click on
the customize button. This will pop-up a dialog where you can
set the font size and choose the font type as bold or italic.
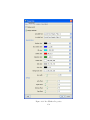
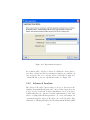
Special Colors: All the colors that occur in the plot can be modified
and configured. The plot Background color, the Axis color, the
Grid color, the Selection color, as well as plot specific colors can
be set. To change the default colors in the view, Right-Click on
the view and open the Properties dialog. Click on the Rendering
tab of the Properties dialog. To change a color, click on the
appropriate arrow. This will pop-up a Color Chooser. Select the
desired color and click OK. This will change the corresponding
color in the View.
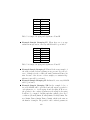
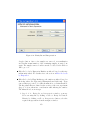
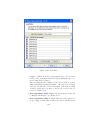
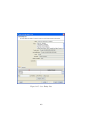
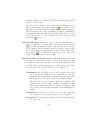
Offsets: The bottom offset, top offset, left offset, and right offset
of the plot can be modified and configured. These offsets may
be need to be changed if the axis labels or axis titles are not
completely visible in the plot, or if only the graph portion of the
plot is required. To change the offsets, Right-Click on the view
and open the Properties dialog. Click on the Rendering tab. To
change plot offsets, move the corresponding slider, or enter an
appropriate value in the text box provided. This will change the
particular offset in the plot.
117