1
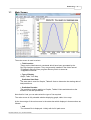
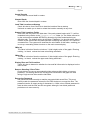
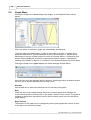
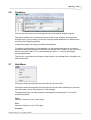
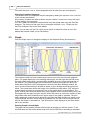
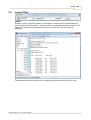
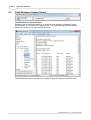
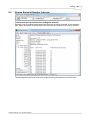
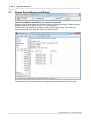
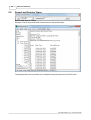
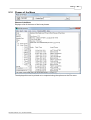
Technical
55
curve as dots.
Line Aground: Click to select the aground colour - i.e. the colour used to plot the
curve when the vessel would be aground (UKC<0)
Month
A vertical line is drawn at 00:00 on the beginning of each Calendar month.
Line Colour: Click to select colour.
Line Width: Enter the line width in pixels.
Line Style: Click to select the style - this only applies when the line width is one pixel.
Line Height: Enter as a percentage of graph height.
Now
Displays a vertical line representing the current time in Graph Units when the Now
checkbox is ticked.
Line Colour: Click to select colour.
Line Width: Enter the line width in pixels.
Line Style: Click to select style.
Line Height: Enter as a percentage of graph height.
Line Interval: Enter the update interval for graph and line redraws in seconds.
Under Keel Clearance (UKC)
The UKC Line is drawn horizontally on the graph at the tidal height where the vessel
would just ground i.e. at vessel draught - charted depth. Note that the graph line colour is
changed according to whether the vessel is afloat or aground. These colours are set in
Plot above.
UKC Line Colour: Click to select colour.
UKC Line Width: Enter the line width in pixels.
UKC Line Style: Click to select the style - this only applies when the line width is one
pixel.
Time Cursor Line
Line Colour: Click to select colour
Line Width: Enter in pixels
Line Style: Click to select the style - this only applies when the line width is one pixel.
High and Low Turning Points
HiLo Normal: Click the colour box to select the colour of those turning points which
are not highlighted
Size: Enter box size in pixels
HiLo Highlight: Click the colour box to select the colour of the turning point which is
highlighted.
Edge checkbox.: Click to select whether or not the box edge is displayed
Moon
Center Colour: Click to select colour
Size: Enter diameter in pixels
Position from Top: Enter distance from top of graph frame to moon center in pixels
Edge Colour: Click to select colour
Edge Thickness: Enter edge thickness in pixels
Background (Night / Day / Paper)
The paper background colour is the colour which surrounds the graph (white below).
The night colour is the colour of the graph background at night (grey below). The day
colour is the colour of the graph background at day (cream below). Click the Night /
Day / Paper coloured squares to select the appropriate colour.
GeoTide Predictor 3.0.x, © 2015 Geomatix