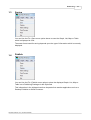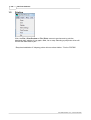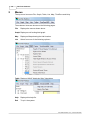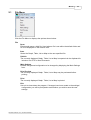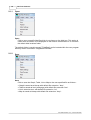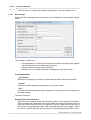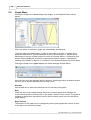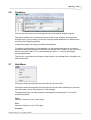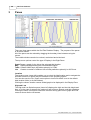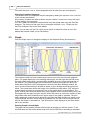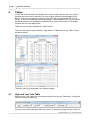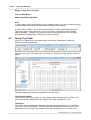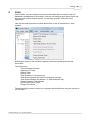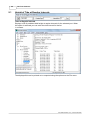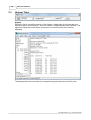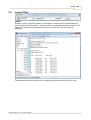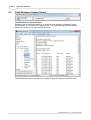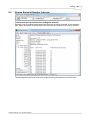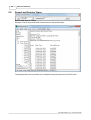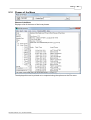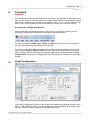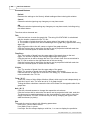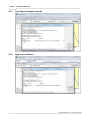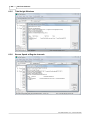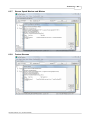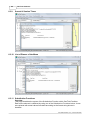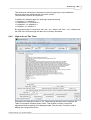
1
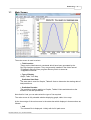
30
GeoTide Predictor
Files with extension .enc or .tid are displayed while all other files are not displayed.
Changing Locations Displayed
The location which are displayed may be changed by adding the relevant .tid or .enc files
to the relevant sub-folders.
Any number of folders and tidal locations may be created - however too many will result
in slow loading of the program.
You can create new harmonic constants files from tide gauge data using the GeoTide
Analyzer. The files are of the type (.tid) or encrypted versions (.enc). Please see the
GeoTide Analyzer help file for more details.
Note: You can also use the File | Open menu option to load a file which is not in the
default tidal location folder (or its sub-folders)
3.3
Graph
Click the Graph menu to change the display to the Graphical Pane (shown below)
The window contains a frame containing the zoom and cursor controls and graphical
pane. The graph displays a curve showing tidal height, and the high and low tide times
as small square boxes with a corresponding sizeable list on the lower left hand side of
the window. The graph background is coloured for daytime and night-time and if the
Under Keel Clearance (UKC) settings box is ticked in the Main Settings window, the
curve is coloured according to whether a vessel of given draught would be aground or
afloat. The vertical axis shows the height of the tide above chart datum (CD), while the
charted depth is shown as a horizontal line on the graph relative to chart datum. The
green vertical and horizontal dotted lines are the graphic cursor readout facility which can
be dragged left and right using the mouse. When the mouse is moved the readout of tide
height and under keel clearance at the upper edge of the graph is updated. The time
now is displayed a vertical purple dotted line provided the Now checkbox is ticked on the
Graph Settings Window. In this case the predicted rise and fall to the next high and low
tides is also drawn in a dotted line. This information is also displayed in the lower status
bar on the window.
Panning Graph Left and Right
The graph can be panned (moved left and right) by dragging it with the mouse. To do
this hold down the left mouse button and move the mouse cursor according to standard
GeoTide Predictor 3.0.x, © 2015 Geomatix