1
GeoTide Predictor
GeoTide Predictor User Guide
The software described in this document is provided under licence and may only be used
in accordance with the terms of the agreement.
Whilst every attempt has been made to ensure that the information contained within this
document is free from error, Geomatix cannot be held responsible for any damage,
whether arising directly or indirectly, which is attributed to any omissions or errors.
The specifications contained in this document may be subject to change without notice.
Document: GeoTide Predictor User Manual
Geomatix Ltd
Stonelea
North Street
Barrow Upon Humber DN19 7AP
United Kingdom
www.geomatix.net
GeoTide Predictor 3.0.x, © 2015 Geomatix
Contents
3
Table of Contents
Part I Overview
6
1 Main Screen
................................................................................................................................... 7
2 Getting Started
................................................................................................................................... 8
3 Saving ................................................................................................................................... 11
4 Publish ................................................................................................................................... 11
5 Printing ................................................................................................................................... 12
Part II Menus
14
1 File Menu................................................................................................................................... 15
Open
.........................................................................................................................................................
Save
.........................................................................................................................................................
Publish .........................................................................................................................................................
Main Settings
.........................................................................................................................................................
Main Settings
..................................................................................................................................................
Print Preview
.........................................................................................................................................................
Print
.........................................................................................................................................................
Exit
.........................................................................................................................................................
16
16
17
17
18
20
20
21
2 Graph Menu
................................................................................................................................... 22
3 Map Menu
................................................................................................................................... 23
4 List Menu................................................................................................................................... 23
5 Table Menu
................................................................................................................................... 24
6 TimeZone
................................................................................................................................... 25
7 Help Menu
................................................................................................................................... 25
28
Part III Panes
1 Panes
................................................................................................................................... 29
2 Location ................................................................................................................................... 29
3 Graph
................................................................................................................................... 30
4 Table
................................................................................................................................... 33
5 Map
................................................................................................................................... 34
Part IV Tables
36
1 High and...................................................................................................................................
Low Tide Table
36
2 Hourly Tide
...................................................................................................................................
Table
38
Part V Lists
41
1 Height of...................................................................................................................................
Tide at Regular Intervals
42
2 High and...................................................................................................................................
Low Waters
43
GeoTide Predictor 3.0.x, © 2015 Geomatix
4
GeoTide Predictor
3 Highest Tides
................................................................................................................................... 44
4 Lowest Tides
................................................................................................................................... 45
5 Tidal Windows
...................................................................................................................................
(Access Times)
46
6 Stream Speed
...................................................................................................................................
at Regular Intervals
47
7 Stream Speed
...................................................................................................................................
Maxima and Minima
48
8 Fastest Streams
................................................................................................................................... 49
9 Sunset and
...................................................................................................................................
Sunrise Times
50
10 Phases of
...................................................................................................................................
the Moon
51
53
Part VI Technical
1 Graph Configuration
................................................................................................................................... 53
2
Map Configuration
................................................................................................................................... 56
3
List Configuration
................................................................................................................................... 56
Tide Height
.........................................................................................................................................................
at Regular Intervals
High and .........................................................................................................................................................
Low Waters
Highest Tides
.........................................................................................................................................................
Lowest Tides
.........................................................................................................................................................
Tidal Height
.........................................................................................................................................................
Windows
Stream Speed
.........................................................................................................................................................
at Regular Intervals
Stream Speed
.........................................................................................................................................................
Maxima and Minima
Fastest Streams
.........................................................................................................................................................
Sunset & .........................................................................................................................................................
Sunrise Times
List of Phases
.........................................................................................................................................................
of the Moon
Substitution
.........................................................................................................................................................
Functions
58
58
59
59
60
60
61
61
62
62
62
4 Table Configuration
................................................................................................................................... 63
Hourly Tide
.........................................................................................................................................................
Table
High and .........................................................................................................................................................
Low Tide Table
64
65
68
Index
GeoTide Predictor 3.0.x, © 2015 Geomatix
Part
I
Overview
6
1
GeoTide Predictor
Overview
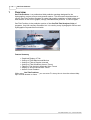
GeoTide Predictor is a professional tidal prediction package designed for the
hydrographer, marine surveyor and general mariner. This document describes how to
use the GeoTide Predictor program to create high quality predictions of tidal height and
tidal streams in the from of graphs, listings, tide tables and printouts of various types.
GeoTide Predictor is the prediction portion of the GeoTide Tidal Analyzer Suite of
programs, from UK company Geomatix Ltd. It is used by many Hydrographic Offices and
Hydrographic Departments world-wide.
Feature Summary
·
·
·
·
·
·
·
Graphical Display of Tide
Listings of Tidal Maxima and Minima
Listings of Tide at Regular Intervals
Listings of Tidal Windows (Access Times)
Tables of Tide Height in Admiralty Style Format
Display of Sunrise and Sunset Times
Instant Cursor Readout.
While using GeoTide Predictor, you can enter F1 at any time to view the relevant help
topic for that window or frame.
GeoTide Predictor 3.0.x, © 2015 Geomatix
Overview
1.1
7
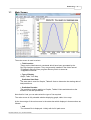
Main Screen
The main screen is used to select:· Tidal Location
These are the tidal harmonic constants which have been generated by the
GeoTide Analyzer program. They are generally installed in the folder named
"\TidalData" within the user program directory which is stored at
"%appdata%\Geotide".
· Type of Display
Graph, Table, List, Map
· Prediction Start Date
The start date is used for Graphs, Tables & Lists to determine the starting date of
tidal predictions.
· Prediction Duration
The prediction duration applies to Graphs, Tables & Lists and determines the
duration of the tidal predictions.
Note that for Lists you can also select the type of List required.
The main screen is fully sizeable whether displaying graph, table, list or map.
At the lower edge of the main screen is the status bar which displays in three sections as
follows:· Left
The selected file is displayed - initially with its full path name.
GeoTide Predictor 3.0.x, © 2015 Geomatix
8
GeoTide Predictor
· Centre
The Tidal Location Name stored within the loaded file and also the now time used
for displaying the now cursor line.
· Right
Cursor date-time or, if the window is being re-sized by the user, the image size in
pixels.
This latter is useful for printing or exporting the image to the clipboard.
Note that all date-times are displayed in the time zone as displayed.
1.2
Getting Started
To run the program click the GeoTide Predictor on your start menu, or click the
GeoTide Predictor icon on the desktop or click the executable file "GeoTide_Predictor"
or Predictor.
The program should first displays a splash screen while the various tidal locations are
loading and the folder structure is being examined.
Click OK to proceed to the main GeoTide Predictor screen.
GeoTide Predictor 3.0.x, © 2015 Geomatix
Overview
9
To make tidal predictions of tidal height or tidal streams you must first select a location.
You will see several tidal locations displayed in the left hand panel. The exact display
automatically mirrors the folder tree which contain the harmonic constants files on your
computer. The harmonic constants files used by GeoTide Predictor have the file
extensions ".tc1", ".tc2" and their encrypted files ".enc". If none are shown it is because
you do not have any tidal locations in the default folder. In this case you can click
File|Open to load a file from elsewhere.
1. Selecting a Tidal Location
To load a tidal location click the appropriate location at the left hand side of the
screen. It operates in just the same way as windows explorer and other file managers,
just click the folders with the mouse to expand or collapse them and to display their
contents. Only those folders containing suitable files will be displayed.
2. Creating a Graph
Clicking a valid tidal location on the left hand side creates a tidal graph for today spanning one day. It also enables all of the relevant top menus so you can view a map
and create tide tables and tide listings. By clicking the Graph top menu option you can
change the start date and time and the number of days displayed.
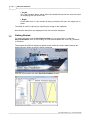
3. Creating a Map
To view the location on a map, click the Map top menu option - this displays a map
from a web based map service provider, such as Google maps or Open Street Map.
This option requires that your computer has access to the internet. The map operation
and its appearance depends upon the map service provider specified in your map
configuration settings.
4. Creating Lists
You can create text based listings (using the top menu option Lists) of the following:
Tides at Regular Intervals,
High and Low Tides,
Highest Tides,
Lowest Tides,
Tidal Windows (i.e access times)
Tidal Stream Speeds and Direction,
Tidal Stream Maximum Speed and Minimum Speed (slack tide)
Fastest Predicted Tidal Streams
Sunset and Sunrise Times
Phases of the Moon,
GeoTide Predictor 3.0.x, © 2015 Geomatix
10
GeoTide Predictor
These can all be exported to the clipboard (using the File | Export option) or printed
out (using the File | Print option) as required.
5. Creating Tables
Click the top menu option Tables to produce web ready and pdf ready tide tables* of
tidal heights, with two different types of table available - Tables of High and Low Tides
and Tables of Hourly Tides. These layouts mirror as closely as possible the "industry
standard" UKHO Admiralty style. The tables can be exported as html web pages to the
clipboard, or saved as html or printed as pdf*
* These options require the Tables publishing option and the use of a third party pdf
printer driver.
GeoTide Predictor 3.0.x, © 2015 Geomatix
Overview
1.3
11
Saving
You can Use the File | Save menu option above to save the Graph, List, Map or Table
which is displayed to a file.
The exact format used for saving depends upon the type of information which is currently
displayed.
1.4
Publish
You can Use the File | Publish menu option to place the displayed Graph, List, Map or
Table into a Publishing Package via the Clipboard.
This information in the clipboard can then be pasted into another application such as a
Desktop Publisher or Word Processor.
GeoTide Predictor 3.0.x, © 2015 Geomatix
12
1.5
GeoTide Predictor
Printing
Click the File | Print Preview or File | Print menus to preview and or print the
displayed data, whether it is a graph, table, list or map. Selecting a pdf printer driver will
convert the table data to pdf*.
* Requires installation of 3rd party printer driver such as Adobe / Foxit or PDF995.
GeoTide Predictor 3.0.x, © 2015 Geomatix
Part
II
Menus
14
2
GeoTide Predictor
Menus
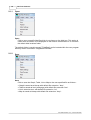
The top menu items are File, Graph, Table, List, Map, TimeZone and Help.
The submenu items are shown on the following pages.
File
Displays the menus shown above.
Graph Displays a self-scaling tidal graph
Map
Displays a Map showing the tidal location.
List
Select from one of the following options:-
Table Displays UKHO "Admiralty Style" tide tables.
Help
Displays this help file.
Exit
To quit the system.
GeoTide Predictor 3.0.x, © 2015 Geomatix
Menus
2.1
15
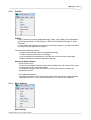
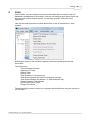
File Menu
Click the File Menu to displays the options shown below
File
Open
Selects and opens a tidal file. Used when a file is not within the default folder and
so is not displayed on the location tree..
Save
Saves the Graph, Table, List or Map to the user specified file.
Publish
The currently displayed Graph, Table, List or Map is exported via the clipboard for
inclusion in a DTP or Word Processor.
Main Settings
Enables the general configuration to be changed by displaying the Main Settings
form.
Print Preview
The currently displayed Graph, Table, List or Map may be previewed before
printing.
Print
The currently displayed Graph, Table, List or Map is printed.
Exit
Use exit to close down the program. If changes have been made to the settings /
configuration you will be prompted to ask whether you wish to save the new
settings.
GeoTide Predictor 3.0.x, © 2015 Geomatix
16
2.1.1
GeoTide Predictor
Open
Open
Click to open a specific tidal file which is not shown on the tidal tree. This option is
useful when a location is not displayed on the location tree because it is not within
the default tidal locations folder.
The default folder is usually named "\TidalData" and is located within the user program
directory which is stored at "%appdata%\Geotide".
2.1.2
Save
Save
Click to save the Graph, Table, List or Map to the user specified file as follows:·
·
·
·
Graph is saved as a bitmap with default file extension '.bmp'.
Table is saved as html (web page) with default file extension 'htm'.
List is saved as text with default file extension 'txt'.
Map is saved as bitmap with default file extension '.bmp'..
GeoTide Predictor 3.0.x, © 2015 Geomatix
Menus
2.1.3
17
Publish
Publish
Click to place the currently displayed Graph, Table, List or Map in the clipboard for
onward incorporation in a document in a Desk Top Publishing Package or Word
Processor.
In most cases, the clipboard contents can be directly viewed in e.g. Microsoft Word
by using its Paste-Special menu option.
The data is formatted as follows:· Graph is exported as a device independent bitmap.
· Table is exported as an html (web page).
· List is exported as standard text, Unicode text and as an html (web page).
· Map is exported as device independent bitmap.
Alternative Export Routes
· Via a Printer Driver.
If you have a suitable 3rd party printer driver installed you can use the Print menu
to export documents via a printer driver.
For example you can install the Adobe or Foxit printer drivers to export the
documents in PDF.
· Via Clipboard Selection.
On tables and lists you can right click the pane itself and use the usual windows
keyboard shortcuts - Ctrl A to select all and Ctrl C to copy to the clipboard.
2.1.4
Main Settings
Main Settings
GeoTide Predictor 3.0.x, © 2015 Geomatix
18
GeoTide Predictor
Click this option to change the general configuration on the main settings form.
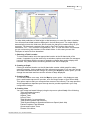
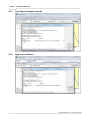
2.1.4.1
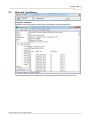
Main Settings
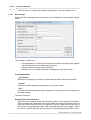
Clicking the File | Settings menu on the main screen displays the main settings window
below.
This window is used to set:· The appearance of Under Keel Clearance Information throughout the program
which is displayed on the Graph and List panes.
· The path (folder location) to the tidal data.
· Whether the rise and fall information is displayed on the main screen.
Command Buttons
· Use Default
Restores the settings to the 'factory' default settings without closing this window.
· Cancel
Closes the window ignoring any changes you may have made.
· OK
Closes the window implementing any changes you may have made, including using
the default button.
The active items are:
Display Under Keel Clearance
Check this box to display Under Keel Clearance (UKC) on the graph and list panes.
When activated the vessel draft and charted depth are used to calculate the level at
which the vessel would just float / run aground. This line, called here the UKC line, is
also drawn on the graph and is also used to change the colour of the graph. On the
list view it is used to calculate the tide windows (clear passage times) and the UKC
GeoTide Predictor 3.0.x, © 2015 Geomatix
Menus
19
figures.
Vessel Draught
Enter here the vessel draft in meters.
Charted Depth
Enter here the charted depth in meters.
Load Tidal Locations at Startup
Check this box to force GeoTide to load the locations files at startup.
Uncheck to enable you to load or reload the location manually at any time.
Startup Tidal Locations Folder
Enter here the the path to the tidal data. If the path entered begins with "\" it will be
treated as being relative to the "%APPDATA%\Geotide" folder (i.e. the folder referred to
by the environment variable APPDATA) otherwise it will be treated as being an
absolute path. The default setting is the folder \TidalData. You should ensure there is
a folder of this name within the path specified containing the relevant '.tc1' harmonic
constants files. The system also searches the sub-folders of this folder, enabling you
to set up a cascading folder structure on the main screen display.
YMin (m)
The value in this box fixes the minimum Y (tide height) value of the graph. Entering
nothing, i.e. blank, makes the lower axis setting automatic.
YMax (m)
The value in this box fixes the maximum Y (tide height) value of the graph. Entering
nothing, i.e. blank, makes the upper axis setting automatic.
Display Rise and Fall from Now
Check this box to determine whether the rise and fall information is displayed on the
main screen.
Remove Standing / Extra Tides
Check this box to remove extra standing tides where multiple highs or lows are
predicted. This setting affects the turning points identified on the graph,the tidal
listing of high and low tides and the tide table.
Encryption Password
The password used internally to read the encrypted tidal record files. This must
exactly match the password entered in GeoTide Analyzer to encrypt the files. The
password can be an empty string of characters i.e. blank, when a blank password is
used at either end the files are still encrypted, although a non blank password
provides much more security.
GeoTide Predictor 3.0.x, © 2015 Geomatix
20
2.1.5
GeoTide Predictor
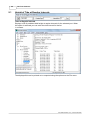
Print Preview
Print Preview
Click this option to preview the currently displayed Graph, Table, List or Map before
printing. Here the scale, orientation and headers and footers may be defined. The
exact nature of the displayed window depends upon your computer operating system
(Microsoft Windows version) and your installed version and set up of Microsoft
Windows Explorer.
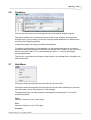
2.1.6
Print
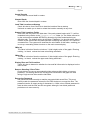
Print
Click to print the currently displayed Graph, Table, List or Map. The exact nature of
the displayed window depends upon your computer operating system (Microsoft
Windows version) and your installed version and set up of Microsoft Windows
Explorer. Selecting a pdf printer driver will convert the tables, listings or graphs to
pdf*.
The printer output may be further scaled using the Print Preview menu options. The
exact nature of the Print Preview Window depends upon the setup and operating system
of your computer.
GeoTide Predictor 3.0.x, © 2015 Geomatix
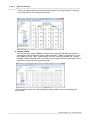
Menus
21
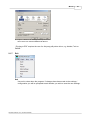
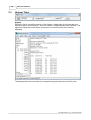
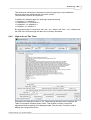
Print Option in Windows XP showing installed printer device
drivers in this case Foxit and PDF99 Printer Devices
* Printing to PDF requires the use of a 3rd party pdf printer driver, e.g. Adobe, Foxit or
Pdf995.
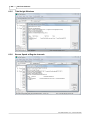
2.1.7
Exit
Exit
Use exit to close down the program. If changes have been made to the settings /
configuration you will be prompted to ask whether you wish to save the new settings.
GeoTide Predictor 3.0.x, © 2015 Geomatix
22
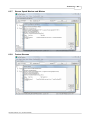
2.2
GeoTide Predictor
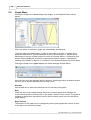
Graph Menu
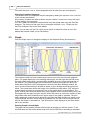
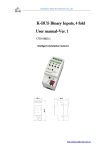
Clicking the Graph menu once changes the display to the Graphical Pane (shown
below).
When you select a location the graph will automatically be displayed.
The graph pane can display either a graph of the height of the tide or a graph of the
speed of a tidal stream. Tidal streams can be either 1Dimensional or 2Dimensional,
depending on the type of tidal location file which is selected. When a 2Dimension tidal
stream is being displayed, arrows are superimposed upon the graph, indicating the
heading of the stream in degrees. If a location is not selected the pane will remain blank.
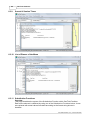
Clicking the Graph menu again displays the Graph Settings Window below.
Here you can enter the start date and the duration. Checking the Now checkbox causes
the time now to also be displayed as a moving cursor.
Date box
Use the date box to select the date and time for the start of the graph.
Now
Check the box on the Graph Settings Window to create a graph which displays the
current time and date at a fixed point on the graph - default is set to center. The graph is
redrawn at regular time intervals so the time axis will slowly scroll to the left across the
graph display.
Days Text box
The duration of the graph may be changed by entering the appropriate number of days
in the days in the text box provided.
GeoTide Predictor 3.0.x, © 2015 Geomatix
Menus
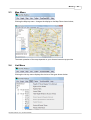
2.3
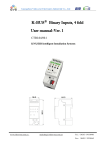
Map Menu
Clicking the Map top menu changes the display to the Map Pane shown below,
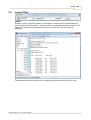
The exact operation of the map depends on your chosen internet map provider
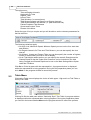
2.4
List Menu
Clicking the List top menu displays the choice of list types shown below.
GeoTide Predictor 3.0.x, © 2015 Geomatix
23
24
GeoTide Predictor
The options are:Tides at Regular Intervals
High and Low Tides
Highest Tides
Lowest Tides
Tidal Windows (i.e access times)
Tidal Stream Speeds and Direction at Regular Intervals
Tidal Stream Maxima and Minima (i.e. peak and slack tide)
Fastest Predicted Tidal Streams
Sunset and Sunrise Times
Phases of the Moon
Select the type of list you require and you will be able to set the relevant parameters for
that list selection.
The following variations apply.
· On High, Low, Maximum Speed, Minimum Speed you can set the font, start date
and duration.
· On Regular Intervals for Tides and Tidal Streams you can also specify the time
interval.
· On Highest , Lowest and Fastest Tides you can also specify the number of highest,
lowest, or fastest tides you wish to list for display.
· On all Tidal Height related options you can specify the vessel's Draught and the
Charted Depth so that the Under Keel Clearance can be included on the tidal
listing. Draught and Charted Depth can be set on the Main Settings Menu Option
under the File Menu
Click Go to fill the list pane with the requested list. A progress window is displayed
whilst the requested list is being prepared. During this list preparation phase you can
click Abort on the progress window to cancel the process.
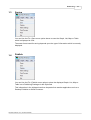
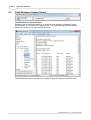
2.5
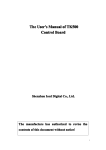
Table Menu
Clicking the Table menu displays the choice of table types - High and Low Tide-Table or
Hourly Tide-Table
Clicking Go fills the table pane with an "Admiralty Style" Tide Table. A progress window
is displayed whilst the requested table is being prepared. During the preparation phase
you can click the button labelled Abort on the progress window to cancel the process.
GeoTide Predictor 3.0.x, © 2015 Geomatix
Menus
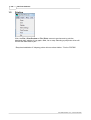
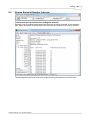
2.6
25
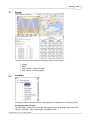
TimeZone
Click the top time zone menu to change the time zone used for display purposes.
This facility enables you to manually account for time zone changes, for example for
Daylight Saving Time or when you require to display a tidal prediction in a different time
zone from that originally specified.
It affects the graph, tide listing and table listing facilities.
For safety the facility does not automatically use the daylight savings time corrections
provided by Microsoft Windows as these are not always 100% reliable. In any event most
mariners use either GMT (UT) or the standard time zone i.e. without the daylight
savings adjustments.
The value is not stored and the system always starts in the standard time recorded in the
tidal constants file.
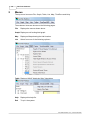
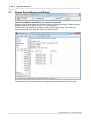
2.7
Help Menu
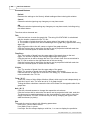
Clicking the help menu displays the help sub menu shown below.
Clicking the help menu displays the help sub menu shown which enables you to access
the help system via the index,search or contents page.
The appropriate help can also generally be displayed by pressing the F1 key on the
computer keyboard.
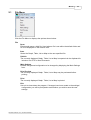
Index
Opens the help file on the "Index" page.
Find
Opens the help file on the "Find" page.
Contents
GeoTide Predictor 3.0.x, © 2015 Geomatix
26
GeoTide Predictor
Opens the help file on the "Contents" page.
Geomatix website
Opens a web browser on the Geomatix website.
About
Displays version and other information about this program.
GeoTide Predictor 3.0.x, © 2015 Geomatix
Part
III
Panes
28
3
GeoTide Predictor
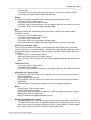
Panes
There are three panes within the GeoTide Predictor Display. The purpose of the panes
is as shown above.
All of the panes can be resized by dragging the boundary lines between using the
mouse.
The outside window can also be resized, maximised and minimised.
The top menu options control the type of Display in the Right Pane:Graph Draws a graph for the tide at the selected tidal location.
Map Displays a Map showing the selected tidal location.
Table Creates UKHO style tide tables primarily in HTML.
List Creates a number of different lists of tidal predictions primarily in ASCII text.
Location
The location pane (upper left) enables you to select the tidal location and to navigate the
file/folder structure in which they are situated on the operating system.
You can also use the File | Open menu option to load a file which is not in the default
tidal location folder (or its sub-folders)
Clicking the chosen location causes a tidal graph to be displayed in the Display Pane.
High and Low
The High and Low Selection pane (lower left) displays the high and low tide height and
time, or in the case of streams the maximum and minimum speeds, and their headings.
Clicking the items in this pane selects the relevant turning point on the graph and vice
versa as shown be the red arrows.
GeoTide Predictor 3.0.x, © 2015 Geomatix
Panes
3.1
29
Panes
The right hand pane can display the following types of information:·
·
·
·
3.2
Graphs
Maps
Tide Listings - 6 different types
Tide Tables - 2 different types
Location
Clicking the chosen location causes a tidal graph to be displayed in the Display Pane.
Changing the Root Folder
The root folder is specified in the Main Settings panel and is generally set to the folder
named "TidalData" within the program installation folder.
GeoTide Predictor 3.0.x, © 2015 Geomatix
30
GeoTide Predictor
Files with extension .enc or .tid are displayed while all other files are not displayed.
Changing Locations Displayed
The location which are displayed may be changed by adding the relevant .tid or .enc files
to the relevant sub-folders.
Any number of folders and tidal locations may be created - however too many will result
in slow loading of the program.
You can create new harmonic constants files from tide gauge data using the GeoTide
Analyzer. The files are of the type (.tid) or encrypted versions (.enc). Please see the
GeoTide Analyzer help file for more details.
Note: You can also use the File | Open menu option to load a file which is not in the
default tidal location folder (or its sub-folders)
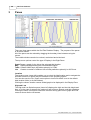
3.3
Graph
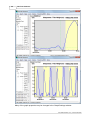
Click the Graph menu to change the display to the Graphical Pane (shown below)
The window contains a frame containing the zoom and cursor controls and graphical
pane. The graph displays a curve showing tidal height, and the high and low tide times
as small square boxes with a corresponding sizeable list on the lower left hand side of
the window. The graph background is coloured for daytime and night-time and if the
Under Keel Clearance (UKC) settings box is ticked in the Main Settings window, the
curve is coloured according to whether a vessel of given draught would be aground or
afloat. The vertical axis shows the height of the tide above chart datum (CD), while the
charted depth is shown as a horizontal line on the graph relative to chart datum. The
green vertical and horizontal dotted lines are the graphic cursor readout facility which can
be dragged left and right using the mouse. When the mouse is moved the readout of tide
height and under keel clearance at the upper edge of the graph is updated. The time
now is displayed a vertical purple dotted line provided the Now checkbox is ticked on the
Graph Settings Window. In this case the predicted rise and fall to the next high and low
tides is also drawn in a dotted line. This information is also displayed in the lower status
bar on the window.
Panning Graph Left and Right
The graph can be panned (moved left and right) by dragging it with the mouse. To do
this hold down the left mouse button and move the mouse cursor according to standard
GeoTide Predictor 3.0.x, © 2015 Geomatix
Panes
31
convention. When you have finished dragging simply release the left mouse button to
restore the cursor readout.
Zooming In and Out
The graph can be zoomed in or out by using the buttons labelled In and Out. When you
have finished zooming click the Cursor button to restore the cursor readout. You can
also click and drag the mouse to zoom in onto the portion of the graph you wish to
inspect.
GeoTide Predictor 3.0.x, © 2015 Geomatix
32
GeoTide Predictor
Many of the graph properties may be changed in the Graph Settings window.
GeoTide Predictor 3.0.x, © 2015 Geomatix
Panes
3.4
33
Table
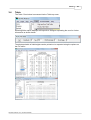
The Table Pane below is accessed via the Table top menu.
Selecting either option displays the respective dialogue requesting the user for further
information as shown below.
The displayed table of tidal heights can be printed out or exported using the options on
the File menu.
GeoTide Predictor 3.0.x, © 2015 Geomatix
34
3.5
GeoTide Predictor
Map
Clicking the Map menu changes the display to the Map Pane shown below,
The map displays the position of the tidal location which has been selected in the left
hand pane. The map automatically resizes when the main window is re-sized. Use the
cursor, pan and zoom in / out buttons to move the map and change its scale.
The map properties are set in the Map Settings window which is displayed by clicking the
settings button.
GeoTide Predictor 3.0.x, © 2015 Geomatix
Part
IV
Tables
36
4
GeoTide Predictor
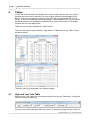
Tables
In GeoTide Predictor tables are designed as a layout object and are laid out in a more
complex way than Lists so that they can more closely resemble Hydrographic Office
Styles. Tables can be printed out (converted to PDF with an appropriate PDF Printer
Driver) or moved to a desktop publishing package. Tables should not be used to transfer
individual predictions to databases, spreadsheets or similar documents. For this latter
purpose lists are more appropriate.
Tables are not currently available for Tidal Streams.
There are two types of table available:- High and Low Tables and Hourly Tables, these
are shown below.
These are more fully described in the following pages.
4.1
High and Low Tide Table
High and Low Tide Tables can be accessed simply from the top Table Menu. Initially the
following window is displayed.
Here the user may set the start date, the number of months per page and the number of
GeoTide Predictor 3.0.x, © 2015 Geomatix
Tables
37
pages.
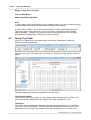
The table displays the following information in the title area:Tidal Location Name*
The main title place name, which can also display national scripts such as Arabic. This
text is derived from information held within the header in the tidal constants file (.tc1).
Time Zone*
Time Zone which is displayed is obtained from the options displayed on the Time Zone
top menu in GeoTide Predictor. The tidal predictions themselves take into account the
stated time zone recorded in the header in the tidal constants file (.tc1) and the time
zone requested in the Time Zone menu.
Year*
This year is derived from the date requested.
Tidal Location: Latitude and Longitude*
This position is derived from the information within the header in the tidal constants file (.
tc1)..
Within the body of the table there is a calendar style layout showing
Month Name*
Time of High and Low Water*
See the Main Settings Screen to determines the actions taken for extra tides and
standing tides.
GeoTide Predictor 3.0.x, © 2015 Geomatix
38
GeoTide Predictor
Height of High and Low water*
Full and New Moon*
Abbreviated Weekday Name*.
Note:
1. Above items deriving information from the header in the tc1 file can be edited by using
the port header editor within the tools menu of the GeoTide Analyser.
2. Above items marked * can all be formatted using the methods described within the
Technical Section, where there are many more layout, configuration and formatting
options available. However the reader should be thoroughly aware of the warnings
provided before attempting to change any of these settings.
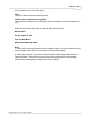
4.2
Hourly Tide Table
Hourly Tide Tables can be accessed simply from the top Table Menu. Initially the
following window is displayed.
Here the user may set the start date, the number of months per page and the number of
pages.
The table displays the following information in the title area:Tidal Location Name*
The main title place name, which can also display national scripts such as Arabic. This
text is derived from information in the header in the tidal constants file (.tc1).
Time Zone*
Time Zone which is displayed is obtained from the options displayed on the Time Zone
top menu in GeoTide Predictor. The tidal predictions themselves take into account the
stated time zone recorded in the header in the tidal constants file (.tc1) and the time
GeoTide Predictor 3.0.x, © 2015 Geomatix
Tables
39
zone requested in the Time Zone menu.
Year*
This year is derived from the date requested.
Tidal Location: Latitude and Longitude*
This position is derived from the information within the header in the tidal constants file (.
tc1)..
Within the body of the table there is a tabular style layout showing
Month Name*
Hourly Height of Tide*
Full and New Moon*
Abbreviated Weekday Name*.
Note:
1. Above items deriving information from the header in the tc1 file can be edited by using
the port header editor within the tools menu of the GeoTide Analyser.
2. Above items marked * can all be formatted using the methods described within the
Technical Section, where there are many more layout, configuration and formatting
options available. However the reader should be thoroughly aware of the warnings
provided before attempting to change any of these settings.
GeoTide Predictor 3.0.x, © 2015 Geomatix
Part
V
Lists
Lists
5
41
Lists
Unlike Tables, Lists are designed so that the information can be easily moved into
databases, spreadsheets or text editors. Lists are not designed as a layout object and
should not be used to transfer layouts. For this latter purpose Tables are more
appropriate.
Lists can be used to transfer individual predictions or sets of predictions to other
systems.
Selecting an option on the List Menu displays a window requesting the relevant
information.
The options are:Tides at Regular Intervals
High and Low Tides
Highest Tides
Lowest Tides
Tidal Windows (i.e access times)
Tidal Stream Speeds and Direction at Regular Intervals
Tidal Stream Maxima and Minima (i.e. peak and slack tide)
Fastest Predicted Tidal Streams
Sunset and Sunrise Times
Phases of the Moon
The displayed lists can be printed out or exported via the clipboard using the options on
the File menu.
GeoTide Predictor 3.0.x, © 2015 Geomatix
42
5.1
GeoTide Predictor
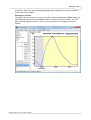
Height of Tide at Regular Intervals
Tides at Regular Intervals
Displays a list of predicted tidal height at regular intervals for the selected port. When
this option is selected you can enter the time interval for the list
in minutes.
The displayed list can be printed out or exported using the options on the File menu.
GeoTide Predictor 3.0.x, © 2015 Geomatix
Lists
5.2
43
High and Low Waters
High and Low Water
Displays a list of high and low water times and heights for the selected port.
The displayed list can be printed out or exported using the options on the File menu.
GeoTide Predictor 3.0.x, © 2015 Geomatix
44
5.3
GeoTide Predictor
Highest Tides
Highest
Displays a list of a specified number of the highest / lowest tides for the selected port.
When this option is selected you enter the number of highest/lowest tides required. The
highest or lowest are sorted by the computer into numerical order prior to being
displayed.
The displayed list can be printed out or exported using the options on the File menu.
GeoTide Predictor 3.0.x, © 2015 Geomatix
Lists
5.4
45
Lowest Tides
Lowest
Displays a list of a specified number of the highest / lowest tides for the selected port.
When this option is selected you enter the number of highest/lowest tides required. The
highest or lowest are sorted by the computer into numerical order prior to being
displayed.
The displayed list can be printed out or exported using the options on the File menu.
GeoTide Predictor 3.0.x, © 2015 Geomatix
46
5.5
GeoTide Predictor
Tidal Windows (Access Times)
Tidal Windows (i.e Access Times)
Displays a list of the access times for a vessel of given draught, a seaway of given
charted depth for the tides at the selected port. The vessel draught and the charted
depth are entered on the main settings windows.
The displayed list can be printed out or exported using the options on the File menu.
GeoTide Predictor 3.0.x, © 2015 Geomatix
Lists
5.6
47
Stream Speed at Regular Intervals
Tidal Stream Speeds and Direction at Regular Intervals
Displays a list of predicted tidal speed and direction at regular intervals for the selected
port. When this option is selected you can enter the time interval for the list in minutes.
The displayed list can be printed out or exported using the options on the File menu.
GeoTide Predictor 3.0.x, © 2015 Geomatix
48
5.7
GeoTide Predictor
Stream Speed Maxima and Minima
Tidal Stream Maxima and Minima (i.e. peak and slack tide)
Displays a list of peak speed and minimum speed for the selected port. Stream speed is
always greater than or equal to zero - it is never negative.
The direction if the stream is encoded via the angle not by the sign. The peak and
minimum speed are the absolute values for stream speed.
The displayed list can be printed out or exported using the options on the File menu.
GeoTide Predictor 3.0.x, © 2015 Geomatix
Lists
5.8
49
Fastest Streams
Fastest Predicted Tidal Streams
Displays a list of a specified number of the fastest tides for the selected port, and their
directions. When this option is selected you enter the number of fastest tides required.
They are sorted by the computer into numerical order prior to being displayed.
The displayed list can be printed out or exported using the options on the File menu.
GeoTide Predictor 3.0.x, © 2015 Geomatix
50
5.9
GeoTide Predictor
Sunset and Sunrise Times
Sunset and Sunrise Times
Displays a list of the sunrise and sunset times for the selected port.
The displayed list can be printed out or exported using the options on the File menu.
GeoTide Predictor 3.0.x, © 2015 Geomatix
Lists
5.10
51
Phases of the Moon
Phases of the Moon
Displays a list of the times of the lunar phases.
The displayed list can be printed out or exported using the options on the File menu.
GeoTide Predictor 3.0.x, © 2015 Geomatix
Part
VI
Technical
Technical
6
53
Technical
WARNING
The configurations options described within this section are intended for advanced users
only and are critical to normal operation. Changing these settings to inappropriate values
may result in deleterious operation and possible failure. If you are not familiar with
HTML, CSS, ASP and VBA you should not attempt to change any of these settings.
Accessing the Configuration Buttons
Having read and understood the above, if you are sure you wish to continue you can
access the configuration windows by following the instructions below.
On top menu options Graph, Lists, Tables and Map click the mouse on the top menu
bar while simultaneously depressing the Control key.
For the top menu option Map the configuration window is directly displayed. For the top
menu options Graph, Lists and Tables you also need to select the required sub-menu
option. At this point the usual window is displayed but with an additional button labelled
Configuration. Clicking this Configuration button will display the respective configuration
window.
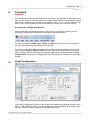
6.1
Graph Configuration
Clicking the Configuration button on the Graph Pane displays the settings window shown
above. This window is used to control the appearance and formatting of the graph. See
the main Technical page to display the Configuration button.
GeoTide Predictor 3.0.x, © 2015 Geomatix
54
GeoTide Predictor
Command Buttons
Default
Restores the settings to the 'factory' default settings without closing this window.
Cancel
Closes the window ignoring any changes you may have made.
OK
Closes the window implementing any changes you may have made, including using
the default button.
The other active elements are:
Title
Click the text box to enter the graph title. The string %LOCATION% is substituted
with the location contained in the TC1 file.
Y: The number of pixels down from the upper edge of the graph to the title text.
X: The number of pixels from the left hand edge of the graph only applies when using
align Left.
Align: Aligns the title to the left, center or right of the graph window.
Click the font text box to select the font and to set its properties bold italic and size.
Click the coloured square to select the font colour.
Time Zone
Top: The number of pixels from the upper edge of the graph down to the text.
Right: The number of pixels from the right hand edge of the graph.
Click the text box to add or change the text. The numeric time zone as contained in
the TC1 file is written to the right hand side of this text string .
Click the font text box to select the font and to set its properties bold italic and size.
Click the coloured square to select the font colour.
Y Units
Top: The number of pixels from the upper edge of the graph.
Right: The number of pixels from the left hand edge of the graph.
Click the text box to enter the X Units text. The string '(%)' is substituted with the
units contained in the TC1 file.
Ticks ( X / Y)
There are 3 sizes of ticks (Major, Medium, Minor) which may be set independently on
both the X and Y axis. The units are all in % of graph height.
Ticking the Mirror checkbox causes the ticks to be drawn on the opposite side of the
graph also.
Axis ( X / Y)
Click the coloured squares to change the respective axis colours.
Click the font text box to select the font and to set its properties bold, italic, and size.
The Axes may be positioned relative to the chart window in pixel units by using the
margin text boxes. The Axis Thickness may be set by changing the figure in the
width text boxes (in pixels).
Plot
The graph line may be varied with following parameters:
Line Colour: Click to select colour
Line Width: Enter in pixels
Line Style: Set 0 to always display a solid line, 1 or more to display the prediction
GeoTide Predictor 3.0.x, © 2015 Geomatix
Technical
55
curve as dots.
Line Aground: Click to select the aground colour - i.e. the colour used to plot the
curve when the vessel would be aground (UKC<0)
Month
A vertical line is drawn at 00:00 on the beginning of each Calendar month.
Line Colour: Click to select colour.
Line Width: Enter the line width in pixels.
Line Style: Click to select the style - this only applies when the line width is one pixel.
Line Height: Enter as a percentage of graph height.
Now
Displays a vertical line representing the current time in Graph Units when the Now
checkbox is ticked.
Line Colour: Click to select colour.
Line Width: Enter the line width in pixels.
Line Style: Click to select style.
Line Height: Enter as a percentage of graph height.
Line Interval: Enter the update interval for graph and line redraws in seconds.
Under Keel Clearance (UKC)
The UKC Line is drawn horizontally on the graph at the tidal height where the vessel
would just ground i.e. at vessel draught - charted depth. Note that the graph line colour is
changed according to whether the vessel is afloat or aground. These colours are set in
Plot above.
UKC Line Colour: Click to select colour.
UKC Line Width: Enter the line width in pixels.
UKC Line Style: Click to select the style - this only applies when the line width is one
pixel.
Time Cursor Line
Line Colour: Click to select colour
Line Width: Enter in pixels
Line Style: Click to select the style - this only applies when the line width is one pixel.
High and Low Turning Points
HiLo Normal: Click the colour box to select the colour of those turning points which
are not highlighted
Size: Enter box size in pixels
HiLo Highlight: Click the colour box to select the colour of the turning point which is
highlighted.
Edge checkbox.: Click to select whether or not the box edge is displayed
Moon
Center Colour: Click to select colour
Size: Enter diameter in pixels
Position from Top: Enter distance from top of graph frame to moon center in pixels
Edge Colour: Click to select colour
Edge Thickness: Enter edge thickness in pixels
Background (Night / Day / Paper)
The paper background colour is the colour which surrounds the graph (white below).
The night colour is the colour of the graph background at night (grey below). The day
colour is the colour of the graph background at day (cream below). Click the Night /
Day / Paper coloured squares to select the appropriate colour.
GeoTide Predictor 3.0.x, © 2015 Geomatix
56
6.2
GeoTide Predictor
Map Configuration
Clicking the Map top menu option while depressing the Control key displays the settings
window shown below.
This window is used to control the appearance and formatting of the displayed map.
The page may contain either the code for a web page (as above) or an http url string
such as
http://maps.googleapis.com/maps/api/staticmap?center=LATITUDE,
LONGITUDE&zoom=9&size=HEIGHTxWIDTH&maptype=terrain&markers=color:blue%
7CLATITUDE,LONGITUDE&sensor=false
or
http://www.openstreetmap.org/?mlat=LATITUDE&mlon=LONGITUDE#map=10/
LATITUDE/LONGITUDE
The page must contain the keywords LATITUDE and LONGITUDE and optionally NAME.
These are substituted with the respective data relating to the tidal location which has
been selected by the user.
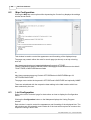
6.3
List Configuration
Refer to the main Technical page for instructions on how to display the Configuration
button.
Clicking the Configuration button on the List pane displays the Listing Program
window.
Each window is used to control the appearance and formatting of the displayed lists. The
edit windows are fully sizeable, and contain all of the instruction required to construct the
respective Listing in ASCII text.
GeoTide Predictor 3.0.x, © 2015 Geomatix
Technical
57
The command buttons function as follows:OK
Loads new changes into the system. They will be saved and used from this point
onwards whenever the GeoTide is run.
Cancel
Cancels the changes you may have made.
Default
Restores the default settings to those as initially provided by the program Geomatix.
Help
Provides this help page.
For example the listings below contain the instructions for the text list of High and Low
Tide
Each window may contain Substitution Functions which are used to insert the formatted
tidal and other data into the final text list.
The following tags are used to start and end the loop
<!-- DO --><!-- LOOP -->
Only one loop may be present.
The following pages contain the respective scripts for each type of list.
GeoTide Predictor 3.0.x, © 2015 Geomatix
58
GeoTide Predictor
6.3.1
Tide Height at Regular Intervals
6.3.2
High and Low Waters
GeoTide Predictor 3.0.x, © 2015 Geomatix
Technical
6.3.3
Highest Tides
.
6.3.4
Lowest Tides
GeoTide Predictor 3.0.x, © 2015 Geomatix
59
60
GeoTide Predictor
6.3.5
Tidal Height Windows
6.3.6
Stream Speed at Regular Intervals
GeoTide Predictor 3.0.x, © 2015 Geomatix
Technical
6.3.7
Stream Speed Maxima and Minima
6.3.8
Fastest Streams
GeoTide Predictor 3.0.x, © 2015 Geomatix
61
62
6.3.9
GeoTide Predictor
Sunset & Sunrise Times
6.3.10 List of Phases of the Moon
6.3.11 Substitution Functions
Overview
This page describes the syntax of the Substitution Function within GeoTide Predictor
Each active element is obtained by using one of the Substitution Functions below - these
are replaced with actual values formatted according to the format string shown in
brackets.
GeoTide Predictor 3.0.x, © 2015 Geomatix
Technical
63
Functions
FormatPortName()
FormatLatitude(DD° MM' Y)
FormatLongitude(DDD° MM' X)
FormatTimeZone(+HHHH)
FormatDuration(00.00)
FormatStartDate(dd mmm yyyy hh:nn)
FormatDraught("Vessel Draught: "0.00" m")
FormatChartedDepth("Charted Depth: "0.00" m")
FormatRowNumber()
FormatRowDate(dd mmm yyyy hh:mm)
FormatRowHeight(0.0)
FormatRowUKC("UKC: "0.0)
FormatYear(yyyy)
FormatMonthName("JANUARY,FEBRUARY,MARCH,APRIL,MAY,JUNE,JULY,
AUGUST,SEPTEMBER,OCTOBER,NOVEMBER,DECEMBER")
FormatDayNumber("#")
FormatDayName("Su,M,Tu,W,Th,Fr,Sa")
FormatMoon(H81,H98)
FormatTideHeight("0.0")
FormatSTreamSpeed("0.0")
Syntax
Each substitution function begins with the word "Format"
Only one of each Substitution Function can be present on any one page.
Substitution Function Parameters contained within the brackets()
The parameters take the general form of (<pre-text><format><post-text>)
Parameters
<pre-text> is a double quoted text string which is displayed before the actual data
<post-text> is a double quoted text string which is displayed after the actual data
<format> is an unquoted string identical to Microsoft Excel format string of VBA (Excel
etc)
If either the pre-text or post-text is not required it may be removed, including the quotes
so that for example
FormatChartedDepth("Charted Depth: "0.00), FormatChartedDepth(0.00" m") and
FormatChartedDepth(0.00) are all valid formats.
6.4
Table Configuration
Refer to the main Technical page for instructions on how to display the Configuration
button.
Clicking the Configuration button on the Table pane displays the Listing Program
window.
Each window is used to control the appearance and formatting of the displayed lists. The
edit windows are fully sizeable, and contain all of the instruction required to construct the
respective Listing in ASCII text.
The command buttons function as follows:OK
Loads new changes into the system. They will be saved and used from this point
GeoTide Predictor 3.0.x, © 2015 Geomatix
64
GeoTide Predictor
onwards whenever the GeoTide is run.
Cancel
Cancels the changes you may have made.
Default
Restores the default settings to those as initially provided by the program Geomatix.
Help
Provides this help page.
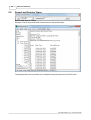
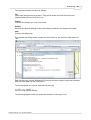
6.4.1
Hourly Tide Table
Clicking the Configuration button on the Table Settings Windows above displays the
Table Configuration Window shown below. This window is used to control the
appearance and formatting of the displayed table. See the main Technical page to
display the Configuration button.
The above editable and sizable window contains all of the instruction required to
construct the hourly table in HTML as a web page.
The buttons function as follows
OK load new changes into the system. They will be saved and used from this point
onwards whenever the GeoTide is run.
Cancel Cancels the changes you may have made.
Default restores the default settings to those as initially provided by the program
Geomatix.
Help provides this help page.
GeoTide Predictor 3.0.x, © 2015 Geomatix
Technical
65
Tidal and other information is inserted into the web page by the use substitution
functions which are detailed at the end of this section..
The permitted functions are listed are:In addition the following tags are used begin and end looping.
<!--daystart--><!--dayend-->
<!--monthstart--><!--monthend-->
<!--pagestart--><!--pageend-->
<!--docstart--><!--docend-->
By using these tags in conjunction with <td>, <tr>, <table> and </td>, </tr>, </table> and
the CSS inline format strings the table can be entirely formatted.
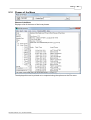
6.4.2
High and Low Tide Table
Clicking the Configuration button on the Table Settings Windows above displays the
Table Configuration Window shown below. This window is used to control the
appearance and formatting of the displayed table. See the main Technical page to
display the Configuration button.
GeoTide Predictor 3.0.x, © 2015 Geomatix
66
GeoTide Predictor
Command Buttons
Default: Restores the settings to the 'factory' default settings without closing this
window.
Cancel: Closes the window ignoring any changes you may have made.
OK: Closes the window implementing any changes you may have made, including
using the default button.
Other active elements are:
CSS Cell Format
The displayed table is internally produced using HTML which utilises the cell formatting
instructions displayed here. It uses CSS Internal Format Tags for each named cell. The
tag identifier is the name preceded by a '#' symbol. You can change these CSS format
tags to change the style and appearance of the displayed table. For example to change
the font size of the title from 18 pixels to 20 pixels change the number after 'font-size:' i.
e. '18' on the first row to '20'.
Each row determines the font, style and alignment of each field as shown below
CSS Tag Identifier
#Title
#SubTitle
#SubSubLeft
#SubSubCenter
#SubSubRight
#Month
#ColumnTitleDay
#ColumnTitleTime
#ColumnTitleHeight
#DayNumber
#Weekday
#MoonSymbol
td
Style of Table Fields
Title
Latitude and Longitude
Time Zone Field
Times and Heights of High and ....etc
Year
The Monthly column heading
The Day Column Heading
The Time Column Heading
The Tide Height Column Heading
The Day Number
The weekday abbreviation
The Moon Symbol
The style of each table element
Title Field
Type here the title of the table. The text "[Port Name]" is replaced with the actual name
for the tidal location.
Sub Title
These contain the latitude and longitude display. Text outside the '<' and '>' is displayed
literally. Text within '<' and '>' is a format string in which 'D' displays a degree digit, 'M'
displays Minutes and 'S' displays Seconds. A decimal place displays the decimal point.
So to display decimal degrees to three places use DD.DDD. The a cardinal character
NSEW is added automatically.
SubSub Left
Type here the time zone text which will appear on the left of the table header. The string
<HHMM> will be replaced by the actual time zone.
SubSub Center
Type here the central sub title e.g. TIMES AND HEIGHTS OF HIGH AND LOW
WATERS. The string will appear exactly as typed.
GeoTide Predictor 3.0.x, © 2015 Geomatix
Technical
67
SubSub Right
Type here the Year text which will appear on the right of the table header. The string
<YYYY> will be replaced by the actual year.
Month
Type here the names of the months to be used separated by commas.
Column Titles
These are the column headers for Weekday, Time and Height. Text entered here will
appear literally on the table.
Weekday Abbreviations
These are the weekday abbreviations to be used on the rows of the table.
Full/New Moon Unicode
This is the Unicode character specifies the symbol to be used for the Full and new Moon
symbols. The font to be used is specified in the CSS Cell Format Table above.
Break at Day Number
The table will contain a column break at this row and will restart at the top of the column
to the right, provided there are sufficient number of columns per month available (see
below)
Day-Time Spacing
Specifies the spacing between the Day column and the Time Column in pixels.
Time Ht Spacing
Specifies the spacing between the Time Column and the Height Column in pixels.
Column Spacing
Specifies the spacing between adjacent Columns in pixels.
Number of Columns Per Month
Specifies the number of Columns to be used for each month.
Row Spacing
Specifies the row spacing between adjacent rows in pixels.
GeoTide Predictor 3.0.x, © 2015 Geomatix
68
GeoTide Predictor
Index
-..tc1
6
-AAbbreviations 36, 38
abort 23, 24, 33
about 25
access 60
Admiralty 6, 24, 33, 36, 38, 41, 65
afloat 22, 30
aground 22, 30
arabic 36, 38
automatically 23
axis 22, 30
-Bbmp 16
border 34, 56
browse 16
-Ccancel 24, 33, 41
CD 22, 30
chart 22, 30
chart datum 22, 30
charted depth 22, 30
clearance 22, 30
clipboard 11, 15, 17
closing 21
color 56
colour 56
Colours 53
configuration 17, 36, 38
constants 6, 7, 36, 38
contents 25
controls 22, 30
copy 15
cursor
Curve
6, 23
22, 30, 53
-Ddate 24, 33, 41
datum 22, 30
Dawn 62
day 22, 30
daytime 22, 30
display 23
draught 22, 30
driver 12
duration 24, 33, 41
Dusk 62
-Eenc 16
ending 21
ESRI 34, 56
exit 15, 21
export 17
exporting 17
extra 36
-FF1 25
fastest 61
file 14, 15, 16, 36, 38
fill 34, 56
find 25
flood 59
Fonts 53
format 36, 38, 56
formatting 36, 38
full 36, 38
functions 62
-GGeomatix 25
Graph 7, 14, 22, 30, 53
graphic 6
graphical 22, 30
GeoTide Predictor 3.0.x, © 2015 Geomatix
Index
-Hharmonic 6, 7
header 36, 38
height 6, 22, 30, 36, 38, 58
help 14, 15, 25
help file 25
high 6, 22, 30, 33, 36, 41, 53, 56, 58
highest 59
HO 38
htm 16
HTML 16, 56
hydrographer 6
Hydrographic Office 38
-I-
-Nname 36, 38
national 36, 38
new 36, 38
night 22, 30
nighttime 22, 30
-Oopen
index 25
intervals 6, 58, 60
-Kkeel
minimum 61
Month 24, 33, 36, 38, 41, 65
moon 22, 30, 33, 36, 38, 41, 56, 62
Moon Phase 53
mouse 22, 30
22, 30
-Lland 34, 56
latitude 36, 38
layer 34, 56
layout 36, 38, 56
Lines 53
list 7, 14, 23, 56
location 7, 36, 38
locations 23
longitude 36, 38
low 6, 22, 30, 33, 36, 41, 53, 56, 58
lowest 59
lunar 22, 30, 33, 36, 38, 41, 56, 62
-Mmap 7, 14, 23, 34, 56
mariner 6
maximum 61
menu 14, 23, 24, 25, 33, 41
GeoTide Predictor 3.0.x, © 2015 Geomatix
16
-Ppan 23
panes 28
passage 6, 33, 41
phase 22, 30, 33, 41, 56, 62
phases 36, 38
place 36, 38
Plot 53
prediction 6
predictions 6
previewing 20
print 12, 15, 20
printer object. 15
printing 20
process 23
progress 23
-Qquickest 61
quit 21
-Rreadout 22, 30
regular 6, 60
resize 7
69
70
GeoTide Predictor
resizes 23
rise 33, 41
run 8
running 8
-Ssave 15, 16
save data 11
Saving 11
saving images 11
saving text 11
scale 23
screens 28
scripts 36, 38
sea 34, 56
search 25
select 7
selecting 7
set 33, 41
settings 15, 17, 23
Shapefile 34, 56
slack 61
speed 60, 61
standing 36
start 8
status bar 23
steps 8
stream 60, 61
style 24, 33, 41
substitution 62
Sun 33, 41, 62
Sunrise 6, 41, 53, 56, 62
Sunset 6, 41, 53, 56, 62
surveyor 6
system 6
tide 22, 24, 30, 33, 41, 53, 58
Tide Table 65
Tide Windows 6
tides 36
time 24, 33, 36, 38, 41
time zone 25
title 36, 38
turn 36, 58
txt 16
-UUKC 6, 22, 30, 33, 41
under 22, 30
-Vversion
25
-Wwater 36, 38
web page 16
weekday 36, 38
windows 6, 28, 41, 60
-Yyear
36, 38
-Zzone
zoom
36, 38
23
-TTable 7, 14, 24, 33, 41, 65
tc1 16, 36, 38
tc2 16
terminates 15
terminating 21
tidal 6, 7, 22, 23, 30, 36, 38
tidal analysis 6
GeoTide Predictor 3.0.x, © 2015 Geomatix