1
Notes on first encountering the British Household Panel Survey (BHPS) and
Understanding Society
John F Hall
[draft only: 29 Nov 2013]
Understanding Society
UK Data Service distributes separate SPSS files for each topic and separate lists of documentation
in pdf and dictionaries in Word. The following notes are more or less in chronological order as I
worked my way through the documentation and selected SPSS *.sav files. As well as comments on
the technical aspects of (mainly) SPSS files, they also serve to illustrate how an experienced survey
researcher and SPSS user like myself approaches a new data set, partly to explore it himself and
partly with a view to using it for teaching. Colleagues and students may find it illuminating to
accompany me on such a journey.
SN 5151
British Household Panel Survey
184 SPSS files
SN 6614
Understanding Society (Waves 1 and 2)
http://esds.ac.uk/doi/?sn=6614
31 SPSS files
↓
↓
↓
↓
↓
↓
↓
↓
↓
↓
↓
↓
↓
↓
↓
↓
↓
31 Data dictionaries
↓
↓
↓
1
↓
17 User Manuals (pdf)
1 guide to contents 6614_file_information (Word doc in table format: read only)
File name
Description of file
read6614
UKDA Information for Study 6614
6614_ukhls_wave1_2012revisions-2
Wave 1 Revisions November 2012
6614_understanding_society_wave1_questionnaire
Wave 1 Adult Main Questionnaire
6614_understanding_society_wave2_questionnaire_v04
Wave 2 Adult Main Questionnaire
6614_user_manual_waves1-2
Waves 1-2 User Manual
6614_wave1_consent_package
Wave 1 Consent Package
~~~
6614_wave2_youth_selfcompletion_questionnaire
Wave 2 Youth Self-Completion Questionnaire
~~~
xwaveid
Identifiers for each wave for individual respondents
xwaveid_ukda_data_dictionary
UKDA Data Dictionary
2
My substantive interest in these data lies in subjective social indicators1 ("Quality of Life" measures
such as satisfaction or dissatisfaction with various aspects of life, "happiness" and psychological
well-being) and their relationship to more "objective" indicators and demographic characteristics.
My teaching interest is to place myself in the position of students and researchers new to survey
analysis and to SPSS, for whom I have suggested some improvements to the SPSS files distributed
by UKDS to make them easier to understand and use. For more than 20 years from 1971 until I
(early) retired in 1992, I trained hundreds of such students, and provided advice and assistance to
dozens of such researchers, in the processing, management and analysis of data from
questionnaire surveys using (mainframe) SPSS. Since 2009 I have been developing a website for
which I have converted, updated and greatly expanded my course materials for use with SPSS for
Windows. (To date there are more than 600 pages of SPSS tutorials2 available for free download).
For fellow professionals I have hopefully made constructive comments which may help them
achieve agreed minimum standards of SPSS file design, construction and documentation for use not
only by themselves, but also by their students and fellow researchers, not to mention (future)
students and researchers elsewhere.
Understanding Society
Main SPSS files seem to be:
(88.8 mb, V = 134, N = 50,994)
(94.3 mb; V = 1568; N = 54,597)
. . but there are also a_indall and b_indall.
Good points:
Missing values are negative and consistently labelled.
Problem points:
Measurement levels all Unknown
Most variable and value labels start with lower case letters
No question numbers at all (to use with questionnaire?)
Browsing through Understanding Society: Early Findings from the First Wave of the UK's Household
Longitudinal Study3 (in response to a blog) I came across an article by Gundi Knies Life Satisfaction
and Material Well-being of Young People in the UK (pp15-22). The article reports on the use of a
seven point (1 – 7) scale to measure how happy or unhappy children are with various aspects of
their lives (based on data from the UK Household Panel Study).
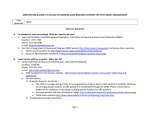
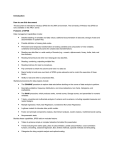
"Our key outcome variable, overall life satisfaction or happiness, is collected using a 7-point scale where
categories are represented by more or less smiling faces. Participants are asked to tick the box which best
describes how they feel about their life as a whole (Figure 1). For ease of interpretation, the analysis reverses
the coding of the information so that higher values on the scale represent greater satisfaction".
(op cit, p17)
1
2
3
See section Subjective Social Indicators on my website Journeys in Survey Research
See section Survey Analysis Workshop
McFall, S. L. & Garrington, C. (Eds.). (2011). Early findings from the first wave of the UK’s household longitudinal study.
Colchester: Institute for Social and Economic Research, University of Essex.
3
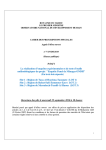
From the information sent out by UKDS, it took me quite a while to track down the corresponding
self-completion youth questionnaire 6614_wave2_youth_selfcompletion_questionnaire.pdf:
. . which revealed a beautifully designed self-completion questionnaire for 10-15 year-olds.
Click on Enter to progress through it (better)
4
. . or just scroll down through it, but the display of variable names changes.:
Then I had a bit of a pantomime tracking down the associated SPSS file b_youth.sav
Scroll down to find the "happy" variables (names helpfully indicated in boxes on the questionnaire)
.
5
Adjust column separators to see contents more clearly:
[NB: The measurement levels change to those automatically assigned by SPSS after making a
pass through the data: they are NOT correct, but depend on the values encountered during the data
pass]
Two ways to check labels and missing values:
1: The slow way
(One variable at a time)
Click on the two dots to the right of each box in the Values column, but if the column is very wide
you may get this first:
. . so click on the blue box to get this:
Now do this six more times (!!) for the other variables.
6
2: The quick way
(Several variables at a time)
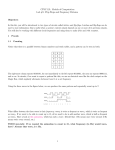
Data > Define Variable Properties
(DVP)
The display opens at the beginning of the file, so you need to scroll down to find your variables:
Opening display
Display after scrolling to find variables of interest
You can stretch the window out to see more of the variable labels: the variable names appear at the
end of the label.
7
The variables we want are contiguous (next to each other in sequence) so click on the first variable,
then move to the last one and Shift click to highlight them all: then click on the blue arrow to drag the
highlighted items across to the right hand pane:
. . but it will spring back once you leave it!
The window displays variable labels rather than variable names, but the SPSS settings can be
changed using Edit > Options from the Data Editor. Variable names are shorter to display and
easier to navigate if you know what they are and where to find them: variable labels will in any case
be displayed in Variable View in the Data Editor (which stays on screen behind the DVP window).
You can move the DVP window around the screen, but you can't do any data manipulation or
analysis in SPSS whilst DVP is open.
However, if you don't know what the names are or where they are in the file, variable labels are
much easier to use in DVP if they include a question number, preferably at the beginning of the
label. Many SPSS files for surveys don't have question numbers at all. In the case of the British
Social Attitudes survey, question numbers appear at the end of (sometimes very long) labels. It's
much easier if question numbers are moved to the beginning of the label (see the example on page
9 below)
8
Click on Continue to get the following display:
This facility was actually designed to enter properties of variables when building up a file from
scratch, though I would never advise that. I find it is useful as a quick check on files once they've
been saved (if they're mine) or downloaded (if they're someone else's). Just click on a variable in
the left pane and all its properties will be displayed. You can use the boxes in this window to edit or
add properties, but no syntax is saved unless you use the Paste button (grayed out in the
screenshot above) which only becomes active if you change any variable properties. This sends
automatically generated syntax to the active syntax editor, but doesn't effect any changes to the file.
To do that you have to go back to the active syntax editor and actually run the syntax. Even that
doesn't effect permanent changes unless you perform an analysis or an EXECUTE command.
Using Paste generates a complete set of syntax commands, repeated for each variable. You don't
need to use Paste one variable at a time: you can move to other variables, modify their properties,
then Paste the syntax in to the active Syntax Editor. The syntax is accurate, but can run to
dozens of lines. If I use it, I always edit the syntax down. I always prefer to use direct syntax for
changing properties, but with DVP open you can't go back to the syntax file, so I build up draft
syntax in Word first. The nice thing about DVP is you can see the counts, so it saves having to run
FREQUENCIES if all you want are raw counts.
In this particular example, you can skip down the left pane with the down arrow ▼ on the keyboard
and see that all variables have the same missing values (boxes are checked under Missing for the
values -9, -8, -2, and -1) and the same value labels, but only the extremes are labelled.
9
You can change the settings for SPSS so that dialog boxes display variable labels instead of
variable names, especially if you have used question numbers at the beginning of labels. This can
make files easier to navigate in Variable View in the Data Editor and to find in Define Variable
Properties. The files for Understanding Society do not have question numbers, so it's better to use
variable names.
British Social Attitudes
The files for the British Social Attitudes series also have mnemonic names, but they also have
question numbers at the end of the labels. This example is from the 2011 survey (SN 7327):
Whilst it's possible to navigate using the Label column (much widened):
. . it's much easier to have the question number at the beginning of each label so that all the
question numbers are aligned vertically in the default Variable View :
In response to a query to the SPSS-X list, asking if there was a quick way to do this, rather than
changing them manually, one by one, Jon Peck (Senior Software Engineer at IBM/SPSS) supplied
a nice little Python program to do it for me (and other users). A bonus was to move any free
standing "dv"s (derived variable) to the beginning of the label as well as the question numbers and
to change any lower case first letters of the original labels to upper case:
10
Before
After
[NB: The working file has been saved with a different name leaving the original intact]
Variable View is now much easier to use, and the default Define Variable Properties now displays
the question numbers without having to stretch the display:
Stretched
Default
11
Understanding Society
Variables are not in alphabetical order, and not that easy to follow with the questionnaire open. You
can find them in the Data Editor by highlighting the Name column and using [Ctrl] F. For example
to find variables containing the characters jbsat (Job satisfaction)
Click on Find Next
Variable and value labels all start with lower case letters. Embedded words and acronyms which
should have capitals don't (eg england, wales, gcse)
12
Self-completion questionnaires have Q~~ question numbers with variable names superimposed. In
the SPSS *.sav files these are prefixed a_ or b_ according to which wave they are in. I need to
check dictionaries to see if they can be used/fused with *.sav files.
[to be continued]
13