1
Data Sheet Overview
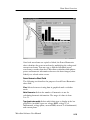
Cursors. Cursors are used to measure the waveform plot. You can put
cursors on the selected sheet using the Cursor tab on the Property
Page. Cursor readout values indicate the vertical or horizontal value
at the cursor location. Vertical cursor position values appear as dX
and X. Horizontal cursor position values appear as dY and Y.
Gates. Gates define the range over which measurements are
computed when waveform data is moved from this sheet to a
waveform measurement sheet. Turn on gates by choosing vertical
cursors in the Cursor Property dialog and checking the Gate with
Vertical Bar Cursors checkbox; then, set gate location by using the
mouse to move the cursors.
Print Banner
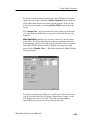
To print the full record length of all waveforms in the YT data sheet,
select the data sheet and choose Print Banner... in the WaveStar File
menu. The Print Banner option is useful when your YT data sheet
contains waveforms that are longer than the width of the graticule.
Mask Editing
The YT sheet mask editing features allow you to create new test
masks for an instrument family by modifying existing masks or
defining mask parameters from scratch. The copied mask retains the
instrument settings that were part of the original mask.
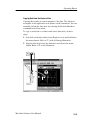
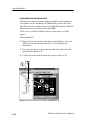
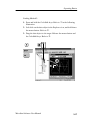
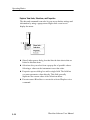
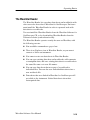
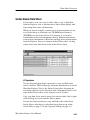
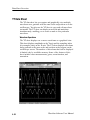
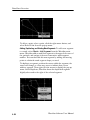
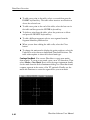
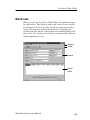
To edit an existing mask, or create a new mask based on an existing
mask, simply drag and drop a mask from the Explorer view onto the
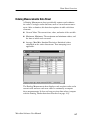
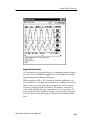
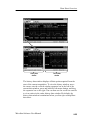
YT sheet. WaveStar draws the mask on the graticule and shows
existing line vertexes (points) as small squares, as shown in the
following figure.
NOTE. If a mask is visible on your YT sheet, and you copy or link the
YT sheet to another data sheet, the mask data is copied along with
the waveform data. To prevent this, clear the Show Mask checkbox in
the toolbar before copying or linking the YT sheet data to other
sheets.
4- 34
WaveStar Software User Manual