1
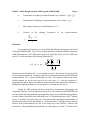
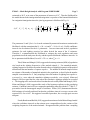
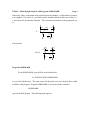
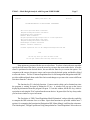
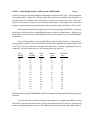
FW663 -- Laboratory Exercise
Mark-Resight Analysis with Program NOREMARK
Technologically advanced approaches to the problem of abundance estimation have
incorporated animals marked with radio transmitters. The initial sample of animals is captured
and marked with radios, but recaptures of these animals are obtained by only observing them,
not actually recapturing them. The limitation of this procedure is that unmarked animals are
not marked on subsequent occasions. The advantage of this procedure is that resighting
occasions are generally much cheaper to acquire than when the animals must be physically
captured and handled. The mark-resight procedure has been tested with known populations
of mule deer (Bartmann et al. 1987), and used with white-tailed deer (Rice and Harder 1977),
mountain sheep (Furlow et al. 1981, Neal et al. 1993), black and grizzly bears (Miller et al.
1987), coyotes (Hein 1993), and moose (Bowden and Kufeld 1995).
The objective of this exercise is to explore program NOREMARK, a program to
compute mark-resight estimators of population abundance. Three estimators of abundance are
provided: the joint hypergeometric maximum likelihood estimator (JHE) (Bartmann et al.
1987, White and Garrott 1990, Neal et al. 1993), the joint hypergeometric maximum likelihood
estimator extended to incorporate animals moving on and off the study area (Neal et al. 1993,
White 1993), the Minta-Mangel estimator (Minta and Mangel 1989), and Bowden's estimator
for the Minta-Mangel model (Bowden and Kufeld 1995).
First, a section defining the mathematical notation will be presented, followed by a
section describing the details of each of the estimators. Then, the startup of Program
NOREMARK will be shown with annotated examples.
Notation
Ti
Number of marked (telemetered) animals in the population at the time of the ith
survey, i=1,...,k. When the number of marked animals is assumed constant
across surveys, the value is denoted as T. .
Mi
Number of marked animals in the population that are on the area surveyed at
the time of the ith sighting survey. For all Mi constant, define M / Mi.
ni
Number of animals seen during the ith sighting survey, consisting of mi marked
animals and ui unmarked animals, so that ni = mi + ui.
fj
Number of times marked animal j was observed during the k surveys (sighting
frequencies), k = 1, ..., T. .
FW663 -- Mark-Resight Analysis with Program NOREMARK
Page 2
m.
Total number of sightings of marked animals seen, so that m. = 3mi = 3fj.
u.
Total number of sightings of unmarked animals seen, so that u. = 3ui.
f¯
sf 2
Mean capture frequency of marked animals, m./T. .
Variance
of
the
sighting
frequencies
of
the
marked animals,
¯2
j (fj & f )
T.
2
sf '
j'1
T.
.
Estimators
Four estimators of population size for marking and sighting experiments are provided
in Program NOREMARK. First is the joint hypergeometric maximum likelihood estimator
(JHE) (Bartmann et al. 1987, White and Garrott 1990, Neal 1990, Neal et al. 1993). JHE is the
^
value of N which maximizes the following likelihood (N):
‹(N | M, ni, mi) ' k
k
i'1
M
mi
N & M
ni & m i
N
ni
and the terms are defined for all i = 1 to k sighting occasions. The estimate N^ can be found by
iterative numerical methods. Confidence intervals are determined with the profile likelihood
method (Hudson 1971, Venzon and Moolgavkar 1988). This estimator assumes that all the
marked animals are on the area surveyed for each survey, i.e., that the population is
geographically closed. Hence, the number of marked animals (M) is constant for each survey,
although the sighting probability is not assumed to be constant for each survey.
Second, the JHE estimator has been extended to accommodate immigration and
emigration (Neal et al. 1993) through a binomial process. This estimator is labeled IEJHE, and
does not assume that the population is geographically closed. Assume that the total population
with any chance of being observed on the study area is N*, and that at the time of the ith sighting
survey, Ni animals occur on the study area. I am interested in estimating the mean number of
animals on the study area, ú, and possibly N*. At the time of the ith sighting occasion, a known
number of the marked animals (Mi) are on the study area of the possible Ti animals with
transmitters. The probability that an individual is on the study area on the ith occasion can be
FW663 -- Mark-Resight Analysis with Program NOREMARK
Page 3
estimated as Mi/Ti, or in terms of the parameters of interest as Ni/N*. Then the likelihood for
the model that includes immigration and emigration is a product of the binomial distribution
for emigration/immigration times the joint hypergeometric likelihood of Eq. (1):
‹(N (, Ni | T i, Mi, mi, ni) ' k
k
i'1
Ti
Ni
Mi
N(
Mi
1 &
Ni
N(
Ti & Mi
Mi
Ni & Mi
mi
ni & m i
Ni
ni
The parameters N* and Ni for i=1 to k can be estimated by numerical iteration to maximize this
likelihood, with the constraints that Ni > (Mi + ui) and N* > Ni for i=1 to k. Profile confidence
intervals can be obtained for the k+1 parameters. I was not interested in the k population
estimates for each sighting occasion, but rather desired the mean of the Ni estimates.
Therefore, I re-parameterized the likelihood to estimate the total population and mean
population size on the study area directly, and their profile likelihood confidence intervals. In
the re-parameterized likelihood, I used Ni = ú + "i, where 3 "i = 0.
Third, Minta and Mangel (1989) suggested a bootstrap estimator (MM) of population
size based on the sighting frequencies of the marked animals, fi. For unmarked animals,
sighting frequencies are drawn at random from the observed sighting frequencies of the marked
animals until the total number of captures equals u. . The number of animals sampled is then
an estimate of the number of unmarked animals in the population, so that M plus the number
sampled is an estimator for N. Only samplings where the number of sightings was equal to u.
were used, i.e., cases where the cumulative sightings exceeded u. were rejected. Minta and
Mangel (1989) accepted the first value where the cumulative sightings equalled or exceeded
u. . The stopping rule I used results in less bias than the rule used by Minta and Mangel (1989).
Minta and Mangel (1989) suggested the mode of the bootstrap replicates as the population
estimate. Confidence intervals were computed as probability intervals with the 2.5th and 97.5th
percentiles from the bootstrapped sample of estimates. White (1993) demonstrated that the
MM estimator is basically unbiased, but that the confidence interval coverage was not at the
expected 95% for "=0.05. He suggested a modified procedure, but coverage again was not
adequate.
Fourth, Bowden and Kufeld (1995) suggested an estimator for the Minta-Mangel model
where the confidence intervals on the estimate were computed based on the variance of the
resighting frequencies of the marked animals. He approached the problem from a sampling
FW663 -- Mark-Resight Analysis with Program NOREMARK
Page 4
framework, where each animal in the population has the attribute fi of the number of times it
was resighted. The values of fi are known for the marked animals, and the sum of the fi's (=
u.)are known for the unmarked animals. Then, an unbiased estimator of the population size
is
2
N̂ '
sf
(u. % m.)
%
2
f¯
f¯
2
1 %
sf
2
T.f¯
with variance
2
N̂
Vâr(N̂) '
2
1
1 sf
&
T.
N̂ f¯2
2
2
1 %
sf
2
T.f¯
Program NOREMARK
To run NOREMARK, copy the files in the subdirectory
J:\CLASSES\FW663\NOREMARK
to your local subdirectory. The main reason for doing this is to have the help files readily
available to the program. Program NOREMARK is executed with the command
NOREMARK
typed at the DOS prompt. The following menu appears.
FW663 -- Mark-Resight Analysis with Program NOREMARK
01/05/94
Memory Available = 141
Page 5
10:47:57
64444444444444444444444444444444444444444444444444444444444444444444444444444447
5
DESIGN AND ANALYSIS OF MARK-RESIGHT EXPERIMENTS
5
:444444444444444444444444444444444444444444444444444444444444444444444444444444<
5
5
5
5
5
JHE Closed Population Model Estimation
5
5
Immigration/Emigration Model Estimation
5
5
Minta-Mangel Model Estimation
5
5
Bowden's Model Estimation
5
5
Design Experiment Using Interpolation for Closed Population
5
5
JHE Closed Population Model Simu ation
5
5
Immigration/Emigration Model Simulation
5
5
Minta-Mangel Estimator Simulation
5
5
Bowden's Estimator Simulation
5
5
5
5
Estimate Population Size for No Immigration/Emigration with JHE
5
94444444444444444444444444444444444444444444444444444444444444444444444444444448
EXIT
The ESC key takes you back one menu screen.
You can get context-sensitive help with the F1 key.
Nine options are presented for the user to select from. To select a choice the user can either
specify the first letter of the choice, or use the arrow keys to move the cursor to the choice. After the
cursor is positioned on the desired choice, the user hits the Enter key to execute the option. For
computers with a mouse, the mouse cursor can be moved to the desired option, and double clicked
to select the choice. The line "Estimate Population Size for No Immigration/Emigration with JHE"
provides additional detail about each of the choices and changes as you move the cursor to different
selections from the 7 choices.
The function key F1 is the help function. Context-sensitive help can be obtained any time
the program is waiting for input by hitting the F1 key. A window will pop up on the screen
displaying information about the program's request. To exit this window, hit the Esc key, which is
equivalent to selecting the "Exit" option from the menu choices. In general, the Esc key always takes
you back one window to a previous menu.
The first choice is "JHE Closed Population Model Estimation", and provides the capability
to compute the JHE estimator for a set of data. Equivalent functions are provided with the next 3
options, for computing the Immigration/Emigration JHE, Minta-Mangel, and Bowden estimators.
The fourth option, "Design Experiment Using Interpolation for Closed Population" allows the user
FW663 -- Mark-Resight Analysis with Program NOREMARK
Page 6
to quickly design an experiment using the simulations results from Neal (1990). These simulations
were summarized in a dBase file, and this option allows the user to interpolate the simulations to
provide an idea of confidence interval length for a particular set of parameter values. The next 4
choices in the main menu allow the user to simulate experiments. These options are useful in the
design of experiments that require parameter values outside the ranges simulated by Neal (1990).
This introduction should be enough to get you started using Program REMARK. In general,
the program is all menu driven, with additional options available via function keys. When you are
being asked for input and don't understand what is being asked, try the F1 key to obtain additional
information.
For your first problem, try entering the following data from the keyboard. Andrea Neal, a
former graduate student at CSU, collected the following mark-resight data on mountain sheep (Neal
et al. 1993). Twenty-five sheep were marked with radio collars. Fourteen resighting surveys were
conducted. For each of these surveys, the following data were observed.
Total
Marked
25
25
25
25
25
25
25
25
25
25
25
25
25
25
Marks
Available
22
21
21
20
20
20
22
18
23
18
20
17
20
21
Total
Seen
40
63
66
57
52
61
87
46
63
30
69
35
51
57
Marked
Seen
9
11
14
11
10
9
19
8
13
8
14
6
13
17
Unmarked
Seen
31
52
52
46
42
52
68
38
50
22
55
29
38
40
Run these data in Program NOREMARK with the No Immigration/Emigration Joint Hypergeometric
Estimator.
To run the Bowden estimator that allows heterogeneity of resighting probabilities among
individuals, you must enter the number of times each marked animal was observed, plus the total
number of unmarked animals observed. The following is the number of times that each of Andrea's
FW663 -- Mark-Resight Analysis with Program NOREMARK
Page 7
25 marked sheep were seen: 10, 9, 3, 6, 7, 5, 5, 12, 2, 5, 8, 9, 8, 3, 12, 10, 4, 9, 4, 3, 6, 6, 6, 3, and
7. There were a total of 615 unmarked sheep observed. Enter these data in Program NOREMARK.
You will note that the program allows you to retrieve data with the F2 function key once the
data entry screen appears. In the subdirectory
J:\CLASSES\FW663\EXERCISE.22
are a number of examples you can try, including the 2 examples you have just executed. Files with
the suffix HYP are for the hypergeometric estimators (both closed and open models), whereas files
with the suffix MM are for the Minta-Mangel and Bowden estimators. For the lab today, just explore
the closed JHE and Bowden estimators. As shown by White (1993), the Minta-Mangel estimator
does not perform properly. We will work with the open population models later.
After you understand the input for these 2 models, try exploring the design and simulation
capabilities of the program. A complete user’s manual formatted in Word Perfect 6.1 is provided
in the file
J:\CLASSES\FW663\EXERCISE.22\USERMAN.WP.
Questions to Consider
1.
How many marked sheep with 14 resighting occasions would Andrea Neal have needed to
obtain a 95% confidence interval of ±10% for the JHE? For Bowden's estimator?
2.
How many resighting occasions with 25 marked sheep would Andrea Neal have needed to
obtain a 95% confidence interval of ±10% for the JHE? For Bowden's estimator?
3.
What are the different assumptions of the JHE and Bowden's estimators? Which model
seems more realistic for resighting mountain sheep from a helicopter?
4.
One scenario proposed for use of mark-resight estimators is use with radio-collared bears.
Resightings of bears takes place at bait stations where motion- and infrared- sensitive
cameras photograph the bears. What kinds of problems would arise with such surveys?
Pertinent Literature
Arnason, A. N., Schwarz, C. J., and Gerrard, J. M. 1991. Estimating closed population size and
number of marked animals from sighting data. Journal of Wildlife Management 55:716-730.
FW663 -- Mark-Resight Analysis with Program NOREMARK
Page 8
Bartmann, R. M., G. C. White, L.H. Carpenter, and R.A. Garrott. 1987. Aerial mark-recapture
estimates of confined mule deer in pinyon-juniper woodland. Journal of Wildlife
Management 51:41-46.
Bowden, D. C., and R. C. Kufeld. 1995. Generalized mark-sight population size estimation applied
to Colorado moose. Journal of Wildlife Management 59:840-851.
Buckland, S. T., and P. H. Garthwaite. 1990. Algorithm AS 259 -- Estimation confidence intervals
by the Robbins-Monro search process. Applied Statistics 39:413-424.
Chao, A. 1988. Estimating animal abundance with capture frequency data. Journal of Wildlife
Management 52:295-300.
Chapman, D. G. 1951. Some properties of the hypergeometric distribution with applications to
zoological sample censuses. University of California Publication in Statistics 1:131-160.
Eberhardt, L. L. 1990. Using radio-telemetry for mark-recapture studies with edge effects. Journal
of Applied Ecology 27:259-271.
Furlow, R. C., M. Haderlie, and R. Van den Berge. 1981. Estimating a bighorn sheep population
by mark-recapture. Desert Bighorn Council Transactions 1981:31-33.
Hudson, D. J. 1971. Interval estimation from the likelihood function. Journal of the Royal
Statistical Society Series B 33:256-262.
Leslie, D. M., Jr. and C. L. Douglas. 1979. Desert bighorn sheep of the River Mountains, Nevada.
Wildlife Monographs 66:1-56.
Leslie, D. M., Jr. and C. L. Douglas. 1986. Modeling demographics of bighorn sheep: current
abilities and missing links. North American Wildlife and Natural Resources Conference
Transactions 51:62-73.
Miller, S. D., E. F. Becker, and W. H. Ballard. 1987. Black and brown bear density estimates using
modified capture-recapture techniques in Alaska. International Conference on Bear Research
and Management 7:23-35.
Minta, S. and M. Mangel. 1989. A simple population estimate based on simulation for capturerecapture and capture-resight data. Ecology 70:1738-1751.
FW663 -- Mark-Resight Analysis with Program NOREMARK
Page 9
Neal, A. K. 1990. Evaluation of mark-resight population estimates using simulations and field data
from mountain sheep. M. S. Thesis, Colorado State Univ., Fort Collins. 198pp.
Neal, A. K., G. C. White, R. B. Gill, D. F. Reed, and J. H. Olterman. 1993. Evaluation of markresight model assumptions for estimating mountain sheep numbers. Journal of Wildlife
Management 57:436-450.
Otis, D.L., K.P. Burnham, G.C. White, and D.R. Anderson. 1978. Statistical inference from capture
data on closed animal populations. Wildlife Monographs 62:1-135.
Rice, W. R. and J. D. Harder. 1977. Application of multiple aerial sampling to a mark-recapture
census of white-tailed deer. Journal of Wildlife Management 41:197-206.
Venzon, D. J. and Moolgavkar, S. H. 1988. A method for computing profile-likelihood based
confidence intervals. Applied Statistics 37:87-94.
White, G. C., D. R. Anderson, K. P. Burnham, and D. L. Otis. 1982. Capture-recapture and removal
methods for sampling closed populations. Los Alamos National Laboratory. LA-8787NERP. Los Alamos, N.M. 235pp.
White, G. C. and R. A. Garrott. 1990. Analysis of wildlife radio-tracking data. Academic Press,
New York, New York, USA. 383pp.
White, G. C. 1993. Evaluation of radio tagging marking and sighting estimators of population size
using Monte Carlo simulations. Pages 91-103 in J.-D. Lebreton and P. M. North, eds.
Marked individuals in the study of bird population. Birkhäuser, Berlin.