1
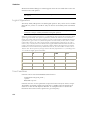
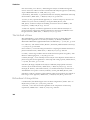
Measurements: Linear
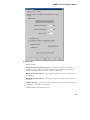
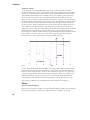
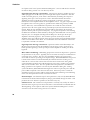
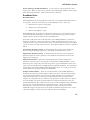
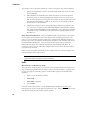
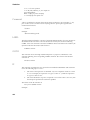
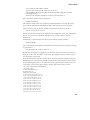
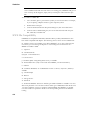
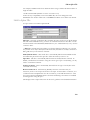
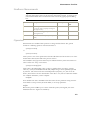
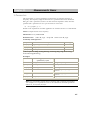
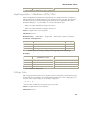
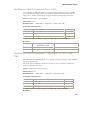
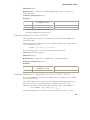
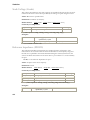
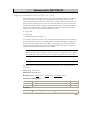
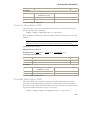
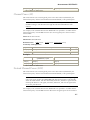
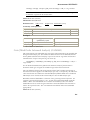
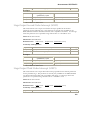
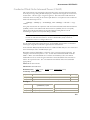
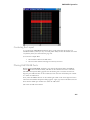
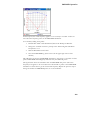
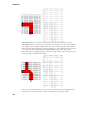
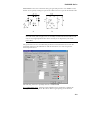
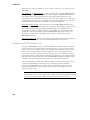
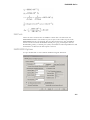
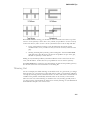
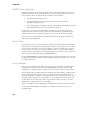
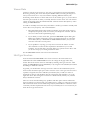
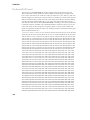
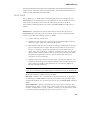
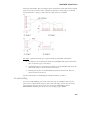
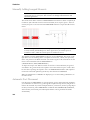
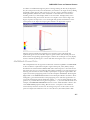
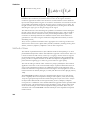
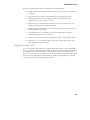
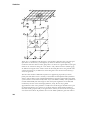
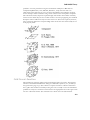
VSWR
---
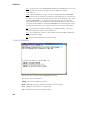
Show VSWR for all ports
* Not available on Smith Chart, plots s-parameters
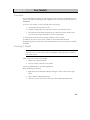
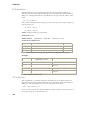
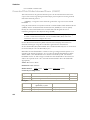
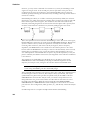
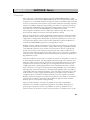
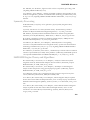
Input Impedance / Admittance (ZINi, YINi)
The port impedance and admittance measurements are complex functions of frequency.
The measurements are made looking into the network from the port with other network
terminations in place. The frequency range and intervals are as specified in the Linear
Simulation dialog box. A port number "i" is used to identify the port:
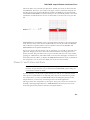
ZINi is the input impedance looking in from port i.
YINi is the input admittance looking in from port i.
Values: Complex value versus frequency.
Simulations: Linear
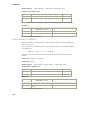
Default Format:
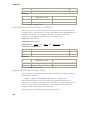
Table: RECT Graph: RE
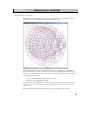
Smith Chart: Sij (plots s-paramters)
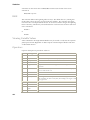
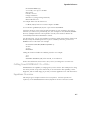
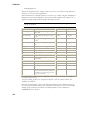
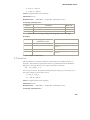
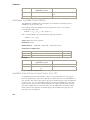
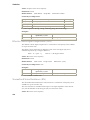
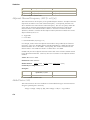
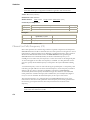
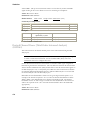
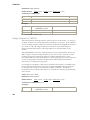
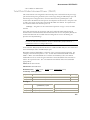
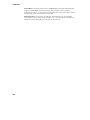
Commonly Used Operators:
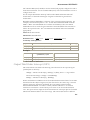
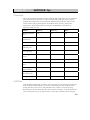
Operator
Description
Result Type
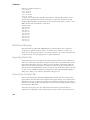
RECT[ZIN1]
real/imaginary parts
Real
RE[YIN2]
real part
Real
MAGANG[ZIN3] Linear magnitude and angle in range of -180 to 180
Real
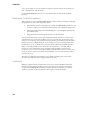
{Other Operators: MAG[], ANG[], ANG360[], IM[], MAGANG360[] }
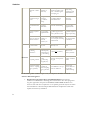
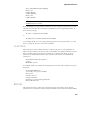
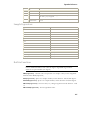
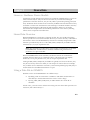
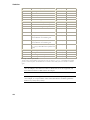
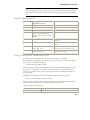
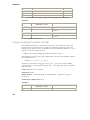
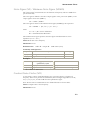
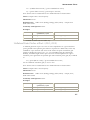
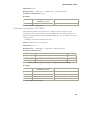
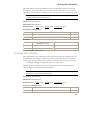
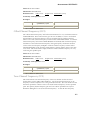
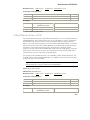
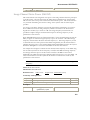
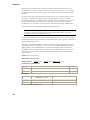
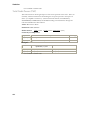
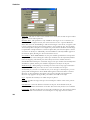
Examples:
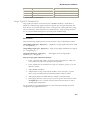
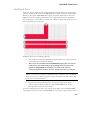
Measurement
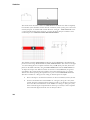
ZIN2
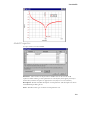
Result in graph, Smith chart*,
optimization, or yield
RE[ZIN2]
RECT[ZIN]
MAG[YIN1]
real part of ZIN2
---
Linear Magnitude of Y21
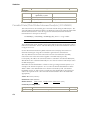
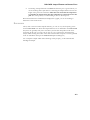
ZIN
Result on table
RE[ZIN1]
Shows real/imaginary parts for all ports
Linear Magnitude of YIN1
Shows real/imaginary parts of all ports
* Not available on Smith Chart
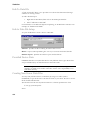
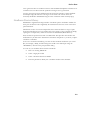
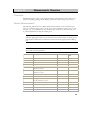
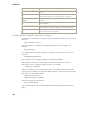
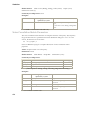
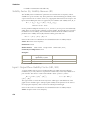
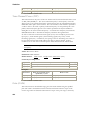
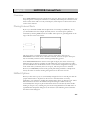
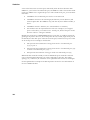
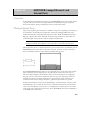
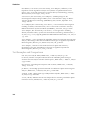
Voltage Gain
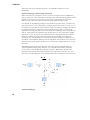
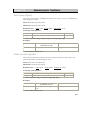
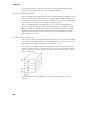
This voltage gain measurements are complex functions of frequency. The frequency range
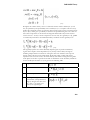
and intervals are as specified in the Linear Simulation dialog box. The voltage gain, Eij , is
the ratio of the output voltage (Vj) to the input voltage (Vi).
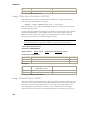
Eij = Vj / Vi
Note that due to reflections, the gain Eii may not be unity.
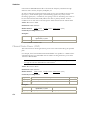
Values: Complex matrix versus frequency.
Simulations: Linear
151