1
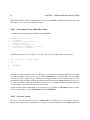
9.4. MATRIX MULTIPLICATION 163 and B= 1 5 9 13 17 21 2 6 10 14 18 22 3 7 11 15 19 23 4 8 12 16 20 24 (9.18) Further suppose that BLOCK SIZE is 2. That’s too small for good efficiency—giving only four threads per block rather than 256—but it’s good for the purposes of illustration. Let’s see what happens when we compute C00 , the 2x2 submatrix of C’s upper-left corner. Due to the fact that partitioned matrices multiply “just like numbers,” we have C00 = A00 B00 + A01 B10 + A02 B20 1 2 1 2 + ... = 5 6 7 8 (9.19) (9.20) Now, all this will be handled by thread block number (0,0), i.e. the block whose X and Y “coordinates” are both 0. In the first iteration of the loop, A11 and B11 are copied to shared memory for that block, then in the next iteration, A12 and B21 are brought in, and so on. Consider what is happening with thread number (1,0) within that block. Remember, its ultimate goal is to compute c21 (adjusting for the fact that in math, matrix subscripts start at 1). In the first iteration, this thread is computing 1 2 1 5 = 11 (9.21) It saves that 11 in its running total Csub, eventually writing it to the corresponding element of C: int c = (dc_wB * BLOCK_SIZE * by) + (BLOCK_SIZE*bx); C[c + (dc_wB*ty) + tx] = Csub; Professor Edgar found that use of shared device memory resulted a huge improvement, extending the original speedup of 20X to 500X!