1
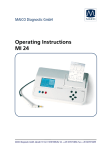
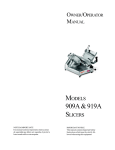
iAudiometer
User Guide
Index
1. Installation
3
2. Main Menu
4
3. Information Section
4
4. Patient Section
5
5. Report Function
7
5.1 Single Test Report
8
5.2 More than one Test Report
9
6. Export Function
12
7. Pure Tone Tests
13
7.1 AC/BC Test
13
7.2 Tone Decay Test
16
7.3 ABLB Test
17
7.4 Stenger Test
19
7.4 Screening Test
20
8. Speech Tests
24
8.1 Speech Reception Threshold (SRT) and Speech Discrimination Test
(SD)
24
8.2 PI-PB Function Test
27
8.3 Psst!™
29
9. Tinnitus Evaluation Program™
30
10. Transducers
33
11. Save Function
34
12. Settings
35
13. Calibration
36
Index
2
iAudiometer
1. Installation
For the correct use of the iA, it is required that you connect the iPad with
the recommended transducers in the way shown in Figure 1. Headphones jack
Adapters RCA Male to
6.3mm Mono Jack
Female
Audio Adapter
3.5mm Stereo
Jack Male to 2
RCA Female
FIGURE 1.
You will also need an Audio Adapter ( a 3.5mm Male Stereo Jack to 2 RCA
Females) and two adapter RCA Males to a Female 6.3mm Mono Jack. *It is crucial, that you connect the transducers correctly. You must plug the
red plug of the headphones in the red RCA plug. If the transducer is the
bone vibrator, then its plug has to be connected to the black/white RCA
plug. 3
2. Main Menu
In Figure 2, the Main Menu is shown. The following are explanations of
each section.
FIGURE 2.
3. Information Section
Ta p o n t h e
Info Section, shown in Figure 3.
Here you can find:
✦ the Technical Specifications: it can be sent by email, opened in another
application installed app on your device, or printed;
4
✦ the User Guide Each: it can be sent by email, opened in another
application installed app on your device, or printed;
✦ links to iAudiometer’s video tutorials.
FIGURE 3.
4. Patient Section
The Patient Section, shown in Figure 4, can be divided into four parts:
1. PATIENT LIST: all patients saved are listed. On the top there is a
Search Bar. It is possible to search for a specific patient by First Name,
Last Name, Patient ID, Address (including street address, Zip/Postal
Code, City and State), or All of these. 2. PATIENT FORM: once you have chosen a test, (tap on) a patient’s
name and all of their information and prior tests will be listed by Date.
5
FIGURE 4.
✦
On the top you will see all of the patient’s information. Tap on
the REPORT Button and a full patient report will be created (see
Section 5.);
✦
Tap on the EDIT Button and the patient information can then
be edited;
✦
On the left are test types you have administered. On the right
are tests of that type. They can be sorted by date of evaluation.
Tap on a date and the corresponding test results will be
displayed. (Figure 5) It is possible to create a report for any of the
chosen tests. Tap on the VIEW ALL Button and all of the test
results (of the type selected) can be viewed. (Figure 5) by
scrolling down. Tap on EXPORT Button to select the Export
function (see Section 6.).
6
FIGURE 5.
3. PATIENT TOOLS: On the top right of the Patient interface there are:
✦
ADD NEW PATIENT: tap on it and a form will be shown, so
you can enter all new patient information;
✦
TOOLS Button: Allows you to select the export type (see Section
6);
5. Report Function
With iAudiometer it is possible to to create a:
1. Single Test Report;
2. More than one test Report.
7
5.1 Single Test Report
In Report View, Figure 6, it is possible to choose your settings for the
report:
1.
2.
Patient Information: Here it is possible to enter Patient data, or
import data from the iA database (tapping on Import Data from
Patient, the patient list appears, and by selecting a patient, all of their
data will be loaded); Report Panel: Here it is possible to:
✦
add a comment;
✦
add, on the report, Clinician Information (see Section 12);
✦
add the Clinician Signature (see Section 12);
✦
select the test results and include them in the report (this
option depends of which tests you are reporting). FIGURE 6.
8
5.2 More than one Test Report
In this case it is possible to choose between two types of reports:
1.
Clinical Report Form;
2.
Clinical Report with Audiogram;
In the first example, Figure 7, before going to the selection of the tests to
include in this report, it is required that you select:
✦
Which complaints you want to include in the patient’s report;
✦
Which complaints you do NOT want to include in the report;
✦
Which procedures were administered. Recommendations may
include “Refer to” so you can refer to another specialist. FIGURE 7.
9
The selection of the tests, Figure 8, can be done by choosing a date, using
the picker on the left (in this case all tests performed on a specific date can
be selected), or you can select one by one each of the tests to include.
FIGURE 8.
On the right, it is possible to:
✦
add a comment;
✦
add Tympanometry and OAE results;
✦
add Clinician Information (see Section 12);
✦
add the Clinician’s Signature (see Section 12).
For all the reports, tapping the top right button DONE, the Report will be
generated, and it is possible to choose:
✦
✦
EMAIL, allows you to send an email with the attached report.
OPEN IN…, allows you to open the report in other apps installed on
your device. This function allows you to archive reports using cloud
10
storage. For example, if Dropbox® is installed on your device,
choosing “OPEN IN…” and report will be saved in the Dropbox® app.
It is also possible to move it to a desired folder, in order to synchronize
all connected devices with the same account automatically. In addition,
by choosing “OPEN IN..” it is also possible to share the report by
AirDrop®, in order to send it to other iOS7 devices, using Bluetooth or
WiFi.
✦
PRINT, to print the Report by an AirPrint@ printer (for more detail on
AirPrint@ visit www.apple.com).
In Figure 9, there is an example of the Clinical Report showing both the
Narrative and Graphic Data of your evaluation.
FIGURE 9.
11
6. Export Function
With the iAudiometer it is possible to synchronize two or more
iAudiometers on the same device, or two or more different devices. With the
Export function the iAudiometer can: 1. Export test: in the Exporting panel, Figure 10, it is possible to select
one or more tests ( the listed tests are of type previously selected in Patient
View);
2. Export patient: in the Exporting panel, Figure 10, it is possible to
select one or more patients.
FIGURE 10.
Once you have selected what you want to export, then tap the SEND
Button and a file will be created and it can be exported by email and opened
in another installed application. If it has been received as an iAudiometer file, tap on it and open it in
iAudiometer. You will then be asked what kind of IMPORT and then it will
ask if you want to continue with the importing.
N.B. You can use this function to make a backup of your database.
12
7. Pure Tone Tests
7.1 AC/BC Test
Figure 11, is the AC/BC. The functions of each panel are explained below.
FIGURE 11.
FIGURE 12.
13
In Figure 12, there is the Master Settings Panel for the tests. It allows
you to choose:
✦
Which ear is to be tested;
✦
Which stimulus is to be used;
✦
Which type of tone is to be presented:
•
•
Steady state;
•
Pulsed (the pulse duration can be set between 0.2, 0.5 and 1.0 s)
Warble (generated by a modulated sine wave with a rate of
5/10/20 Hz and a modulation index of 5/10/20%;
✦
If the test is performed with or without Masking and you can decide
if it has to be continuos or presented with the tone and adjust the
amplitude. You can also select the type of Noise:
•
•
White Noise
Narrow Band Noise (NBN): the center band is the frequency of
the selected stimulus, with a band ± 12% and filtered at -12dB/oct;
FIGURE 13.
Frequency and Amplitude of the tones can be changed with sliders or
buttons as shown in Figure 13. The choice of frequency and amplitude is shown also on the audiogram
with two green bars corresponding the amplitude and the frequency chosen.
14
The following are the parameters for frequency and amplitude:
•
•
•
•
•
•
•
•
•
•
•
125Hz, -10-70dB (AC)
250Hz, -10-85dB (AC), -10-45dB (BC)
500Hz, -10-110dB(AC), -10-60dB (BC)
750 Hz, -10-110dB (AC), -10-60dB (BC)
1000 Hz, -10-110dB (AC), -10-70dB (BC)
1500 Hz, -10-110dB (AC), -10-70dB (BC) 2000 Hz, -10-110dB(AC), -10-70dB (BC) 3000 Hz, -10-110dB(AC), -10-70dB (BC) 4000 Hz, -10-110dB(AC), -10-70dB (BC)
6000 Hz, -10-110dB(AC)
8000 Hz, -10-100dB(AC)
These are the functions of the buttons (Figure 14):
✦
Play Button: the stimulus turns ON. Releasing the button, the signal
turns OFF;
✦
Draw Button: this button allows you to record the result on the
audiogram. To record a “no response” from the patient, on the top of
the audiogram you can press on No Response Button.
✦
Save Button: this button will save the response and add it to the
patient record (see Section 11.);
✦
Report Button: this button allows you to create a report of the test
(see Section 5.)
FIGURE 14.
If you want to Delete a single recorded value on the audiogram, just “tap”
on the recorded value and confirm that you want to delete it.
If you want Clear the Audiogram you have to swipe on it and confirm.
15
7.2 Tone Decay Test
Figure 15 is the TONE DECAY TEST.
FIGURE 15.
The Master Settings Panel of the test allows you to choose:
✦
Which ear is to be tested;
✦
Which Stimulus will be used;
✦
Which procedure will be selected :
•
Olsen & Noffsinger procedure: Present the tone at 20 dBSL. As
soon as they hear it the finger goes up and down when it
disappears. Record how long they hear it at 20dSL and increase
level by 5dB without interrupting the tone. Continue in this way until
they hear it for a full minute or until 30dB above the starting level has
been reached.
16
•
Carhart procedure: Start at 5 dBSL and present continuous tone
for 60 seconds, increasing 5 dB each time patient reports not
hearing the tone.
On the Timer Panel, it is possible to:
✦
Choose the timer count between 40, 50, 60, 70, 80 seconds;
✦
Reset timer, to start the test over;
✦
See the count down of the timer.
In the below panel, you can find: ✦
Play Button that allows you to start the tone and the timer. Pressing
this button will turn the stimulus ON and the timer starts to count
down. Pressing the button again, the signal turns OFF and the timer
stops;
✦
Positive and Negative Buttons will allow you to record the positive
or negative outcomes of the test, which will be shown in the Result
Panel below;
N.B. It is not necessary to perform the test for each frequency before
proceeding.
Here are explanations of the other Buttons: ✦
Save Button: pushing this button, the test will be saved, adding it to
the patient record (see Section 11.);
✦
Report Button: this button allows to create a report for the test (see
Section 5.)
7.3 ABLB Test
Figure 16 is the ABLB TEST.
In the Master Settings Panel of the test you can:
✦
choose which ear has to be set as the “Fixed” ear;
✦
choose which ear has to be set as the “Variable” ear;
✦
choose the tone amplitude of the Fixed Ear;
✦
Play Button: pressing this button starts the tone and it begins to
alternate between the two ears with a pulse duration of 500ms.
Pressing this button again stops the tone.
17
✦
Draw Button: this button allows to record the result on the graph.
This Button must be pressed to save the results.
✦
Save Button: pushing this button, will save the results and add it to
the patient record (see Section 11.);
✦
Report Button: this button allows you to create a report of the test
(see Section 5.)
FIGURE 16.
On the Results Panel the results for each frequency tested will be
displayed. Each graph has a Clear Button that allows you to cancel the
recorded results. To record the results on a specific graph, it is necessary to
press the button for that graph. (It is not necessary to perform the test for
each frequency before proceeding)
18
7.4 Stenger Test
Figure 17 is the STENGER TEST.
The Master Settings Panel of the test allows you to choose:
✦
Which ear has to be selected as the “Better” ear;
✦
Which ear has to be set as the “Questionable” ear;
✦
The amplitude of the Better Ear.
FIGURE 17.
In the panel below, you can find: ✦
Play Button allows you to present a continuous tone to the
Questionable ear while decreasing the amplitude until the patient stops
responding;
✦
Positive and Negative Buttons will allow you to record the positive
or negative outcomes of the test, which will be shown in the Result
Panel below;
19
N.B. It is not necessary to perform the test for each frequency before
proceeding.
Here are some additional buttons:
✦
Save Button: tapping this button, will save the results and add it to
the patient record (see Section 11.);
✦
Report Button: this button allows you to create a report of the test
(see Section 5.)
7.4 Screening Test
Figure 18 is the SCREENING TEST.
On the top, you can choose if you are going to perform screening tests to
a school's children or to a company's employees.
FIGURE 18.
20
On the left you will see a list of the children/employees that have been
tested and on the right, is the Main Panel that allows you to select stimulus
characteristics.
First of all, add child’s information and then you can customize the tone
that will be presented. You can choose:
✦
Which ear is to be tested;
✦
Which Stimulus is to be used; ✦
Which Type of Tone: Steady, Warble ( 5Hz freq. modulation and 10%
of modulation index), Pulsed ( 200 ms pulse duration);
✦
The threshold that is be used;
✦
Which frequency is to be used;
Then, to play the tone press the PLAY button and to stop the tone just
release the PLAY button. You can take note of the results choosing between
“+” for “Pass” and “-“ for “Fail”. Once the test is completed, you can add a
recommendation in the “Recommendation” field and set the result by
tapping on “Pass” or “Fail” check button on the upper part of the screen. To
save the results, press the SAVE button on the bottom.
You can then proceed to testing this child. If you need to EDIT the
information in any of the “tested” children (left panel), tap on the child’s
name, make your changes and then tap on the SAVE button.
On the top, you can use two important functions of the “Screening Test”
section:
✦
Measure Ambient Noise Level: by pressing this button, you can
access to the built-in sound level meter to measure the actual noise
level in dbSPL, Figure 19.
✦
Generate Parent Letter: by pressing this button, you can generate a
parent letter. You can set the scheduled date for the Hearing
Screening, that will be included in the letter, and the name of the
clinician and the clinician’s signature. Then, press on SEND on the top
right to: email the letter, open the PDF with another application
installed on your iPad, print the letter with a AirPrint® printer.
21
FIGURE 19.
Pressing the EXPORT button on the bottom right, you can choose to
generate:
✦
Individual Hearing Screening Report: first of all, you have to select
the child of which results you want to export, then you can enter
additional information such as the “Tympanometry Screening” results
and the “Otoacustic Emissions Screening” results. You can change or
confirm the Screening Result based on the other results. Also, you can
add a comment and a recommendation. Before you generate the
report, you can choose if you want to include a Parent Letter as first
page or to not include it by checking or unchecking the check button
on the bottom. When you are ready, press the “DONE” button on the
top right to: email the letter, open the PDF with another application
installed on your iPad, print the letter with a AirPrint® printer.
✦
Classroom Roster Form: you can add the School name, the
Teacher’s name and the Grade and the Room. Then, press on “DONE”
on the top right to: email the PDF, open the PDF with another
22
application installed on your iPad, print the letter with a AirPrint®
printer. In addition, if you select the option “EXPORT A ROSTER FORM
WITHOUT RESULTS” you can generate a PDF without results and use
the letter to fill it by hand.
N.B. Your screening session will be saved automatically each time you
make some changes, but if you press “CLEAR” button on the top of the
“CHILDREN/EMPLOYEES TESTED” list, the current session will be
cleared of all the results obtained.
23
8. Speech Tests
8.1 Speech Reception Threshold (SRT) and
Speech Discrimination Test (SD)
Figure 20 are the SRT/SD TESTS.
FIGURE 20.
With iAudiometer you can use your Speech Material, uploading it through
iTunes. Here http://youtu.be/VJZVSahgPWY you can see how upload your
audio files into iAudiometer.
The Settings Panel in Figure 21 allows you to choose which speech
material do you want to use. If you choose your own material, you have to
indicate in which channel the noise and the speech are located, and if the
first word of the audio file has to be excluded in the counting of the words.
24
FIGURE 21.
On the left in Figure 20 there is the Master Settings Panel of the test
allows you to choose:
✦
Which ear is to be tested;
✦
Which Stimulus is to be used: Air, Bone or Sound Field;
✦
If the test is performed with or without Masking, you can adjust the
amplitude. You can also select the type of Noise:
•
•
•
•
Noise from Audio files;
White Noise (WN);
Speech Noise (SN);
Pink Noise (PN).
Immediately below, it is possible to:
✦
choose if you want to perform the SRT Test or the SD Test;
✦
clear Results panel or Words panel;
25
On the top center, there is the list of words (if you have chosen the
default speech material) or the list of audio files (if you have chosen the
default speech material) to be presented: tap on a word (or on a file) and
press Play Button.
In Result Panel, there are the Correct, Wrong and Skip Buttons: each
time a word is played, you can set it as “Correct” or “Wrong”, or you can
skip it (the word will be not counted in the number of “Words Played”) .
Pressing the Record Button, you will record results on the panel on the left.
Below there are:
✦
Play/Pause Button;
✦
Stop Button;
✦
the counting of the words in order to show you which word is
playing.
Also here, there are the: ✦
Save Button: pushing this button, the test will be saved, adding it to
the patient’s record (see Section 11);
✦
Report Button: this button allows you to create a report of the test
(see Section 5.)
26
8.2 PI-PB Function Test
In Figure 22 the PI-PB FUNCTION TEST. FIGURE 22.
With iAudiometer you can use your Speech Material, uploading it through
iTunes. Here http://youtu.be/VJZVSahgPWY you can see how upload your
audio files into iAudiometer.
The Settings Panel in Figure 21 allows you to choose which speech
material do you want to use. If you choose your own material, you have to
indicate in which channel the noise and the speech are located, and if the
first word of the audio file has to be excluded in the counting of the words.
On the left in Figure 22 there is the Master Settings Panel of the test
allows you to choose:
✦
Which ear is to be tested;
✦
Which Stimulus is to be used: Air, Bone or Sound Field;
27
✦
If the test is performed with or without Masking, you can adjust the
amplitude. You can also select the type of Noise:
•
•
•
•
✦
Noise from Audio files;
White Noise (WN);
Speech Noise (SN);
Pink Noise (PN).
the counting of the words in order to show you which word is
playing.
✦
Play/Pause Button;
✦
Stop Button;
On the top center, there is the list of words (if you have chosen the default
speech material) or the list of audio files (if you have chosen the default
speech material) to be presented: tap on a word (or on a file) and press Play
Button.
In Result Panel, there are:
✦
The Correct, Wrong and Skip Buttons: each time a word is played,
you can set it as “Correct” or “Wrong”, or you can skip it (the word will
be not counted in the number of “Words Played”);
✦
Draw Button: this button allows you to record the results. For each
amplitude tested you have to Tap this button in order to Save the
results;
Here are the other buttons:
✦
Save Button: tapping this button, the test will be saved, adding it to
the patient record (see Section 11.);
✦
Report Button: this button allows you to create a report of the test
(see Section 5.)
28
8.3 Psst!™
In Figure 23 the Psst!™ stimuli are shown.
FIGURE 23.
On left panel are the:
✦
SRT and SD Buttons to choose if you want to perform the SRT Test
or the SD Test;
✦
Left and Right Buttons to choose which ear is to be tested;
✦
Bone and Air Buttons to choose which conduction will be used;
✦
Amplitude Buttons to choose the amplitude;
✦
Record Button; ✦
Results.
Note: On the top panel it is possible to hide the left panel in order to show
the full screen with the pictures. 29
In addition it is possible:
✦
Show the first panel;
✦
Play words, when the word is playing, the pictures are shown. When
the child touches a picture it will automatically record the response as
either correct or incorrect;
✦
Save: Tapping this button, the test will be saved, adding it to a
patient’s record (see Section 11.);
✦
Send: this button allows to create a report of the test (see Section 5).
9. Tinnitus Evaluation Program™
In Figure 24 the first part of the TEP™ are shown.
FIGURE 24.
30
There are:
✦
✦
Patient Information Panel: here it is possible to enter Patient's data
or import Data from the iA database (see Section 2);
Patient History Panel.
Pressing the Next Button on the top right, takes you to the second part of
the evaluation where there are three panels (Figure 25):
✦
Tone Panel: this is hi-lighted only if the patient said that their tinnitus
sounded like a Tone;
✦
Noise Panel: this is hi-lighted only if the patient said their tinnitus
sounded like Noise
✦
Display Panel displays either the Tone and/or Noise frequency and
amplitude.
FIGURE 25.
31
This evaluation part is divided into three phases (Figure 26):
1.
Matching - it is necessary to match the frequency and the amplitude,
until it sounds like their tinnitus
2.
Masking - it is necessary to increase the intensity until they no longer
hear their tinnitus
3.
Residual Inhibition - pressing the PLAY Button, the signal will
automatically be presented at an intensity that is +10 dB above their
Minimum Masking Level and will be presented for 60 seconds. At the
end of 60 seconds, the sound will turn off and the timer will count
down for another 60 seconds. At the end, you must ask the patient to
describe their tinnitus.
FIGURE 26.
Pressing the Next Button on the top right, the Report of Evaluation will
be displayed (Figure 27). It is possible for you to:
✦
Enter Recommendations
✦
Save: tapping Save Button, the test will be saved, adding it to a
patient (see Section 11.);
✦
Send: tapping the Report Button it will create a report of the test
( see Section 5.);
32
FIGURE 27.
10. Transducers
On each Test (on the top right) are a list of the ONLY transducers that you
can use: pressing the GEAR Button a new view becomes visible (Figure 28)
in which it is possible to change the transducer. The supported transducers
are:
1.
Headphone TDH-39 (10Ω);
2.
Headphone TDH-49 (10Ω);
3.
Insert Earphone ER-3A (10Ω);
4.
Insert Earphone ER-5A (10Ω);
5.
Headphone DD 45 (10Ω);
6.
Bone Vibrator B-71;
33
FIGURE 28.
11. Save Function
In Save View, in figure 29, it is possible:
✦
to add a comment;
✦
to enter Clinician Information (see Section 12.) that will be associated
to the test;
✦
to choose to add test to a patient’s Report that had already been
saved in a prior iA database, or add a new patient to the database;
Tapping the Save Button on the top right, the patient and their tests will be
saved. 34
FIGURE 29.
12. Settings
In this Setting View, Figure 30, it is possible to enter all Clinic Information
and its logo in order to retrieve them automatically on the Clinical Report. To
insert your logo, tap on the box and choose from the iPad album the logo
you want to use. Drag and zoom to center logo. If the logo is not on your
iPad album, then it is possible to import it into the iPad album by an email
attachment or surfing on web.
In addition it is possible to add all of the clinicians that will be using the
iAudiometer. In this way, once the clinician performs a test and wants to
report it, they can add their information and signature.
To draw the signature it is possible to use your finger or a compatible
stylus for the iPad.
35
FIGURE 30.
13. Calibration
This section, in figure 31, is strictly intended for the Calibration Technician.
On the top right, you or your technician can set a password (Figure 32) to
protect the right calibration values saved.
This is a simple method to verify the conformity to the ANSI 3.6-2010 and
if the outputs are not within the tolerances of the ANSI Standard, then it
allows you to adjust the SPL values in order to bring the output within the
Standards.
On the top panel it is possible to choose:
✦
which transducers will be used in the measurements
✦
which sound will be verified
✦
which channel will be verified;
36
FIGURE 31.
On the Frequency Panel, it is possible to select which frequency has to
be verified, and at what amplitude the sound will be generated. On the bottom left panel there are the main controls:
✦
Increments Buttons;
✦
“+” and “-” Buttons;
✦
Play Button;
✦
Save Button;
On the Right, there is a panel in which the calibration procedures are
explained, as below:
✦
✦
Select the type of transducers and then select the Output (Left or
Right);
Connect the transducer to the iPad using a stereo adapter;
37
FIGURE 32.
✦
Select the type of output to be tested;
✦
To present the tone, press the PLAY button and press again to STOP
(Note: Do not the change Frequency while the signal is in playing). ✦
If you chose the Pure Tone, select the frequency and the tone will be
presented at the level shown in the bottom of panel <Frequency>;
✦
If you chose the White Noise, it will not be possible to select the
frequency, but the noise will be presented at the level shown in the
bottom of panel FREQUENCY ;
✦
If you chose Speech, 1000 Hz will automatically be selected and the
Reference output will be displayed in the bottom of the panel
FREQUENCY. ✦
If you chose NBN, select the center frequency of the noise. The
value of the reference output will be shown under <Output level (dB
HL)> (For the specifications of the NBN, see the data sheet).
Calibration Tolerances:
38
✦
If the output value is within the limits included in the Standards, you
can proceed with a new test or return to the main screen.
✦
If the measured value output is outside the limits specified by the
standards, you can adjust the value by adjusting the output by
selecting the step increment and then pressing the + or -, if the value is
less or greater than the limits included in the Standards. If the new
measured value is within the limits , you can save this value by
pressing the Save button. Then you can proceed with further measures
or return to the main screen.
Below is an Example of a calibration using a TDH-39 , Pure Tone , Left ,
1000Hz:
1.
Tone is presented at 70 dB HL, corresponding to the ANSI S3.6 2010 of 77 dB SPL.
2.
If the measured dB SPL is 82.4 then, 82.4 dB SPL > (77 ± 3), and
therefore the selected step size is <2 dB SPL>, so you would press the
- button.
3.
Now the SPL measures 80.4 dB SPL. Since 80.4 > (77 ± 3), it is still
above the Standard, so now you select the step <0.5 dB SPL>,
increment proceeds to press the - button.
4.
The SPL now measures 79.9 dB SPL so, the output meets the ANSI
standard.
5.
To save, tap on <Save> button.
6.
Repeat the same procedure for the remaining frequencies.”
Special Note
Certificate of Calibration: You will need the Serial Number of the iPad.
39