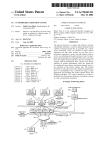
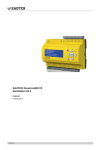
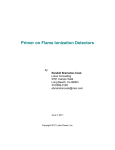
1
Model 633 Aethalometer® Black Carbon Monitor User Manual © TELEDYNE ADVANCED POLLUTION INSTRUMENTATION 9480 CARROLL PARK DRIVE SAN DIEGO, CA 92121-5201 USA Toll-free Phone: Phone: Fax: Email: Website: Copyright 2012-2014 Teledyne Advanced Pollution Instrumentation 800-324-5190 858-657-9800 858-657-9816 [email protected] http://www.teledyne-api.com/ 07645B DCN6853 05 March 2014 NOTICE OF COPYRIGHT © 2012-2014 Teledyne Advanced Pollution Instrumentation, user manual expanded and edited with permission from Aerosol d.o.o./Magee Scientific. All rights reserved. TRADEMARKS The Aethalometer® is a registered trademark of Magee Scientific and the instrument is manufactured by Aerosol d.o.o. in Slovenia. All other trademarks, registered trademarks, brand names or product names appearing in this document are the property of their respective owners and are used herein for identification purposes only. 07645B DCN6853 i ® Model 633 Aethalometer Black Carbon Monitor User Manual Teledyne Advanced Pollution Instrumentation This page intentionally left blank. ii 07645B DCN6853 TABLE OF CONTENTS 1 INTRODUCTION 5 1.1 Description 5 1.1.1 ‘DualSpot™’ Technology 6 1.1.2 % Biomass Burning 10 1.1.3 Automatic Zero and Span 11 1.1.4 User and Communications Interfaces 13 1.1.5 Modular Construction 13 1.2 Technical Specifications 14 1.3 Functional Description 15 2 SAFETY NOTES and LABELS 21 3. INSTRUMENT INSTALLATION 25 3.1 Unpacking the system 25 3.2 The sampling line 25 3.3 Powering on the Aethalometer 27 3.4 Filter tape installation 29 3.4 Manually lifting/lowering chamber optical head 36 4 USER INTERFACE, SETTINGS and OPERATION 37 4.1 User interface and settings 37 4.2 Instrument Status 39 Single Status Condition 40 Multiple Status Conditions 41 4.3 Downloading and Viewing Data Data file structure and description of the fields 41 43 4.4 Connecting to External Datalogger or PC 46 4.5 Serial Commands for Communication with the Aethalometer 47 4.6 External Devices 48 4.7 Software upgrade 49 4.8 BC source apportionment 49 4.9 Screen saver 50 07645B DCN6853 iii ® Model 633 Aethalometer Black Carbon Monitor User Manual Teledyne Advanced Pollution Instrumentation 5 MAINTENANCE and SERVICE 51 5.1 Cleaning the cyclone 52 5.2 Leak test 54 5.3 Automatic flow meter calibration 55 Automatic flow calibration procedure 5.4 Manual flow meter calibration Manual flow calibration procedure 56 59 59 5.5 Manual stability test 65 5.5 Manual clean air test 65 5.6 Cleaning the optical head 66 5.7 Changing the bypass cartridge filter 69 5.8 Calibrating the tape sensor 72 5.9 Flow verification 74 Equipment required 74 Flow verification start 74 Auto flow verification 74 Manual flow verification 75 Results 75 5.10 Neutral Density (ND) filter test 75 Equipment required 75 ND filter test start 76 Results 76 6 TECHNICAL SUPPORT and CONTACT INFORMATION 77 This page intentionally left blank. 78 7 SPARE PARTS LIST 79 iv 07645B DCN6853 1 INTRODUCTION 1.1 Description Figure 1. The Aethalometer® Model 633. The Model 633 represents the “Next Generation” version of the real-time Aethalometer rackmount instrument to measure Black Carbon (BC) particles in air. Please refer to the original Magee Scientific Aethalometer manual for a full description and background information on the method (http://mageesci.com/images/stories/docs/Aethalometer_book_2005.07.03.pdf). The Model 633 Aethalometer incorporates scientific and technical advances designed to offer improved measurement performance versus previous versions of the Aethalometer and other BC instruments, user features, communications and interface, and the ability to perform routine performance tests to verify correct operation. Most importantly, the instrument incorporates the patented DualSpot™ measurement method. This provides two significant advantages: elimination of the changes in response due to ‘aerosol loading’ effects; and a realtime calculation of the ‘loading compensation’ parameter which offers insights into aerosol optical properties, and has been interpreted in models of aerosol origins and aging. 07645B DCN6853 5 ® Model 633 Aethalometer Black Carbon Monitor User Manual Teledyne Advanced Pollution Instrumentation The Model 633 Aethalometer has been developed with input from the research and monitoring communities, and is designed for reliable operation under all conditions ranging from state-of-the-art research to compliance monitoring. The leading innovations incorporated into the Model 633 include: The DualSpot™ measurement method, which solves the effects common to all filterbased real-time monitors, in which the instrumental response factor shows a dependence on the loading of material on the filter. Features for automatic ‘dynamic zero’ testing under a flow of internally-generated clean air; ‘span’ testing of the response of the optical sources and detectors; calibration of the response of the internal mass flow meters, if an external standard flow calibrator is connected; and validation of the photometric response by use of a kit of ‘Neutral Density’ optical filters whose properties may be traced to reference standards. User and communications interfaces, permitting remote monitoring of operation; data retrieval; performance of internal tests; and reporting of ‘state-of-health’ parameters. Modular construction designed for ease of routine maintenance service. In addition to the above features, the Model 633 Aethalometer offers real-time aerosol absorption analysis at up to seven optical wavelengths, with rapid time resolution to 1 second even in multiple-wavelength mode. This permits the measurement of optically-absorbing aerosols – ‘Black’ Carbon and ‘Brown’ Carbon components of particulate matter – in applications including routine monitoring of ambient air quality for regulatory purposes; measurements of the concentration of BC in urban, suburban, regional, rural and remote locations; source testing; and laboratory-based research. 1.1.1 ‘DualSpot™’ Technology The Model 633 Aethalometer uses the patented DualSpot™ method to compensate for the ‘spot loading effect’; and also to provide a real-time output of the ‘loading compensation’ parameter, which may provide additional information about the physical and chemical properties of the aerosol. 6 07645B DCN6853 Teledyne Advanced Pollution Instrumentation ® Model 633 Aethalometer Black Carbon Monitor User Manual The ‘spot loading effect’ is a variable phenomenon which appears as a gradual reduction of instrumental response as the aerosol deposit density of the filter tape increases from zero to the predetermined limit of ‘Maximum Attenuation’ (Gundel 1984, Weingartner 2003, Arnott 2005, Virkkula 2007, Kanaya 2008). When the filter tape advances to a fresh spot, the data undergoes a discontinuous jump from its previous lower value, calculated when the spot was heavily loaded; to a higher value, calculated from collection on a fresh spot at zero loading. In the Aethalometer the reduction of data at increasing loadings is well described by a linear function of attenuation, but its magnitude cannot be predicted: some aerosols in some locations in some seasons may show a small or zero ‘loading effect’; while under other conditions, the effect may be larger and noticeable. Empirically, it is found that fresher aerosols closer to their combustion sources will show a larger ‘spot loading effect’; while wellaged aerosols under atmospheric conditions of high chemical activity and oxidative processing may show an almost zero effect. The effect is revealed statistically by processing data collected over a large number of tape advances, representing many data points collected at loadings (‘ATN values’) ranging from zero to the preset maximum. The data is collected into bins according to loading (attenuation, ATN). If there is a systematic reduction of the calculated result as a function of loading, the data will show a clear negative slope, with the intercept representing the ‘zero loading’ value. Figure 2 illustrates two datasets from urban locations with loading effects either present or not. 07645B DCN6853 7 ® Model 633 Aethalometer Black Carbon Monitor User Manual Teledyne Advanced Pollution Instrumentation Figure 2. Aethalometer data sorted and averaged according to loading (attenuation, ATN) on spot – roadside location in London, UK (top); urban site in Boston (Roxbury), USA (bottom). The London data show a systematic reduction at increasing loadings; while the Boston data do not. This demonstrates that any method intended to compensate for the ‘spot loading effect’ must be auto-adaptive and able to adjust dynamically to different situations. An instrument based on firmware with a fixed ‘loading non-linearity’ parameter will not operate correctly at all locations. The ‘loading non-linearity’ parameter must be measured. 8 07645B DCN6853 Teledyne Advanced Pollution Instrumentation ® Model 633 Aethalometer Black Carbon Monitor User Manual It is clear that the effect, when present, is linear with loading (‘ATN’). This can be represented as: BC (reported) = BC (zero loading) * { 1 - k • ATN } where BC (zero loading) is the desired ambient BC value that would be obtained in the absence of any loading effect; and k is the ‘loading compensation parameter’ (similar to Virkkula, 2007). The analysis of a large number of datasets from a wide variety of locations shows that this relationship is linear in all cases studied; but with different values of k. It is therefore possible to eliminate the ‘loading effect’ of k by making two simultaneous identical measurements BC1 and BC2 at different degrees of loading ATN1 and ATN2. BC1 = BC * { 1 - k • ATN1 } BC2 = BC * { 1 - k • ATN2 } From these two linear equations we may calculate the ‘loading compensation parameter’ k; and the desired value of BC compensated back to zero loading. The Model 633 Aethalometer analyzes the Black Carbon component of aerosols on two parallel spots drawn from the same input stream, but collected at different rates of accumulation, i.e. at different values of ATN. By combining the data according to the above equations, the Model 633 yields the value of BC extrapolated back to ‘zero loading’; as well as a real-time output of the ‘loading compensation parameter’ k which provides insights into the aerosol nature and composition. This process is performed in real time for all wavelengths: examination of the ‘k’ values as a function of wavelength provides further information about the aerosol composition. An example of this is shown for extreme concentrations of black carbon (Figure 3). 07645B DCN6853 9 ® Model 633 Aethalometer Black Carbon Monitor User Manual Teledyne Advanced Pollution Instrumentation IR, 1 second raw BC1 raw BC2 compensated BC 3 BC concentration (ng/m ) 80000 60000 40000 20000 0 2000 3000 4000 time (sec) Figure 3. The time-series of 633 raw and compensated BC concentrations with 1 second timebase – note the extreme concentrations and loading effects. 1.1.2 % Biomass Burning The Model 633 Aethalometer® instrument uses the principles of aerosol light absorption to measure Black Carbon mass concentration. The measurement is done using an assumed aerosol cross sectional absorption coefficient from the raw light absorption measurements (Hansen, The Aethalometer Manual). The aerosol light absorption coefficient that is applied in the Aethalometer instrument is a function of the filter media being used to collect the sample, and is dependent on the incident LED wavelength. The Model 633 Aethalometer uses a 7-wavelength (370, 470, 525, 590, 660, 880, and 940nm) light source and a Teflon coated glass fiber filter media. For this configuration, the cross sectional absorption coefficients (also called sigmas) for each wavelength are chosen (18.47, 14.54, 13.14, 11.58, 9.89, 7.77, and 7.19, respectively). These sigma values are used in the instrument software to calculate a normalized Black Carbon particulate matter measurement for each measurement wavelength from the raw light absorption measurements. In the atmosphere, Black Carbon particles exist in a variety of mixing states and in some cases coexist with particles of other composition and physiology. The mixing state is heavily dependent on the combustion fuel and proximity of the sampled aerosol to the source, as well as other factors. Two classic examples of Black Carbon found in a typical ambient environment come from wood and diesel combustion. To the naked eye, a smoke plume coming from a diesel tailpipe looks 10 07645B DCN6853 Teledyne Advanced Pollution Instrumentation ® Model 633 Aethalometer Black Carbon Monitor User Manual different than one from a pile of burning leaves. The main reason is that wood smoke contains a large fraction of aromatic organic compounds, which tend to absorb shorter light wavelengths to s larger extent (i.e. UV) than the longer wavelengths (i.e. IR). Contrarily, due to the absence of these aromatic compounds, diesel smoke tends to absorb light more uniformly across all wavelengths and thus, appears very black to the eye. This spectral absorption dependence result, also termed an Ångström exponent, can be measured by a multiple wavelength Aethalometer instrument, providing essentially an optical fingerprint of the combustion source. The 7-wavelength Aethalometer instrument has been well characterized over the years for this unique capability, and scientists have developed various ways of using this “spectral” light absorption dependence to come up with signatures or fingerprints of different sources. Not surprisingly, the most well characterized combustion sources are biomass (i.e. wood) and diesel fuel contained in ambient air. In the latest software release for the Model 633 (version 1.1.0.0), an algorithm has been introduced to utilize the 7-wavelength absorption data to a model and output a % wood smoke. As with any model, there are assumptions applied here, so it is not an absolute measure, but can be used as an indicator and considered a semi-quantitative measurement for source apportionment purposes in ambient air quality assessments. The value is provided in units of percentage (%) and is on a 0-100% scale. Further details about the location of these data and how to set up the front panel to display the % biomass burning values are provided later in this manual. The internal algorithm is based on a model developed by Sandradewi et al. (2008). For a full technical explanation of the algorithm, see Sandradewi, J. et al. (2008), Using Aerosol Light Absorption Measurements for the Quantitative Determination of Wood Burning and Traffic Emission Contributions to Particulate Matter, Environ. Sci. Technol. 42, 3316–3323. 1.1.3 Automatic Zero and Span The Model 633 Aethalometer is capable of automatically checking the ‘zero-air’ response of the instrument under dynamic operating conditions. This test is implemented by backflushing the inlet connection with an excess flow of internally-filtered air and circulating the filtered air in the instrument. The data reported during this period are analyzed for the mean value and the point-to-point variation. The mean value should be close to zero under ideal 07645B DCN6853 11 ® Model 633 Aethalometer Black Carbon Monitor User Manual Teledyne Advanced Pollution Instrumentation conditions; any positive value greater than zero represents the leakage of BC-containing room air into the instrument’s analytical zone. The point-to-point variation represents the instrument’s measurement noise level under actual operating conditions of actual flow – i.e., a ‘dynamic’ test. The point-to-point variation for the wavelength 370 nm at the time-base set to one second is about 125 ng/m3, which translates to a couple of ng/m3 at 1 minute time resolution (Figure 4). 2500 1 second time-base 2000 30 per. Mov. Avg. (1 second timebase) 1500 Point-to-point variation @ 1 second: 1000 126 ng/m3 131 ng/m3 119 ng/m3 500 0 14:30:00 14:35:00 14:40:00 14:45:00 14:50:00 14:55:00 15:00:00 15:05:00 15:10:00 -500 Figure 4. ‘Zero-air’ check – the Model 633 Aethalometer switches from sampling ambient air to filtered air – 1 second time resolution point-to-point variation is very stable. The response of the optical detectors of the Model 633 Aethalometer may be verified using a standard kit of Neutral Density optical filters. These are glass elements with a range of known and stable optical absorptions, from light to dark, which are traceable from manufacturing records back to primary standards. When these are inserted into the Model 633 Aethalometer, its photodetectors will give a certain output signal. The stability and reproducibility of the relationship between optical signal and ND Filter density from one validation test to another; and the comparison with the original factory values; is a measure of the consistency of performance of the instrument’s optics. 12 07645B DCN6853 Teledyne Advanced Pollution Instrumentation ® Model 633 Aethalometer Black Carbon Monitor User Manual 1.1.4 User and Communications Interfaces The Model 633 Aethalometer incorporates the following user, data and communications features: • 21-cm (8.25”) color graphics touch-screen for data display and local user interface; • USB ports for insertion of a memory stick for local data download; • USB ports for connection of a keyboard, if necessary for initial setup of parameters, such as station identification; • RS-232 COM ports for data transmission from auxiliary instruments or to the digital datalogger; (Ethernet port installed for future software implementation). 1.1.5 Modular Construction The Model 633 Aethalometer is constructed with a modular design, so that sub-units may be easily serviced. The only item requiring attention in routine use is cleaning of the optical insert to remove accumulated dust or other contamination which may be brought in with the sample air stream. The optical chamber is attached with a bayonet fitting for quick removal; easy cleaning; and reliable re-assembly. The entire instrument is hermetically sealed to reduce the entry of dust. 07645B DCN6853 13 ® Model 633 Aethalometer Black Carbon Monitor User Manual Teledyne Advanced Pollution Instrumentation 1.2 Technical Specifications Operation: Supply voltage: 100-240 V~, 50/60 Hz Max power consumption: 90W Measurement wavelengths: 370, 470, 525, 590, 660, 880 and 940 nm Air flow: adjustable 2, 3, 4 and 5 LPM Environmental operating conditions: Indoor use Altitude: up to 3000 m with internal pump, other configurations possible Temperature range: 10 – 40 degrees Celsius (instrument) Relative humidity range: non-condensing Mechanical specification: Chassis material: sheet metal Front plate material: plastic Dimensions: standard 19”/6U, rack mount Weight: approx. 20 kg Connectors: Sampling air: inlet / outlet type – ¼” NTPF Communication: 3x USB type A, 3x RS-232 COM, 1x Ethernet User interface: 8.4” SVGA display with LED backlight Basic control: touch-screen Optional control: standard PC keyboard and mouse Red, Yellow, Red status LEDs Data storage capacity: 10+ years, at 1-minute intervals 14 07645B DCN6853 ® Teledyne Advanced Pollution Instrumentation Model 633 Aethalometer Black Carbon Monitor User Manual 1.3 Functional Description The Model 633 features modular design and is composed of several subsystems which are so interconnected that most simple and safe handling of the instrument is possible. Presented here are a functional block diagram followed by a flow diagram. MAINS INLET COOLING FAN POWER SUPPLY BACK PANEL Ethernet COM1 COM2 COM3 ELECTRONIC BOARDS AIR INLET USB3 AIR OUTLET AIR AIR PUMP CRC MAIN COMPUTER BALL VALVE MEASUREMENT CHAMBER CHAMBER LIFT MECHANISM UN-ROLL TAPE SPOOL TAPE SENSOR TAPE ADVANCE MECHANISM FLOWMETERS and SOLENOIDS LIGHT SOURCE TAPE SENSOR ROLL-ON TAPE SPOOL TAPE DETECTOR DISPLAY + TOUCHSCREEN FRONT PANEL DOOR USB1 USB2 STAUS LEDS ON/OFF SWITCH DOOR KNOB Figure 5. Model 633 functional block diagram ENCLOSURE The Model 633 enclosure is very robust and made from sheet metal. The enclosure mechanically protects the delicate inner measurement parts. The dimensions of the enclosure meet the rack mount standard for the instrumentation. 07645B DCN6853 15 ® Model 633 Aethalometer Black Carbon Monitor User Manual Teledyne Advanced Pollution Instrumentation POWER SUPPLY The power supply module is composed of the mains inlet, the power supply electronics and the cooling fan. Since the power supply electronics heats up, it is mechanically integrated in a separated and thermally sealed area. MAINS INLET The mains inlet accepts standard EU, US or UK supply cords. It is composed of the inlet itself, the EMC filter, the main fuse and the primary ON/OFF switch. The switch is a part of the power supply module. COOLING FAN The cooling fan is also a part of the power supply module. The control electronics measures the temperature of the power supply area and switches on and off the cooling fan. MAIN COMPUTER The main computer processor also generates quite a lot of heat. It is integrated in the power supply area so it can be cooled down together with the power supply electronics. The highest level control software and the user interface are implemented on the main, PC based computer. ELECTRONIC BOARDS The system features modular design so the electronics is composed of various electronics boards which mechanically fit together with other mechanical modules. The low level control firmware is implemented with microcontrollers, which are located on separate electronic boards so parallel real time data processing is possible. ETHERNET CONNECTOR The Ethernet connector allows the connection of the Model 633 measurement system to Ethernet based communication networks. COM1, COM2, COM3 CONNECTORS The COM connectors allow the connection of the system to RS232 based devices, like external sensors or dataloggers. 16 07645B DCN6853 Teledyne Advanced Pollution Instrumentation ® Model 633 Aethalometer Black Carbon Monitor User Manual USB CONNECTOR (rear panel) The USB connector allows the connection of the system to USB based devices, like external sensors or data processing units. AIR INLET and OUTLET CONNECTORS The air inlet and outlet connector allows the connection of the instrument to external airflow system. The measured air enters the instrument through the inlet connector and leaves the instrument through the outlet connector. BALL VALVE The ball valve is an electrically actuated valve which is connected directly to the inlet connector and connects or separates the instrument from the external air system. CRC The CRC (also called muffler) is a filter used to decrease the noise in the airflow which is created by mechanical rotation of the pump. AIR PUMP The air pump pumps the measured air through the inlet connector, directly to the measurement chamber. It is one of the main components in the system. FLOWMETERS Two flow meters measure the airflow in different points in the system. One of them is used also in the air flow regulation loop. SOLENOID VALVES Three solenoid valves are used to switch the airflow through different airflow paths when the instrument is set in different operating modes like measure, tape advance or similar. 07645B DCN6853 17 ® Model 633 Aethalometer Black Carbon Monitor User Manual Teledyne Advanced Pollution Instrumentation CHAMBER LIFT MECHANISM The chamber lift mechanism allows the measurement chamber to be lifted manually or electromechanically. During tape advance the automated chamber lift procedure is invoked. During tape replacement the manual chamber lift procedure can be engaged. The manual chamber lift mechanism features also a special locking mechanism which simplifies the tape replacement or chamber cleaning procedure. The main electronic components of the chamber lift mechanism are the stepper motor and the chamber lift position sensor. TAPE ADVANCE MECHANISM The advance mechanism allows the instrument to perform automatic tape advances during measurements. The main electronic parts of the tape advance mechanism are a stepper motor and the two tape sensors. ROLL-ON and UN-ROLL TAPE SPOOLS The roll-on and the un-roll tape spools hold the measurement tape. During automated tape advance the tape unrolls from the un-roll spool and rolls on the roll-on spool. If the un-roll spool is empty, the event is detected automatically thanks to the tape sensors. The tape replacement procedure must be performed manually by the operator. The measurement tape is one of the main parts of the system. TAPE SENSORS The two tape sensors are used by the instrument software to detect the amount of tape on the un-roll and roll-on spools. LIGHT SOURCE The light source integrates groups of LEDs of different light wavelengths. It is one of the main parts of the system. DETECTOR The detector detects what amount of light passes through the measurement tape. A special algorithm is used to calculate the black carbon concentration using the information from the detector and the flow meter. 18 07645B DCN6853 Teledyne Advanced Pollution Instrumentation ® Model 633 Aethalometer Black Carbon Monitor User Manual FRONT PANEL DOOR The front panel door can be opened which allows the access to the instrument for tape replacement or chamber cleaning. DISPLAY and TOUCH-SCREEN The display and the touch-screen are the main user interfaces of the instrument. Using this interface the operator can perform all necessary operations for proper functioning of the instrument. USB CONNECTORS (front panel) The two USB ports on the front panel door can be used to connect a keyboard, mouse or a USB key for data download or data upload. STATUS LEDS The red, yellow and green status LEDs show the correct or incorrect operation of the instrument. This status is replicated on the screen with the Status Condition (see Section 4.2 Instrument Status). DOOR KNOB The door knob is used to open the front panel door. ON/OFF SWITCH The secondary ON/OFF switch is located behind the front door. It is electrically connected in series with the primary ON/OFF switch, which is located at the back of the instrument, next to the mains inlet. (Both switches must be set to ON to power up the instrument, but either one can be set to OFF to power down the instrument). 07645B DCN6853 19 ® Model 633 Aethalometer Black Carbon Monitor User Manual Teledyne Advanced Pollution Instrumentation This page intentionally left blank. 20 07645B DCN6853 2 SAFETY NOTES and LABELS CAUTION! READ THIS CHAPTER VERY CAREFULLY BEFORE OPERATING THE INSTRUMENT. Instrument operation Read this User’s manual BEFORE operating the instrument. INCORRECT instrument operation can be DANGEROUS for the operator. Unauthorised instrument access and operation The instrument must be protected against unqualified use. UNAUTHORISED instrument access and operation can be dangerous. The instrument can only be operated by persons who can ensure proper handling due to their qualification, technical skills and practical experience. Electric shock CHECK the mains power supply cord ANNUALLY. If the supply cable is DAMAGED, stop using the equipment and contact your authorized representative. 07645B DCN6853 21 ® Model 633 Aethalometer Black Carbon Monitor User Manual Teledyne Advanced Pollution Instrumentation Fire and explosion NEVER install the instrument in explosion-risk areas and never use the equipment near flammable substances. Instrument overheating ALWAYS assure the instrument operates under proper operating ambient conditions. NEVER install the instrument in spaces with limited air circulation. UV radiation 633 light source contains an ultraviolet (UV) light emitting diode (LED). The LED radiates UV and visible light during operation. Precautions must be taken to prevent looking directly at the UV light with unprotected eyes. NEVER touch or look directly into the Model 633 light source! 22 07645B DCN6853 Teledyne Advanced Pollution Instrumentation ® Model 633 Aethalometer Black Carbon Monitor User Manual Instrument service and repair UNAUTHORISED instrument service and repair procedures are NOT ALLOWED. The instrument can only be serviced, repaired or modified by authorized persons. Please contact your authorized representative if you have any problems with the instrument. Please make sure to have the equipment checked regularly for technical safety. 07645B DCN6853 23 ® Model 633 Aethalometer Black Carbon Monitor User Manual Teledyne Advanced Pollution Instrumentation Moving parts During AUTOMATIC tape advance procedure, the measurement chamber is lifted by a motorized chamber lift mechanism. To prevent any injuries to your fingers, NEVER squeeze your hands or fingers into ANY mechanical apertures, DURING automated tape advance procedure. During MANUAL chamber lift procedure ALWAYS use the chamber lift locking mechanism. To prevent any injuries to your hands or fingers, NEVER squeeze your hands or fingers into ANY mechanical apertures, BEFORE manually lifting the chamber. During filter tape replacement procedure, precaution must be taken, to prevent unintentional injuries to your hands or fingers. 24 07645B DCN6853 Teledyne Advanced Pollution Instrumentation ® Model 633 Aethalometer Black Carbon Monitor User Manual 3. INSTRUMENT INSTALLATION 3.1 Unpacking the system Take the instrument out of the box and place it on an even surface. Keep the back of the instrument accessible. Remember to remove protective caps on the inlet and exhaust ports before operation! Figure 6. Remove protective caps on the rear panel of the instrument before switching it on! 3.2 The sampling line The instrument is supplied with several meters of black conductive sample line tubing designed to minimize electrostatic particle losses in the sampling system. Keep the sampling line as short as possible. Do not attempt to substitute the sampling tubing with tubing from a different material. If substituting the supplied tubing with tubing from other material, please consult the instrument supplier for details. When installing the sample line, try to avoid sharp bends or long horizontal runs with the sample tubing as either of these conditions can promote particle losses in the sample tube. Insulate the sample lines inside the instrument shelter and avoid exposing them to direct 07645B DCN6853 25 ® Model 633 Aethalometer Black Carbon Monitor User Manual Teledyne Advanced Pollution Instrumentation exhaust from the HVAC unit – this can lead to condensation inside the sample line tubing and can damage the instruments and interfere with the measurement. 1. Thread the supplied fitting onto the Sample Inlet port on the rear panel of the Aethalometer (Figure 7, top). Use Teflon tape on the thread. 2. Fit the supplied barbed connector into the end of the black conductive sample tubing (Figure 7, left). 3. Insert the connector into the fitting on the rear panel of the instrument (Figure 7, right). Figure 7. Connecting the sampling line. Connect the other end of the sample line tubing to the sampling manifold or to the inlet on the outside of the measurement station. Make sure that any openings in the station walls or ceiling is leak-proof. If not using a size selective inlet, please make sure to keep the end of the tubing 26 07645B DCN6853 Teledyne Advanced Pollution Instrumentation ® Model 633 Aethalometer Black Carbon Monitor User Manual inverted so rain cannot enter. A funnel on the sampling end of the inverted sample line tubing with the opening covered by a mesh screen is recommended. Alternatively, the optional insect screen can be installed near the sampling end of the tubing. The inlet should be unobstructed, securely fixed and placed at an appropriate distance from the roof or walls of the station. Please consult the appropriate national and international technical standards for particulate matter sampling and analysis for details. 3.3 Powering on the Aethalometer Connect instrument to AC power and turn on. The instrument has two power-on switches – one on the rear panel (Figure 8, top) and another on the front inside the door on the right (Figure 8, bottom). Set both switches to the ON position. Figure 8. Power on switches: rear panel (top photo) and front inside the door on the right (bottom photo). Upon start-up, the instrument will proceed through an initialization period which can take up to 5 minutes (Figure 9). Various subunits are tested during this period and test results are 07645B DCN6853 27 ® Model 633 Aethalometer Black Carbon Monitor User Manual Teledyne Advanced Pollution Instrumentation indicated by green check boxes for each step. The instrument will automatically begin measurements as quickly as initialization is complete, if the touch screen display remains untouched during the process. Figure 9. The initialization screen with test results. Note that the green spot with a checkmark in its center means that the corresponding system is functioning properly. If there is any kind of error, either a red spot with an x-mark or a yellow spot with an exclamation mark will appear, please contact Teledyne API Technical Support. 28 07645B DCN6853 Teledyne Advanced Pollution Instrumentation ® Model 633 Aethalometer Black Carbon Monitor User Manual 3.4 Filter tape installation In the Operation / General menu (Section 4 provides information about the user interface) press “Stop” to stop measurements. (If the instrument is powered OFF for this procedure, see Section 3.4 Manually lifting/lowering chamber optical head). In the Operation / Advanced menu press “Change Tape” and follow instructions – you will need a fresh roll of filter tape and some adhesive tape. For details, please see below. In the Operation / General menu press “Stop” to stop measurements. In the Operation / Advanced menu press “Change Tape” 07645B DCN6853 29 ® Model 633 Aethalometer Black Carbon Monitor User Manual The first “Tape Change Procedure” screen is displayed while the chamber lifts, then the second “Tape change Procedure” screen is displayed with a prompt to change tape. Teledyne Advanced Pollution Instrumentation Wait to lift chamber. Start changing filter tape: First remove the transparent tape retention disk on the left … … then on the right. 30 07645B DCN6853 Teledyne Advanced Pollution Instrumentation ® Model 633 Aethalometer Black Carbon Monitor User Manual Slide tape from beneath the optical chamber and remove the used tape. Keep the empty roll for use with new, replacement tape. Using transparent tape, attach end of new tape to empty roll. 07645B DCN6853 31 ® Model 633 Aethalometer Black Carbon Monitor User Manual Teledyne Advanced Pollution Instrumentation Center carefully for even alignment. Tape direction is from bottom, left to right. 32 07645B DCN6853 Teledyne Advanced Pollution Instrumentation ® Model 633 Aethalometer Black Carbon Monitor User Manual Insert the new tape roll on the left side of the chamber and run the tape under the left guide-arm. Slide the tape under the optical head, then run it under the right guide-arm and install the empty roll on the right. There may be some slack in the tape. 07645B DCN6853 33 ® Model 633 Aethalometer Black Carbon Monitor User Manual Teledyne Advanced Pollution Instrumentation Ensure the tape is taut between the two sides. Replace the transparent tape retention disks. Close the door and press OK on the display screen. 34 07645B DCN6853 Teledyne Advanced Pollution Instrumentation ® Model 633 Aethalometer Black Carbon Monitor User Manual The next “Tape Change Procedure” screen prompts you to wait for the chamber to return to home position. The next screen provides notice when the tape change procedure is finished. Press OK. Figure 10. Changing filter tape 07645B DCN6853 35 ® Model 633 Aethalometer Black Carbon Monitor User Manual Teledyne Advanced Pollution Instrumentation 3.4 Manually lifting/lowering chamber optical head In case the instrument is turned off, the chamber can be lifted manually, as follows: (Stop measurements first: Operation>General>Stop). Note the retention pin at the top of the chamber optical head. Grasp the optical head securely in both hands with fingers at bottom and thumbs on top, pressing retention pin down and raising optical head up. Figure 11. Manually Lifting the Chamber Optical Head ATTENTION! – If the chamber is lifted while instrument is operating (STOP button not pressed), it is not possible to restart the measurement without cycling the instrument power. (Flip both power switches to OFF; then flip each to ON). 36 07645B DCN6853 Teledyne Advanced Pollution Instrumentation ® Model 633 Aethalometer Black Carbon Monitor User Manual 4 USER INTERFACE, SETTINGS and OPERATION 4.1 User interface and settings There are four 1st level menu tabs in the touch-screen user interface: HOME, OPERATION, DATA, and ABOUT (Figure 12), described as follows: HOME with the following parameters: o BC - the measured values for Black Carbon (measured at 880 nm) o UVPM - UV particulate matter (measured at 370 nm) OR o %BB – the % biomass burning as measured and calculated through the analysis of all 7-wavelength absorption channels o REPORTED FLOW - measured flow (in LPM) o TIMEBASE - timebase setting (in seconds) o TAPE ADV. LEFT - the amount of remaining tape (in ) o STATUS – instrument status: green (all OK), yellow (check status), and red (stopped) with a Status Condition (see Section 4.2 Instrument Status), o Bottom of HOME screen shows date and time. Note: The BC and UVPM values will typically be similar, but not exactly the same. If aromatic compounds are present in the sampled air (such as when sampling fresh wood-smoke, for example), the UVPM concentration will exceed the BC mass concentration value significantly, depending upon the amount and type of organic material present. UVPM display can be changed to %BB by going into the Operations Advanced Tab. Check the box which shows “Proc BB”. OPERATION with four sub-tabs: GENERAL, ADVANCED, LOG and MANUAL. GENERAL where one can change the settings: o Flow (LPM) Note: flow-reporting standard: These are the pressure and temperature which the instrument uses to report flow. By choosing to report mass flow, (101325 Pa, 21.11 C) are used to convert the measured mass flow to reported volumetric flow at these conditions (these are values used by the flow meter in the Model 633). These values can be substituted for any other (pressure, Temp) values, should you want the flow to be reported at 0 C, or 25 C for example. Optionally, you can choose volumetric flow at ambient conditions to be reported. To do that you need an optional weather station accessory kit (available from Teledyne API, part number DU0000200). This external device is connected to one of the rear RS-232 COM ports, please see below (Section 4.6 External devices). o TimeBase (seconds) 07645B DCN6853 37 ® Model 633 Aethalometer Black Carbon Monitor User Manual Teledyne Advanced Pollution Instrumentation o select one of three radio buttons: TA ATNmax - maximum attenuation at which the Aethalometer advances tape TA INT - the time interval at which the Aethalometer advances tape (hours) TA Time - the time at which the Aethalometer advances tape o Start, Stop, Stability, Clean air, and Change Tape buttons ADVANCED with all parameters which can be set in the Aethalometer. LOG with the last operational reports of status, parameter changes, data download. MANUAL with basic commands, to operate hardware (solenoids, pump, chamber, TA) DATA with two sub-tabs: TABLE and EXPORT. TABLE where raw measurement values are reported, BC concentration calculated from each individual spot (BC1, BC2), and the compensated BC concentration. All three concentrations have the unit ng/m3. EXPORT with selection data to be copied to USB SYSTEM RESTORE allows for restoration of the old setup file with all instrument settings. You can select a setup file with a date & time in the name. DATA IMPORT allows for importing data from the thumb drive. The data must be in the same folder and format as it is when exported to the thumb drive. ABOUT – features and contact information. 38 07645B DCN6853 Teledyne Advanced Pollution Instrumentation ® Model 633 Aethalometer Black Carbon Monitor User Manual Black Carbon Particle Monitor Model 633 This is a Magee Scientific Aethalometer® Model AE33 with DualSpot™ technology. Manufactured in Slovenia by Aerosol d.o.o. and sold by Teledyne API under license. Figure 12. The Aethalometer HOME, OPERATION, DATA and ABOUT screens, clock-wise from top left. 4.2 Instrument Status The instrument’s current status condition is displayed in decimal format on the front panel HOME screen and in the Status column of the data download. The status condition relates to various subcomponents of the instrument, e.g., Detector, Flow, LED, etc. The decimal number represents a sum of all of the status conditions occurring at any given time. (Multiple status conditions are interpreted using subtraction of the largest possible Status Condition value using the table below). Table 1. Status Conditions and Descriptions. 07645B DCN6853 39 ® Model 633 Aethalometer Black Carbon Monitor User Manual Parameter Operation Status Condition 0 1 2 3 1024 2048 3072 4096 0 Description Measuring Tape advance (tape advance, fast calibration, warm-up) First measurement – obtaining ATNO Stopped Flow OK Flow out of limit (low/high by more than 0.25 LPM) Check flow status history Flow out of limit (low/high) and Check flow status history Chamber OK Chamber error LEDs OK Calibrating Calibration error in one or more channels (at least one channel OK) LED error (all channels calibration error, COM error) Filter tape OK Tape warning (less than 30 spots left) Tape last warning (card box visible, less than 5 spots left) Tape error (tape not moving, end of tape) No test Stability test Clean air test Change tape procedure Optical test Connection 8192 Connection error Flow 4 8 12 Chamber LED 16 32 48 Filter Tape 128 256 384 Tests & Procedures External Device Teledyne Advanced Pollution Instrumentation When Status Condition 3 is encountered, the Aethalometer stops. In all other statuses, it continues to operate with a warning, and the data are flagged accordingly. The status is represented by one value, which can point to one condition or a combination of conditions. Single Status Condition If the value displayed matches a value in the Status Condition column, it indicates only one parameter and its description. Examples: 40 07645B DCN6853 Teledyne Advanced Pollution Instrumentation ® Model 633 Aethalometer Black Carbon Monitor User Manual - Status = 0, all OK -> front panel LED's GREEN - Status = 1, all OK, tape advancing -> blinking GREEN LED - Status = 128, machine is running, tape advance warning flag is set -> YELLOW Multiple Status Conditions If the Status displayed does not match a value in the table, it means that there are multiple parameters whose Status Conditions are added together, forming a sum that must be broken down by subtraction: find the largest value in the Status Condition column that does not exceed the Status value, and subtract it from the sum. Then Find the next largest value in the Status Condition column that does not exceed the remainder, and subtract again. Continue finding the next largest number and subtracting it until the remainder matches a value in the Status Condition column. Examples: - Status = 289, which breaks down as follows: 289 – 256 = 33; 33 – 32 = 1; therefore, the Status Conditions are 256, 32, and 1. which mean -> machine is not measuring (1), LED calibration had errors in 1 or more (but not all) channels (32), and less than 5 tape advances are left (256) - Status = 145, which breaks down as follows: 145 – 128 = 17; 17 – 16 = 1; therefore, the Status Conditions are 128, 17, and 1. which mean -> machine is not measuring (1), LED calibration is in process (16), and less than 10 tape advances are left (128) 4.3 Downloading and Viewing Data To download data, insert the USB stick in either of the front USB ports. Do not use the rear ports as they are intended for the mouse and keyboard only and not for data transfer (surge protection). Go to the “Data / Export” menu and press “Export to USB”. 07645B DCN6853 41 ® Model 633 Aethalometer Black Carbon Monitor User Manual Teledyne Advanced Pollution Instrumentation The data will be stored in a text file with a header. The file name is: AE33_Sss- nnnnn_yyyymmdd.dat where ss is the production series number, nnnnn is the serial number, and yyyymmdd is the date, for example 20120901 means 1 Sept 2012. Please make sure that the transfer is finished before removing the USB stick from the USB port on the Aethalometer. You can now transfer the data file to a personal computer as any other file, making note, where you saved it, and open it in your favorite data processing application. 42 07645B DCN6853 Teledyne Advanced Pollution Instrumentation ® Model 633 Aethalometer Black Carbon Monitor User Manual Data file structure and description of the fields Header: Date(yyyy/MM/dd); Time(hh:mm:ss); Timebase; RefCh1; Sen1Ch1; Sen2Ch1; RefCh2; Sen1Ch2; Sen2Ch2; RefCh3; Sen1Ch3; Sen2Ch3; RefCh4; Sen1Ch4; Sen2Ch4; RefCh5; Sen1Ch5; Sen2Ch5; RefCh6; Sen1Ch6; Sen2Ch6; RefCh7; Sen1Ch7; Sen2Ch7; Flow1; Flow2; FlowC; Pressure(Pa); Temperature(°C); BB(%); ContTemp; SupplyTemp; Status; ContStatus; DetectStatus; LedStatus; ValveStatus; LedTemp; BC11; BC12; BC1; BC21; BC22; BC2; BC31; BC32; BC3; BC41; BC42; BC4; BC51; BC52; BC5; BC61; BC62; BC6; BC71; BC72; BC7; K1; K2; K3; K4; K5; K6; K7; TapeAdvCount; ID_com1; ID_com2; ID_com3; fields_i Data line: 2012/09/21 00:34:00 60 890416 524323 709193 823296 573862 756304 884844 619592 789142 822391 673266 816066 792706 686925 828401 738101 718325 841075 789053 722690 833686 3325 1674 4999 101325 21.11 15 30 40 0 0 10 10 00000 0 1150 1290 1242 1166 1248 1215 1150 1231 1190 1146 1196 1175 1214 1195 1234 1144 1114 1139 1180 1225 1174 0.00133 0.00095 0.00092 0.00080 0.00057 -0.00024 -0.00025 12 0 2 0 21.1 07645B DCN6853 43 ® Model 633 Aethalometer Black Carbon Monitor User Manual Teledyne Advanced Pollution Instrumentation Data field description: - Date(yyyy/MM/dd): date. - Time(hh:mm:ss): time. - Timebase: timebase – units in seconds. - Ref1, Sen1Ch1, Sen2Ch1…: are the raw signal Reference (Ref), Sense 1 ( Sen1) and Sense 2 ( Sen2) values form which the BC concentrations are calculated for channel 1 (Ch1), that is wavelength 370 nm. BC11 is the uncompensated BC calculated from the spot 1 for channel 1. BC1 is the final results the BC calculated form measurements for channel 1 (370 nm). - Flow1; Flow2; FlowC: Measured flow in ml/min. Flow 1 is flow through the spot 1, Flow_C is common (total flow) through the optical chamber, Flow_2 is the difference between these two. - Pressure (Pa); Temperature (°C); RH (%): These are the pressure and temperature which the instrument uses to report flow. By choosing to report mass flow, (101325 Pa, 21.11 C) are used to convert the measured mass flow to reported volumetric flow at these conditions (these are values used by the flow meter in the AE33). These values can be substituted for any other (pressure, Temp) values, should you want the flow to be reported at 0 C, or 25 C for example. Optionally, you can choose volumetric flow at ambient conditions to be reported. To do that you need an optional weather station accessory for the (pressure, Temp) measurement. We offer this separately (PN DU00000200). This external device is connected to the COM ports, please see below. If the weather station is connected, the measured values will be appended at the end of the data file as described below, and inserted into these columns. - %BB – An internal algorithm interprets the 7-wavelength absorption data and outputs a measurement of % wood smoke (or % biomass burning). This value is semi-quantitative and based upon work by Sandradewi et al. (2008). - SupplyTemp: power supply board temperature - Status; ContStatus; DetectStatus; LedStatus; ValveStatus; LedTemp: status codes for the instrument, reported in the , please see manual, chapter 5.2. and the subcomponents: controller, detector LED board; valve status (each valve can be on or off); LED board temperature 44 07645B DCN6853 Teledyne Advanced Pollution Instrumentation ® Model 633 Aethalometer Black Carbon Monitor User Manual - BC11; BC12; BC1; BC21; BC22; BC2; BC31; BC32; BC3; BC41; BC42; BC4; BC51; BC52; BC5; BC61; BC62; BC6; BC71; BC72; BC7: BC11 is the uncompensated BC calculated from the spot 1 for channel 1. BC1 is the final results the BC calculated form measurements for channel 1 (370 nm). - K1; K2; K3; K4; K5; K6; K7: K_i are the compensation parameters for wavelengths i=1…7 - TapeAdvCount: TapeAdvCount – tape advances since start - ID_com1; ID_com2; ID_com3; fields_i: ID_comi are the identifiers telling the Aethalometer which auxiliary device is connected to which serial port (necessary because of the different data structure). This is a 3 byte field: 0 2 0 21.1 means that the “Comet temperature probe” (instrument code 2) is connected to COM2. The temperature is 21.1 C. (This is not true for the temperature and pressure measurements to calculate volumetric flow using AMES_TPR159 sensor!) If we connected additionally another aux instrument to COM1 the dataline would be (ID_comi: 5 2 0): Date(yyyy/MM/dd); Time(hh:mm:ss); Timebase; RefCh1; Sen1Ch1; Sen2Ch1; RefCh2; Sen1Ch2; Sen2Ch2; RefCh3; Sen1Ch3; Sen2Ch3; RefCh4; Sen1Ch4; Sen2Ch4; RefCh5; Sen1Ch5; Sen2Ch5; RefCh6; Sen1Ch6; Sen2Ch6; RefCh7; Sen1Ch7; Sen2Ch7; Flow1; Flow2; FlowC; Pressure (Pa); Temperature (°C); RH (%); ContTemp; SupplyTemp; Status; ContStatus; DetectStatus; LedStatus; ValveStatus; LedTemp; BC11; BC12; BC1; BC21; BC22; BC2; BC31; BC32; BC3; BC41; BC42; BC4; BC51; BC52; BC5; BC61; BC62; BC6; BC71; BC72; BC7; K1; K2; K3; K4; K5; K6; K7; TapeAdvCount; ID_com1; ID_com2; ID_com3; fields_i 2012/09/21 00:34:00 60 890416 524323 709193 823296 573862 756304 884844 619592 789142 822391 673266 816066 792706 686925 828401 738101 718325 841075 789053 722690 833686 3325 1674 4999 101325 21.11 -1 30 40 0 0 10 10 00000 0 1150 1290 1242 1166 1248 1215 1150 1231 1190 1146 1196 1175 1214 1195 1234 1144 1114 1139 1180 1225 1174 0.00133 0.00095 0.00092 0.00080 0.00057 -0.00024 -0.00025 12 5 2 0 1090 45 20.0 21.1 where the aux instrument with the code 5 is a weather station reporting pressure (1090 mbar), RH (45%) and temperature (20.0). the temperature 21.1 is reported by the “Comet temperature probe” installed at a different location. 07645B DCN6853 45 ® Model 633 Aethalometer Black Carbon Monitor User Manual Teledyne Advanced Pollution Instrumentation System Restore This function allows for restoring the instrument to one of the older setup files. When you click the “Sys. restore” button the list of all backed up setup files is shown. You can select the setup file by the data and time, when it was replaced by a new one. Data Import Data can be imported from the thumb drive to the instrument. The data has to be stored in the folder with the instrument serial number (for example AE33-S02-000134). The filenames and format should not be changed. Data import function imports the following files: setup file (the one from the thumb drive becomes the instrument setup file. Current instrument setup file is backed-up) backup setup files - are copied to the backup folder (existing files are overwritten) data files: are copied to the data folder (existing files are overwritten). The running-date data file is merged with the existing one on the instrument. ND test files are copied to the NDtest folder (existing files are overwritten) flow verification files are copied to the Flow folder (existing files are overwritten) log file is merged to the existing one 4.4 Connecting to External Datalogger or PC Connect with a crossover cable (or standard serial cable with null modem adapter) from the PC / Datalogger to the serial port of the instrument on the rear panel. Establish communications using the following values: .BaudRate = 115200 .DataBits = 8 .StopBits = IO.Ports.StopBits.One .Parity = IO.Ports.Parity.None .Handshake = IO.Ports.Handshake.None .DtrEnable = True .RtsEnable = True 46 07645B DCN6853 ® Teledyne Advanced Pollution Instrumentation Model 633 Aethalometer Black Carbon Monitor User Manual 4.5 Serial Commands for Communication with the Aethalometer IMPORTANT NOTE: All commands finish with a Carriage Return [CR]. $AE33:Dnnn nnn number of lines Request nnn last of data requested measurements $AE33:TyyyyMMddHHmmss yyyy year Synchronize time with MM month the data-logger dd day HH hour (24) mm min ss second Command: $AE33:D1[CR] will return one data line (i.e. 1 byte -> value = 13 so altogether there should be 9 bytes). Please note these are all capital letters. IMPORTANT: The command must be sent as a string, not as separate characters. When using Hyper Terminal, send a text file with the command included: 1. When connecting with Hyper Terminal, set Handshaking to NONE. 2. In the Hyper Terminal Transfer drop-down menu, select SEND TXT FILE. 3. In the SEND TXT FILE screen, insert the text file and send. Note: Hyper Terminal may experience problems when sending the string more than two consecutive identical numbers (111, for example). We recommend using FREE software Real Term which has extended functionality regarding send options. Example 1: $AE33:D120[CR] => 11 bytes; Output will be 120 lines of data. Example 2: $AE33:T20120110120000[CR] will synchronize the time on the Aethalometer to 10 Jan 2012, noon. 07645B DCN6853 47 ® Model 633 Aethalometer Black Carbon Monitor User Manual Teledyne Advanced Pollution Instrumentation 4.6 External Devices Several external devices are supported for data-logging using the Aethalometer. Before use the connection with the selected device should be enabled using “External device” button on the Operation/Advanced tab. Select the device connected to the certain COM port and click “Connect”. Aethalometer will try to connect to the device every few seconds. When connected the status will go green. Supported devices: - AMES_TPR159 – dedicated ambient temperature + pressure + relative humidity sensor used for flow reporting at ambient conditions - Comet_T0310 – temperature sensor - Vaisala_GMP343 – CO2 sensor - TSI_4100 – mass flowmeter - Remote_Access – the selected port is waiting for communication with the data-logger 48 07645B DCN6853 Teledyne Advanced Pollution Instrumentation ® Model 633 Aethalometer Black Carbon Monitor User Manual 4.7 Software upgrade 1. Take a high quality USB key (Kingston, for example) and copy the selected files in the root directory: - NK.bin - application software, - ae33co502.hex, ae33de502.hex, ae33le502.hex, the three hex files (firmware). 2. Switch on the AE33 and stop measurement. 3. Insert the USB key into the front USB slot. Wait 10 seconds. 4. Go to "Operation/Advanced" menu and press the "Update" button. 5. Choose "Software" upgrade. 6. Wait until the Aethalometer finishes the upgrade. 7. Take the USB key out of the Aethalometer. 8. Restart the Aethalometer. 9. Switch on the AE33 and stop measurement. 10. Insert the USB key into the front USB slot. Wait 10 seconds. 11. Go to "Operation/Advanced" menu and press the "Update" button. 12. Choose "Firmware" upgrade. 13. Wait until the Aethalometer finishes the upgrade. This can take up to 10 min! 14. Take the USB key out of the Aethalometer. 15. Restart the Aethalometer. 16. Instrument will install the update during startup; it will automatically restart again. 17. Check the “Advanced” menu for the software application and firmware versions. 4.8 BC source apportionment As described in Section 1.1.2, source apportionment of black carbon emissions in the Model 633 is based on the Sandradewi et al. (2008) model, with optical absorption coefficient being a sum of biomass burning and fossil fuel burning fractions. The model is based on the difference in absorption coefficient wavelength dependency assuming that absorption due to from fossil fuel and biomass emissions follow λ-1 and λ-2 spectral dependencies, respectively (Sandradewi 2008). The exponents which describe the spectral dependence are called Ångström exponents: α ff=1 for fossil fuel and αbb=2 biomass. 07645B DCN6853 49 ® Model 633 Aethalometer Black Carbon Monitor User Manual Teledyne Advanced Pollution Instrumentation Settings BC Source apportionment is switched on by selecting Home display/procBB setting on Operation/Advanced tab. Fine tune the algorithm by changing the value of Ångström exponents αff and αbb, from the default values of αff=1 and αbb=2. The calculated values are limited to the 0-100% range Presentation BC and portion of biomass burning (%) are displayed on the Home tab. The percentage of BC created by biomass burning is stored in the field BB (%). 4.9 Screen saver Screen saver settings (Operation/Advanced screen): ON: Screen is always switched on Saver: After 60 minutes without user interaction the screen saver is started – Instrument status flag (Green = measurement, Yellow = warning status, Red = not measuring) is displayed. Auto OFF: After 60 minutes without user interaction screen is switched off. Instrument operation is shown by LEDs on the right side of the screen. Screen saver is switched off by touching the screen. 50 07645B DCN6853 5 MAINTENANCE and SERVICE The Aethalometer needs to be maintained regularly. We recommend the following schedule for regular maintenance. Item Frequency Sample inlet flow Monthly Inspect the sample line tubing Monthly Inspect and clean the size selective inlet (if present) Monthly Clean cyclone (Section 5.1 Cleaning the cyclone) Weekly at first to gauge debris accumulation, then adjust as needed. Verify time and date Monthly (Time & Date in OPERATION>GENERAL page). IMPORTANT NOTE: The instrument date/time is set by default to automatically update according to Central European Daylight Savings Time. The update is done at the first instrument power cycle following the time change. Instrument power cycles are indicated in viewing the log files. Inspect optical chamber, clean if necessary Semi-annually (Section 5.6 Cleaning the optical head) Site dependent, use educated judgment! Check flow, calibrate if necessary Semi-annually or as needed. (Section 5.2 Leak test). (For calibration: Section 5.3 Automatic flow meter calibration or Section 5.4 Manual flow meter calibration). Change by-pass cartridge filter (Section 5.7 Changing the bypass cartridge filter) Install a new filter tape roll (Section 3.4 Filter tape installation) Calibrate tape sensor (Section 5.8 Calibrating the tape sensor) 07645B DCN6853 Annually or as needed. As needed. The instrument issues a warning. When measurement chamber has been removed/replaced. 51 ® Model 633 Aethalometer Black Carbon Monitor User Manual Teledyne Advanced Pollution Instrumentation 5.1 Cleaning the cyclone Remove the cyclone and disassemble (shown in the following instructions), cleaning the various parts thoroughly. The recommended cleaning method is immersion in an ultrasonic cleaner with water and mild soap. However, wiping with a water-dampened and lint-free cloth is sufficient. IMPORTANT: Protracted soaking in soap/caustic solutions will damage the aluminum components. Do not re-aerosolize hazardous materials when using compressed air for cleaning. Cyclone cleaning procedure: 1. Remove cyclone assembly from instrument. 2. Remove inlet cover. 52 07645B DCN6853 Teledyne Advanced Pollution Instrumentation ® Model 633 Aethalometer Black Carbon Monitor User Manual 3. Loosen the three set screws that hold the inlet body in place. 4. Remove inlet body. 5. Remove dust cup. 6. Illustration shows inlet cover, inlet body and dust cup removed. 07645B DCN6853 53 ® Model 633 Aethalometer Black Carbon Monitor User Manual Teledyne Advanced Pollution Instrumentation 7. Remove allen cap screws from cyclone top. 8. Clean all parts and thoroughly dry; then reassemble in reverse order. 5.2 Leak test Always conduct a leak test prior to running a flow meter calibration, whether automatic (section 5.2) or manual (section 5.3). Leakage (ζ) is measured during instrument operation. It is calculated from the flow in (Fin) and flow out (Fout). ζ=1-(Fin/Fout) Average leakage is 7% at 5 LPM. It can differ slightly from spot to spot and during the spot loading. 54 07645B DCN6853 Teledyne Advanced Pollution Instrumentation ® Model 633 Aethalometer Black Carbon Monitor User Manual Flow measurement using a mass-flow meter (for example TSI4100) 1. Connect the flow meter to the input of the instrument. 2. Wait for a few seconds for the flow to stabilize and read the flow Fin. 3. Disconnect flowmeter from the input. 4. Connect the flow meter to the output of the instrument by a long tube (10 m) to reduce the oscillations, which can influence the flow measurements. 5. Take a Fout reading. IMPORTANT! If you use a volumetric flow meter take into account the difference in air pressure and temperature between the flow in and flow out (use the ideal gas law equation). Report Aethalometer Flowmeter Date Fin (LPM) Fout (LPM) ζ (%) TSI4100 4.67 5.01 6.8 SN AE33-S00-0054 15.1.2013 5.3 Automatic flow meter calibration First, ensure that a leak test is completed (Section 5.1) prior to running this calibration procedure. For the automatic calibration a TSI4100 flow meter, data cable and the flow calibration pad are needed. Before calibration check TSI4100 flow meter settings: 07645B DCN6853 55 ® Model 633 Aethalometer Black Carbon Monitor User Manual Teledyne Advanced Pollution Instrumentation Automatic flow calibration procedure 1. Stop measurements in the OPERATION >GENERAL menu (press Stop button). 2. In the OPERATION>ADVANCED menu press FLOWCAL. 3. Press AUTO to start auto Flow meter calibration. 56 07645B DCN6853 Teledyne Advanced Pollution Instrumentation ® Model 633 Aethalometer Black Carbon Monitor User Manual Automatic flow calibration procedure 4. Wait for the measurement chamber to move to the up position. 5. Once chamber is lifted, remove tape and insert the flow calibration pad. 6. Press OK when finished. You will be prompted to wait for chamber to move back to home position, and then to make flowmeter and cable connections 07645B DCN6853 57 ® Model 633 Aethalometer Black Carbon Monitor User Manual Teledyne Advanced Pollution Instrumentation Automatic flow calibration procedure 7. Connect the flow meter to the inlet of the Aethalometer, note the orientation! Connect the data cable to the serial connector on the back of the Aethalometer, then press OK. 8. Once you’ve pressed OK to start the flow calibration, wait for it to finish, and press OK when prompted. The display continues with prompts for completing the procedure, i.e., wait for chamber to lift, remove flow pad, return tape, wait for chamber to return to home position, etc., until the entire procedure is complete. 58 07645B DCN6853 Teledyne Advanced Pollution Instrumentation ® Model 633 Aethalometer Black Carbon Monitor User Manual Automatic flow calibration procedure After completion of automatic (or manual) flow calibration and the instrument is returned to operation mode, note that the intake flow reported from a flow meter does not match the reported flow on the front panel of the 633. This is normal due to leakage around the filter tape as discussed in Section 5.2. The difference in flow may be from 4 – 7% and the 633 compensates for this difference during the BC calculation. 5.4 Manual flow meter calibration First, ensure that a leak test is completed (Section 5.1) prior to running this calibration procedure. For the manual calibration a flow meter, data cable and the flow calibration pad are needed. Please note flow measurements are in Milliliters, and maximum flow rate should be no greater than 5 LPM (5,000 milliliters). Manual flow calibration procedure 1. STOP measurements in the OPERATION>GENERAL menu. 07645B DCN6853 59 ® Model 633 Aethalometer Black Carbon Monitor User Manual Teledyne Advanced Pollution Instrumentation Manual flow calibration procedure 2. In the OPERATION>ADVANCED menu press FLOWCAL. 3. Select MANUAL to start the manual flow calibration. 4. Wait for the measurement chamber to move to the up position. 60 07645B DCN6853 Teledyne Advanced Pollution Instrumentation ® Model 633 Aethalometer Black Carbon Monitor User Manual Manual flow calibration procedure 5. Remove tape and insert the flow calibration pad (note the orientation of the flow pad is critical), and press OK and wait for the chamber to return to home position. 6. Connect the flow meter to the inlet of the Aethalometer (note the orientation of the flow meter), then press OK. 07645B DCN6853 61 ® Model 633 Aethalometer Black Carbon Monitor User Manual Teledyne Advanced Pollution Instrumentation Manual flow calibration procedure 7. Wait for the pump to run for several seconds to achieve a stable flow. 8. In the display’s blank FLOW field enter the flow value from your flow meter measured in or converted to milliliters (this will be approximately 900) tap screen in Flow field, used screen keyboard to enter numbers and click Enter. Also enter the EPA standard temp and pressure of 25 C and 1 atmosphere or 101325 Pa and select OK. 62 07645B DCN6853 Teledyne Advanced Pollution Instrumentation ® Model 633 Aethalometer Black Carbon Monitor User Manual Manual flow calibration procedure 9. Wait for the pump to run for several seconds to achieve a stable flow. 10. In the display’s blank FLOW field enter the flow value from your flow-meter measured in or converted to milliliters (this will be approximately 3000; do NOT change the pressure or temperature settings), and select OK. 11. Wait for the pump to run for several seconds to achieve a stable flow. 12. In the display’s blank FLOW field enter the flow value from your flow-meter measured in or converted to milliliters (this will be approximately 5000; do NOT change the pressure or temperature settings), and select OK. 07645B DCN6853 63 ® Model 633 Aethalometer Black Carbon Monitor User Manual Teledyne Advanced Pollution Instrumentation Manual flow calibration procedure 13. The screen displays a message, “Wait for calibration to finish”, and then displays notice when the calibration is finished and prompts user to wait for next steps. 14. Remove the flow calibration pad, reinsert and tighten tape, and press OK, and wait for the chamber to return to home position. After completion of manual (or automatic) flow calibration and the instrument is returned to operation mode, note that the intake flow reported from a flow meter does not match the reported flow on the front panel of the 633. This is normal due to leakage around the filter tape as discussed in Section 5.2. The difference in flow may be from 4 – 7% and the 633 compensates for this difference during the BC calculation. There will be some faults present on the unit after the flow calibration is complete. To remove the faults, power down the instrument with both the front and back power switches, and then re-start and allow it to cycle through the self-test. The manual flow calibration is now complete. To resume taking measurements, go to the OPERATION>GENERAL tab and press Start. 64 07645B DCN6853 Teledyne Advanced Pollution Instrumentation ® Model 633 Aethalometer Black Carbon Monitor User Manual 5.5 Manual stability test Stability test is conducted without flow to determine the performance of the light source – detector pair. In the Operation/General tab select the desired timebase and click “Stability” button to start the test. Stability test is marked by status 1024. During the test BC values will be calculated assuming there is 5 LPM air flow. Manually stop the test when the desired test duration is complete. Interpretation of the results: - Average BC values should be close to zero if the Aethalometer is warmed up (was measuring for a few hours just before conducting the test). - Point to point variation of BC (PPBC) is calculated as an average absolute difference between the consecutive BC measurements. It depends on the timebase, tested channel and spot. For example at 1 s timebase PPBC61 = approx. 400 ng/m3. 5.5 Manual clean air test Clean air test is conducted using the built-in filter to determine the performance of Aethalometer under the standard flow condition. In the Operation/General tab select the desired timebase and flow, then click “Clean air” button to start the test. Clean air test is marked by status 2048. Manually stop the test when the desired test duration is complete. Interpretation of the results: - Average BC values should be close to zero if the Aethalometer is warmed up (was measuring for a few hours just before conducting the test). It is possible to observe a short transient due to filter compression. - Point to point variation of BC (PPBC) is calculated as an average absolute difference between the consecutive BC measurements. It depends on the selected timebase, flow and tested channel. For example PPBC61 = approx. 500 ng/m3 at 5 LPM and 1 s timebase. 07645B DCN6853 65 ® Model 633 Aethalometer Black Carbon Monitor User Manual Teledyne Advanced Pollution Instrumentation 5.6 Cleaning the optical head Optical head cleaning procedure: 1. STOP measurements in the OPERATION>GENERAL menu. 2. Manually lift the chamber (pressing down the retention pin at top, front, center). 3. Locate the release button. 66 07645B DCN6853 Teledyne Advanced Pollution Instrumentation ® Model 633 Aethalometer Black Carbon Monitor User Manual Optical head cleaning procedure: 4. While pressing the release button upward, grasp optical head and turn to loosen and remove. 5. Use compressed air (AVOID spraying liquid) or to remove dust/debris from the optical head surfaces and platform. Optical head top. Optical head platform 07645B DCN6853 67 ® Model 633 Aethalometer Black Carbon Monitor User Manual Teledyne Advanced Pollution Instrumentation Optical head cleaning procedure: 6. Alternatively, use a cotton swab. Ensure to clean both top and bottom of optical head. Optical head bottom. 7. Return the optical head: first align the notched marker. 8. Insert and turn to secure in place. 68 07645B DCN6853 Teledyne Advanced Pollution Instrumentation ® Model 633 Aethalometer Black Carbon Monitor User Manual Optical head cleaning procedure: 5.7 Changing the bypass cartridge filter Bypass filter changing procedure: 1. Open instrument door to access bypass cartridge filter. 2. Hold down bottom fitting on one side while pulling up on cartridge fitting. 07645B DCN6853 69 ® Model 633 Aethalometer Black Carbon Monitor User Manual Teledyne Advanced Pollution Instrumentation Bypass filter changing procedure: 3. Repeat on other side. 4. Remove cartridge. 5. Gently wedge small, flat tool between fitting and cartridge. 6. Carefully pry fittings from both ends of cartridge, and dispose of used cartridge in accordance with local regulations. 70 07645B DCN6853 Teledyne Advanced Pollution Instrumentation ® Model 633 Aethalometer Black Carbon Monitor User Manual Bypass filter changing procedure: 8. Securely slide fittings onto ends of new cartridge. 9. Place new cartridge on chamber optical head, ensuring that the arrow printed on the filter points to right. 10. Changing the bypass cartridge filter is now complete. 07645B DCN6853 71 ® Model 633 Aethalometer Black Carbon Monitor User Manual Teledyne Advanced Pollution Instrumentation 5.8 Calibrating the tape sensor Tape sensor calibration is performed at the factory and should only be conducted when removing the Measurement chamber from/to the Aethalometer. This procedure requires special calibration cylinders: the small cylinder has diameter of 39 mm; the large cylinder has a diameter of 102 mm. (NOTE: It is essential to secure the calibration cylinders with the tape retention disks during calibration). Tape sensor calibration procedure: 1. In the Operation / General menu press Stop to stop measurements, then carefully remove the sampling tape. (Refer to Section 3.4 Filter tape installation). At this point, remove the tape as instructed in the Change Tape Procedure, then continue as follows: 2. In the Operation / Advanced menu press “TapeSenAdj” 72 07645B DCN6853 Teledyne Advanced Pollution Instrumentation ® Model 633 Aethalometer Black Carbon Monitor User Manual Tape sensor calibration procedure: 3. The Tape Sensors Adjustment screen prompts to place the small tapeholder [cylinder] on left and large on right, then press OK. Secure with tape retention disks (not shown in illustration) before pressing OK! 4. The next prompt is to switch the tapeholders [cylinder], then press OK. Secure with tape retention disks (not shown in illustration) before pressing OK! 5. Last screen shows that the adjustment is complete. 6. After you’ve pressed either OK or Cancel, return the sampling tape per the applicable steps in Section 3.4 Filter tape installation). 07645B DCN6853 73 ® Model 633 Aethalometer Black Carbon Monitor User Manual Teledyne Advanced Pollution Instrumentation 5.9 Flow verification Flow verification is used to check whether internal flow-meters need calibration. No instrument settings are changed during this procedure; it does require that the tape be removed and a filter pad inserted as in Flow Calibration in Section 5. Equipment required flow calibration pad (notch should be oriented to front of instrument when inserted) external flow meter o the Auto procedure specifically requires the TSI 4100 Series with serial connection o the Manual procedure allows any flow meter and does not use communications Flow verification start 1 2 1. In the Operation>General screen, select the “Stop” button. 2. On the same screen, select “the “Verify flow” button. 3. In the FLOW VERIFICATION PROCEDURE screen, select either Auto (see Auto flow verification section next) or Manual (see Manual flow verification section below). Auto flow verification Tap the Auto button and follow each prompt as displayed on the screen. As in the Automatic flow calibration procedure in Section 5, the chamber moves to the up position, waits for an “OK” after the tape is removed and the flow calibration pad is inserted, and returns to the home position. The screen then prompts for the “TS4100 flowmeter” and serial cable connections, begins the verification procedure once the “OK” button is selected, and last, displays a report comparing its own readings to the flow meter readings (see Results section below). 74 07645B DCN6853 Teledyne Advanced Pollution Instrumentation ® Model 633 Aethalometer Black Carbon Monitor User Manual Manual flow verification Tap the Manual button and follow each prompt as displayed on the screen. As in the Manual flow calibration procedure in section 5, the chamber moves to the up position, waits for an “OK” after the tape is removed and the flow calibration pad is inserted, and returns to the home position. The screen then prompts for an “external flowmeter” connection and prompts for flow values. Wait for the external flow meter to reach stability (the reading may bounce within a range; use the midpoint as the flow). 1. Tap the screen in the Flow field. 2. Tap the screen keypad to enter the flow value displayed on the external meter; then tap the Enter button on that screen. The screen returns to the previous display, now showing the value entered. 3. Tap the OK button. The prompt to enter flow values will be repeated once. When the flow verification is complete, a report is displayed on the screen (see Results section below). Results When the procedure is finished, the screen displays a table with measured flows, reported at the flow reporting standard selected for the instrument. If measured flows differ for more than 10 % you need to recalibrate the flow (Section 5.4). 5.10 Neutral Density (ND) filter test The ND filter test is an optical test to monitor changes of the optical system’s sensitivity. This test measures optical attenuation of 4 different neutral density filters. The slope of the linear fit between measured attenuations versus default attenuation is a measure of sensitivity: if the slope differs more than 10% from unity, the test fails. Equipment required ND filter set, serial-numbered AE-33-ND-xxxx, which includes: four custom filters, numbered 0 through 3 one USB flash drive with a calibration file (CF) for the filter set 07645B DCN6853 75 ® Model 633 Aethalometer Black Carbon Monitor User Manual Teledyne Advanced Pollution Instrumentation ND filter test start 1 2 1. In the Operation>General screen, tap the “Stop” button. 2. Tap the “ND test” button. 3. In the next screen, tap the field labeled “Filterset serial number” (the serial number is located on the filter set box front); this brings up the next screen showing a keypad. 4. Tap the numbers corresponding to the last four digits of the filter set serial number; then tap Enter. The instrument searches its calibration file (CF) card for the filter set’s unique CF. If the CF is not already copied onto the instrument’s CF card (i.e., this is the first time using the filter set), the OPTICAL TEST screen prompts for the USB flash drive from which to copy, before it moves to the next screen. Insert the flash drive into the USB port on the front of the instrument, and follow the instructions on screen. If the CF is found on the instrument’s CF card (i.e., this filter test is subsequent to the initial ND filter test), the testing process will move forward. 5. Follow the prompts to insert each filter (IMPORTANT NOTE: the filter tape must remain in place when the ND filter is inserted), ensuring the notch in the filter is oriented toward the front of the instrument. For each filter, the instrument advances the tape and runs the optical test. Results At the end of the test, the results are displayed on the screen. Measurement results and slopes are also reported in the Aethalometer log file. If the test results fail, check the ND filter for dirt or damage, carefully clean and retry the test. If passing results cannot be obtained, contact Teledyne API Technical Support. 76 07645B DCN6853 6 TECHNICAL SUPPORT and CONTACT INFORMATION If this manual and its troubleshooting & service section do not solve your problems, technical assistance may be obtained from: Teledyne API, Technical Support 9480 Carroll Park Drive San Diego, California 92121-5201USA Toll-free Phone: 800-324-5190 Phone: 858-657-9800 Fax: 858-657-9816 Email: Website: 07645B DCN6853 [email protected] http://www.teledyne-api.com/ 77 ® Model 633 Aethalometer Black Carbon Monitor User Manual Teledyne Advanced Pollution Instrumentation This page intentionally left blank. 78 07645B DCN6853 7 SPARE PARTS LIST Following is a list of spare parts available for order through the Sales Department: DU0000146 Filter Tape for 633 DU0000196 Flow calibration pad TU0000034 Static dissipative inlet tubing (8-ft) DU0000148 PM2.5 inlet at 5-lpm KIT0000400 Inlet mounting kit WR0000008 Power Cord WR0000101 RS-232 Cable (6-ft) WR0000258 RS-232 Null Modem adapter FT0000338 3/8”-1/4” NPTF Reducer 07645B DCN6853 79