1
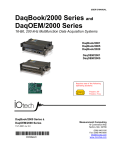
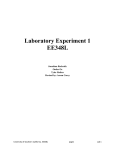
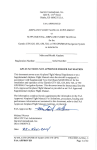
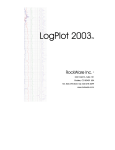
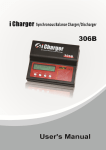
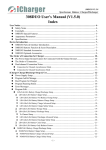
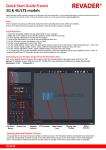
PostView
User's Guide..
Post Data Acquisition Analysis Application
PostView
Post Data Acquisition
Analysis Application
p/n
PostView User’s Guide
457-0916 Rev. 1.0
907293
1
Measurement Computing
10 Commerce Way
Norton, MA 02766
(508) 946-5100
Fax: (508) 946-9500
[email protected]
www.mccdaq.com
2
908893
PostView User’s Guide
PostView
Overview …… 1
System Requirements …… 4
Installation ……4
Layout and Controls …… 5
Understanding the Status Bar …… 8
Changing Display Parameters …… 9
Overview
PostView is a time-domain post-acquisition data viewing application that can be integrated with primary data
acquisition software, including DaqView, Personal DaqView, ChartView, LogView, and WaveView. The viewer
provides a means of setting up several display pages, each with one or more scopes and single or multiple channels
to view as Analog, Counts, or Logic traces (with one type per scope). You can set up PostView to run from your
data acquisition program’s ViewData button. Configuration instructions follow shortly.
Note that you cannot mix channel types within a scope. Attempting to do so will result in a message stating, for
example, Only Analog Channels can be added to an Analog Scope.
The PostView Concept
(1) Data acquisition device, such as a WaveBook, LogBook, DaqBook, or ChartScan unit.
(2) PC with data acquisition software, e.g., WaveView, LogView, DaqView, ChartView
PostView can set to start from their ViewData button.
(3) A disk of data files (raw binary)… or, simply data files stored in the PC.
(4) A PC with PostView installed. PostView can be used to view acquisition
data from files on the PC’s hard drive or from a disk.
The PostView application provides easy-to-use post-acquisition analysis capability. Depending on the version used,
you can display up to 8 time-domain function windows and display up to 16 channel traces per window. Data is
automatically scaled to optimize its fit in the window. Features of the program include:
•
•
•
•
•
•
PostView User’s Guide
File Input Format Support for: DaqView, WaveView, Personal DaqView, ChartView, DaqCOM2
Up to 8 Display Windows
16 Channel Traces per Display Window
Automatic Data Scaling
Configurable Data Display for channels and trace colors
Multiple Tiling of display windows
907293
3
System Requirements
Your computer should meet the following minimum requirements.
Intel™, Pentium 90 MHz or equivalent
64 MB Memory
100 MB Hard Disk space
Monitor: SVGA, 800 x 600 resolution
Microsoft® Windows® XP
If you purchased software, associated authorization codes will accompany your
installation CD. If this is the case, keep your codes in a safe place. You will need to enter
them once, during an actual run of the purchased software.
No authorization code or password is needed to run PostView at its base level.
Installation
Before installing a version of our data-acquisition software, remove all
previous versions of that software.
Reference Notes:
• Adobe Acrobat PDF versions of documents pertaining to your system hardware and
software are automatically installed onto your PC’s hard-drive as a part of product
support at the time of software installation. The default location is the Programs
group, which can be accessed via the Windows Desktop Start Menu.
•
PDF versions of documents can be read directly from the data acquisition CD.
•
After your software is installed you can setup your data acquisition device, e.g.,
WaveBook, DaqBook, LogBook, and connect it to the host computer. Instructions
for hardware setup are included in your device user’s manual, which is included on
the CD.
When you first install software for your acquisition device, PostView will automatically be selected for installation
along with the primary acquisition software application. For example, when a WaveBook is selected, both
WaveView and PostView will show as pre-selected software options.
To install PostView …
1.
2.
3.
4.
5.
6.
7.
4
Start Windows.
Close all running applications.
Insert the Data Acquisition CD into your CD-ROM drive and wait for the CD to auto-run.
If the CD does not start on its own:
(a)
click the desktop’s <Start> button
(b)
choose the Run command
(c)
select the CD-ROM drive, then select the setup.exe file
(d)
click <OK>
An Opening Screen will appear.
Click the <ENTER SETUP> button.
On the hardware selection screen [which follows a licensing agreement], select your hardware from
the drop-down list.
On the resulting software options screen, select the software that is applicable to your system.
Note that PostView is already selected by default.
Click the <Install> button; then follow the screen prompts to complete the installation.
908893
PostView User’s Guide
Layout and Controls
Window Layout
PostView’s main window includes File and Edit pull-down menus, a scan list, display page panel, scroll bar, and a
status bar. You can drag channels from the scan list to the display page, or “right-click” on a channel in the scan list
and use a “move to” function. The following sections will clarify the layout and the functionality of PostView.
Primary Toolbar
The primary toolbar is comprised of buttons which impact all displays. A description of each of these buttons
follows. In addition, each display includes its own toolbar. This secondary toolbar will be discussed shortly.
Primary Toolbar
Secondary (Display) Toolbar
(A)
Move Channels
(Drag over)
(B) Move Channels
(right-click)
Note: (A) Drag Channels from the Scan List to the Display Page, or
(B) right-click on a channel and use the “move to” feature.
PostView User’s Guide
907293
5
Primary Toolbar
Item #
Item
Description
1
Gridlines On/Off
Switches grid lines from On to Off or visa versa.
2
Cursors
The Cursor button switches the cursor(s) from On to Off or visa-versa. Clicking the
adjacent down-arrow displays a pull-down list of the following cursor options:
Cursors On/Off - Switches the cursor(s) from On to Off or visa-versa.
Delta On/Off -Turns the Delta annotation function ON or OFF when in Dual Cursor
Mode.
Single Cursor - Implements Single Cursor Mode.
Dual Cursor - Implements Dual Cursor mode.
3
Add Scope Display
Clicking the button adds an Analog Scope in Raw Time mode.
Clicking the adjacent down-arrow displays a pull-down list of 3
display options [Analog, Counts, and Logic].
Moving the cursor over “Analog” displays the analog options of
Raw Time and Averaged Time.
4
Delete Scope Display
Clicking the button deletes the selected display. If no display is selected, then
the last display to have been added [to that display page] will be deleted.
Clicking the adjacent down-arrow lists all displays for the current display page
(see figure). Clicking on one of the listed displays will delete it.
5
6
Add Display Page
Adds a blank page and labels it via an associated tab, e.g., Display Page 2,
Display Page 3, etc.
908893
PostView User’s Guide
Secondary (Display) Toolbars
Each Scope Display has its own toolbar, which is illustrated in the previous and following figures.
Secondary (Display) Toolbar Items
Item #
Item
Description
1
Select
Used to select and reposition cursors.
2
Zoom-Box
The Zoom-Box function allows you to draw a box around an area that you desire to zoom-in
on. This results in new x and y coordinates for the scope display.
3
Zoom-In
Each click of the plus-magnifier image results in a zoom-in.
4
Zoom-Out
Each click of the minus-magnifier image results in a zoom-out.
5
Zoom-In on Cursor
Zooms in to the area around the cursor.
6
Auto-Scale X-Axis
Automatically adjusts the X-axis.
7
Auto-Scale Y-Axis
Automatically adjusts the Y-axis.
8
Axis Scroll
Allows simultaneous scrolling of both axes.
9
Axes Zoom
After clicking “Axes Zoom” you can click in one of three areas of a scope display to zoom in
or out on the: y-axis, x-axis, or both (when you click within the display region, instead of x or
y specifically).
x-axis: click and drag “right” to zoom-out; “left” to zoom-in.
y-axis: click and drag “up” to zoom-out; “down” to zoom-in.
x-axis and y-axis simultaneously: right and/or up to zoom-out; left and/or down to zoom-in.
When pushed-in, the lock axes function overrides auto and manual scaling. This keeps the
current X and Y-axis locked-in-place when new acquisitions begin.
When Lock Axes is inactive, auto and manual-scaling function normally.
10
Lock Axes
11
Print Preview
Opens a Print Preview window which allows you to view and print the display.
12
Print
Prints the display.
13
Save Plot as
A Windows-type save feature in regard to where to save, naming the file, and selecting the
file type (.bmp, .gif., .jpg. .dat, etc.)
14
Edit Display
Accesses the Options Dialog Box for changing display preferences. (See pgs. 4 and 5)
Pull-Down Menus
File Menu
New
Used to reset and close all displays.
Open File …
Used to locate and open saved files for View applications, e.g., WaveView, DaqView, Personal DaqView,
LogView, ChartView, and DaqCOM2.
File extensions are as follows:
.IO$ ChartView
.DC2 DaqCOM2
.dsc
WaveView, DaqView, Personal DaqView, and LogView
Exit
This menu item closes the PostView application.
PostView User’s Guide
907293
7
Edit Menu
Display
Clicking “Display” brings up an Options dialog box for viewing or changing the display preferences.
This is discussed in the following section.
The Display Scroll Bar
A slide-type scroll bar resides just below the display. Use the slide to move through the data.
Understanding the Status Bar
A status bar at the bottom of the display page shows numerical data for any one selected channel of a
single display. Data such as Time and amplitude Value are in reference to cursor position on the display. If
two cursors are employed, data is in reference to the last cursor moved.
Note: Certain labels applicable to a display’s status bar will not be visible until after the first calculation is
made.
Status Bar – Example
Analog Scope
Time and Value for the
cursor last moved.
Delta Value (difference between the 2 cursor
)
Time and Value for the second cursor
Select the desired
channel from this
region.
Channel 4 is
currently selected.
The cursor last-moved indicates a
value of -0.1738 V at 0.110168
seconds for Channel 4.
Time: The time value (from the x-axis) for the position of the cursor last moved.
Value: The amplitude (from the y-axis) of the selected channel at the cursor position.
Avg.: The average value for all data points of the selected channel.
Min: The largest negative value reached by the selected channel.
Max: The highest value reached by the selected channel.
8
908893
PostView User’s Guide
Changing Display Parameters
To make a global change to the appearance of the scope displays, i.e., changes which affect every scope on
every display page, select “Display” from the Scope window’s Edit pull-down menu. An Options dialog
box will appear with the “Display Preferences” tab dominant (following figure). A second way to access
the Display Preferences tab is to click the <Edit Display> button for a scope (button15); then after the
Options Dialog Box opens, click on the Display Preferences tab.
Options, Display Preferences Tab
From the dialog box you can change the colors of channel traces, grid lines, and the display background
color. You can also:
o
Change line styles: Solid, Dots, Dashes, Dash Dot, Dash Dot Dot
o
Display or discard partial acquisition data upon the acquisition’s stop
o
Change the cursor color
o
Select to automatically match the cursor color to the trace color
Remember that the changes made from the Display Preferences tab are global changes, i.e., they will be
applied to every display on every display page.
To change the parameters for a specific display, and leave the other displays as currently configured,
simply click on the tab associated with the display for which you want to change parameters.
PostView User’s Guide
907293
9
You can change the parameters of an individual display in regard to:
o
Graph Title
You can enter (or edit) a title for the display and select to show the title on the display via a
checkbox. The title color can be changed.
o
Scale factor (Auto-scale or Manual Scale)
When Manual Scale is used the values entered for minimum and maximum apply. These are the
minimum and maximum Y-axis values. The units are the displayed channels’ engineering units.
o
Limits
These limits are for display purpose only. They have no relation to acquisition
limits which are used as triggers.
You can set an upper and/or lower limit for display and change the color of these display limits.
If you select to use a limit [by checking the associated box] then traces that exceed the limit value
will become noticeably thicker.
You can display the upper and lower limit lines, regardless of whether or not you decide to use the
trace-thickening feature, and visa versa.
o
Data Processing
A Data Processing Panel with a single tab labeled “General” is located at the lower section of
the dialog box. The panel allows you to select the Axis Scale Type (linear or log) and also allows
you to select Scans per block. This last setting designates how many data points will be
displayed in a single viewing instance. For example, if “20” was entered, you would see 20 data
points on the screen; and each time you used the scroll bar you would see 20 points of data
displayed.
Options Dialog Box
10
908893
PostView User’s Guide