1
KNIME Essentials
Gábor Bakos
Chapter No. 3
"Data Exploration"
In this package, you will find:
A Biography of the author of the book
A preview chapter from the book, Chapter NO.3 "Data Exploration"
A synopsis of the book’s content
Information on where to buy this book
About the Author
Gábor Bakos is a programmer and a mathematician, having a few years of experience
with KNIME and KNIME node development (HiTS nodes and RapidMiner integration
for KNIME).
In Trinity College, Dublin, the author was helping a research group with his data
analysis skills (also had the opportunity to improve those), and with the new
KNIME node development. When he worked for the evopro Kft. or the Scriptum
Informatika Zrt, he was also working on various data analysis software
products. He currently works for his own company, Mind Eratosthenes Kft.
(
), where he develops the RapidMiner integration for
KNIME (
),
among other things.
The author would like to thank the reviewers and Packt Publishing for
their help in creating this book.
For More Information:
www.packtpub.com/knime-essentials/book
KNIME Essentials
Dear reader, welcome to an intuitive way of data analysis. Using a visual programming
language based on dataflows, you can create an easy-to-understand analysis process,
while it internally checks signals about some of the common problems. Obviously, any
environment that does not help with proper documentation would be destined to fail, but
KNIME's success is based not just on its high quality—cross-platform—code, but also
on the good description about what it does and how you can use the building blocks.
This book covers the most common tasks that are required during the data preparation
and visualization phase of data analysis using KNIME. Because of the size constraints—
and to bring the best price/value for those who are already familiar with or not interested
in modeling—we have not covered the modelling and machine learning algorithms
available for KNIME. If you are already familiar with these algorithms, you will easily
get familiar with the options in KNIME, and these are quite obvious to use, so you lose
almost nothing. If you have not found time yet to get acquainted with these concepts, we
encourage you to first learn for what these procedures are good and when you should use
them. There are some good books, courses, and training available—these are the ideal
options for learning—but the Wikipedia articles can also give you a basic introduction
specific to the algorithm you want to use.
What This Book Covers
Chapter 1, Installation and Using KNIME, introduces the user interface, the concepts
used in the first three chapters, and how you can install and configure KNIME and
its extensions.
Chapter 2, Data Preprocessing, covers the most common tasks, so that you can
analyze your data, such as loading, transforming, and generating data; it also
introduces the powerful regular expressions and some case studies.
Chapter 3, Data Exploration, describes how you can use KNIME to get an overview
about your data, how you can visualize them in different forms, or even create
publication quality figures.
Chapter 4, Reporting, introduces the KNIME reporting extension with the specific
concepts, the user interface, and the basic blocks of reports.
For More Information:
www.packtpub.com/knime-essentials/book
Data Exploration
In this chapter, we will go through the main functions of KNIME visualization
(except reporting) and other techniques to explore the data you have. This can
be helpful when you want to do the preprocessing too, but you can also check
the result of visualization or see how well they fit the computed models and the
test/validation data. The topics covered in this chapter are as follows:
•
Statistics
•
Distance matrix
•
Visual properties
•
KNIME views and HiLiting
•
JFreeChart nodes
•
Some third party visualization options
•
Tips with HiLiting
•
Visualizing models
Computing statistics
When you want to explore your data, it usually is a good idea to compute some
statistics about them so that you can spot the obviously wrong data (for example,
when some data should be positive and it appears as a negative minimal value,
it is suspicious).
Most of the nodes require you to not have NaN values within the data to be analyzed.
You can remove them with the value modification techniques presented in the
previous chapter, or by filtering the rows, also discussed in the previous chapter.
The minimal and maximal values can be checked in the port view's Spec Columns
tab. This can already be used to spot certain kinds of problems.
For More Information:
www.packtpub.com/knime-essentials/book
Data Exploration
For statistics within groups, we have the good old GroupBy node. That allows
you to aggregate using the functions described on the Description tab of the
configuration dialog.
When you do not need the grouping, you can use the Statistics node with easier
configuration. Just select the columns, the number of values that should be present
in the view, and the number of common/rare values that should be enumerated.
You might find that the median is not computed in the results. In this case, you
should check the Calculate median values (computationally expensive) checkbox.
The following is the statistics you get in the view (for the numeric columns):
•
Minimum
•
Maximum
•
Mean
•
Std deviation
•
Variance
•
Overall sum
•
No. missings
•
Median
•
Row count
You also get the number of missing values and the most common and rarest values for
the selected nominal (and also numeric) columns, with their number of occurrences.
The statistics table, which is the first output port, contains the same content as the
view for the numeric columns. The second output port (occurrences table) gives
a table with the number of occurrences for each numeric and nominal values in a
decreasing order of frequencies (including the missing values).
Using the output tables, you can create conditions or further aggregate operations.
For example, creating the flow variables from the certain mean and standard
deviation and creating conditions using the Java Edit Variable node allows you to
filter the rows with certain ranges related to the mean and standard deviation with
the row filtering/splitting nodes. (Or use the Java Snippet Row Filter node directly
with the flow variables.)
The Value Counter node acts in a manner similar to the Statistics node's second
output, but in this case, only a single column is used. So, no missing values will
appear in the count column (which is not sorted) and the values from the original
column will appear as row IDs. In this form, they are better suited for visualization.
Also, because this node is able to support HiLite, you can select the original rows
based on the frequency values.
[ 68 ]
For More Information:
www.packtpub.com/knime-essentials/book
Chapter 3
When you want a similar (frequency) report with two columns and a possible weight
column to create crosstabs, you should use the Crosstab node. In the view of the
node, you get the crosstab values in the usual form. You can specify which parts
(Frequency, Expected, Deviation, Percent, Row Percent, Column Percent, or Cell
Chi-Square) should be visible. (The row and column totals are always visible, and if
there are too many rows or columns, you can keep only the first few.)
There is another table in the view, beneath the frequency. It is the summary of the
Chi-Square statistics (degree of freedom (DF), the 2 Value, and the probability (Prob)
of no association between the values (a p-value)), and also the Fischer test's probability,
when both columns contain exactly two values.
The Crosstab node's first output port contains the values similar to the view's main
table, but in this case, it is in a different form: the column values are in columns,
while the statistics (Frequency, Expected, Deviation, Percent, Row Percent, Column
Percent, Total Row Count, Total Column Count, Total Count, and Cell Chi-Square)
are in other columns. You can transform it to the usual crosstab form (keeping a
single statistics) using the Pivoting node (select one of the columns as the group
column, the other as pivot, and the statistics should be used as an aggregation
option). You can check the workflow from the crosstab.zip file available on this
book's website.
The second output table of the Crosstab node contains the statistics just like the
second part of the view, but in this case it is in a single row even if both the columns
contain two values (the Fischer test's p-value is in the last column).
When you want to create a correlation matrix, you should use the Linear
Correlation node. It will compute the correlation between the numeric-numeric
and nominal-nominal pairs. Also, a model will be created for further processing.
You can use this information to reduce the number of columns with the help of the
Correlation Filter node.
The view of the Linear Correlation node gives an overview about the correlation
values with the color codes.
There are three t-test computing nodes: Single sample t-test, Independent groups
t-test, and Paired t-test. The Single sample t-test can be used to test whether the
average of the selected columns is a specified value or not. The t-value (t), degree
of freedom (df), p-value (2-tailed), Mean Difference, and confidence interval
differences are computed relative to the specified mean value (the Test value). The
other output table contains some statistics about the columns, such as the computed
mean, standard deviation, standard error mean, and the number of missing values in
that column.
[ 69 ]
For More Information:
www.packtpub.com/knime-essentials/book
Data Exploration
The view of Single sample t-test contains the same information as the two
output tables.
When you want to compare the means of two measurements of the same population
(or at least not independent), you can use the Paired t-test node. The view and
the resulting tables contain the same statistics as the Single sample t-test node,
but in this case the mean difference is replaced with the standard deviation and
the standard error mean values, both in the view and the first output table. The
configuration options allow you to select multiple pairs of numeric columns.
For two sample t-tests, you should use the Independent groups t-test node. It
expects the two groups to be defined by a column; the values are grouped by that
column's values. You can select the column that contains the class for grouping
and the values/labels for the two groups within that column. The average of the
columns will be compared, and the t-tests will be computed both for the equal
variance assumption and without that assumption (first output table). The Levene
test is also computed to help decide whether the equal variance can be assumed
(second output table).
The descriptive statistics is augmented with the number of rows that are not in either
group (Ignored Count (Group Column)).
The last test for hypothesis testing is the One-way ANOVA. It allows you to
compare the means within groups defined by the values of a single column, just like
the Independent groups t-test node does; however, it supports multiple groups.
Finally, when you need robust statistics, you can use the Conditional Box Plot
node. It gives you the minimum and maximum values, the median, Q1, Q3, and the
whisker values (can be the same as min/max, else the 1.5 times interquartile range
(Q3 – Q1) below or above Q1 and Q3).
Overview of visualizations
The various options to visualize data in KNIME allow you to get an overview or
even publication-quality figures from the data you have preprocessed and analyzed.
The interactive versions of a node allow you to change the column selections and
probably the other extra options.
The JFreeChart nodes generate images from the input data, which is also available as
a view with further customization options. These nodes usually do not support the
HiLite feature and the different visual properties (color, size, and shape).
[ 70 ]
For More Information:
www.packtpub.com/knime-essentials/book
Chapter 3
First, to help decide what you use to open the data, we will compare the capabilities
of the different visualization nodes:
Node
Supported data types
Remarks
Box Plot
Numeric (multiple)
Provides robust stats
Conditional Box Plot
Nominal and numeric
(multiple)
Also gives robust stats
Histogram
Nominal or numeric and
numeric
Histogram (interactive)
Nominal or numeric and
numeric
Interactive Table
Any
Lift Chart
Nominal and probability
Line Plot
Numeric (multiple)
Parallel Coordinates
Nominal or numeric
Pie chart
Nominal and numeric
Pie chart (interactive)
Nominal and numeric
Scatter Matrix
Nominal or numeric
Scatter Plot
Nominal or numeric (two)
Bar Chart (JFreeChart)
Nominal
Bubble Chart (JFreeChart)
Numeric (three)
Group By Bar Chart
(JFreeChart)
Nominal (unique) and
numeric
Color properties
supported
HeatMap (JFreeChart)
Distance or numeric
Distance between rows
Interval Chart (JFreeChart)
Date and nominal
Line Chart (JFreeChart)
Numeric (multiple) or date
Color properties
supported
Pie Chart (JFreeChart)
Nominal
Color properties
supported
Scatter Plot (JFreeChart)
Numeric (two)
Color, shape used
Similar to port view
Multiple scatter plots
Linear Regression (Learner)
Numeric (multiple)
Scatter + line of model
Polynomial Regression
(Learner)
Numeric (multiple)
Scatter + graph of model
OSM Map View
Numeric (two)
Spatial data
OSM Map to Image
Numeric (two)
Spatial data, creates
image
Hierarchical Cluster View
Distance and cluster model
Dendrogram
[ 71 ]
For More Information:
www.packtpub.com/knime-essentials/book
Data Exploration
Node
Supported data types
Remarks
ROC Curve
Nominal and numeric
(multiple)
Enrichment Plotter
Numeric (multiple)
Spark Line Appender
Numeric (multiple)
No view, but creates
images
Radar Plot Appender
Numeric (multiple)
No view, but creates
images
There are a few other view-related nodes in KNIME (and many more with mostly
textual views). The Image To Table node can be useful when you want to iterate
(loop) through certain parts generating images. Because the image ports (dark green
filled rectangles) cannot be used with loop end nodes, you have to convert them to a
table column. This is the exact purpose of the Image To Table node.
On the other hand, when you want an image port to hold an image (for example, to
include it in a report), you should use the Table To Image node, which selects the
first row's selected image column and returns it as an image port object.
The last notable node is the Renderer to Image. It simply grabs a column and the
selected renderer, and creates an SVG or PNG image column with its content. You
can use this later in web pages or other places, where supported. This is very handy
when you want to handle a special kind of content; for example, molecules.
Visual guide for the views
In this section, we will introduce the iris dataset (Frank, A. & Asuncion, A. (2010).
UCI Machine Learning Repository (http://archive.ics.uci.edu/ml). Irvine,
CA: University of California, School of Information and Computer Science. Iris dataset:
http://archive.ics.uci.edu/ml/datasets/Iris) with some screenshots from
the views (without their controls).
[ 72 ]
For More Information:
www.packtpub.com/knime-essentials/book
Chapter 3
Box plot for the numeric columns
The Conditional Box Plot and the Box Plot nodes' views look similar. These are
also sometimes called box-and-whisker diagrams. The Box Plot node visualizes
the values of different columns, while the Conditional Box Plot view shows one
column's values grouped by a nominal column's values. As you can see in the
screenshot, the HiLite information is visible for the outliers (but only for those
values). You can also select the outliers and HiLite them.
The shape of the outlier points is not influenced by the shape property.
Histogram with a few columns selected, HiLited rows and colored values based on class attribute
[ 73 ]
For More Information:
www.packtpub.com/knime-essentials/book
Data Exploration
As the screenshot shows, the Histogram node's view is capable of handling the
color properties. It also supports the aggregation of different values, and the option
to show the values for the selected (or all) columns. The adjacent columns within the
dashed lines represent the different columns for each binning column value. This
way, you can compare their distributions for certain aggregations. The interactive
and the normal versions look quite similar, but they differ in configuration and
view options.
The Interactive Table view with changed renderer for petal length and color codes for class, Row43 is HiLited
The Interactive Table view first looks and works like a normal port view for a data
table (such as the options on the context menu for the column header: Available
Renderers, Show Possible Values, and sorting by Ctrl + clicking on the header;
the latter can be done from the menu with a normal click, too), although it offers
HiLiting and a few other options.
Lift chart of a model predicted by a decision tree, the colors are: red – lift, green – baseline, cumulative lift – blue
[ 74 ]
For More Information:
www.packtpub.com/knime-essentials/book
Chapter 3
The Lift Chart view can help evaluate a models' performance. The Cumulative Gain
Chart tab looks similar, although it has only two lines.
Line plot with some two HiLited rows and the four numeric columns: red – sepal length, yellowish – sepal
width, green – petal length, blue – petal width
The Line Plot view can be used to compare the different columns of the same rows.
The rows are along the x axis, while their values for different columns are along the y
axis. The adjacent row's values for the same column are connected with a line.
Parallel coordinates with colored curvy lines, the columns are: sepal length, sepal width, petal length, petal
width and class
[ 75 ]
For More Information:
www.packtpub.com/knime-essentials/book
Data Exploration
The Parallel Coordinates view can also visualize the individual rows, but in this case,
the row values for the different columns are connected (with lines or with curves). In
this case, the columns are along the x axis, while the values are along the y axis.
Scatterplot of sepal length vs. petal width with size information from sepal width
The Scatter Plot views can be used efficiently to visualize the two dimensions.
Although, with the properties, the number of dimensions from which information is
presented can grow to five.
The Open Street Map integration offers many ways to visualize spatial data; it supports color, shape, and size
properties and also works with HiLiting. Selected information from the input table is also available as a tooltip.
[ 76 ]
For More Information:
www.packtpub.com/knime-essentials/book
Chapter 3
The OSM Map View and OSM Map to Image nodes are designed to show data on
maps. They are very flexible, and can show many details, but they can also hide the
distracting layers.
Hierarchical clustering dendrogram (average linkage with Euclidean distance using the numeric columns)
The best way to visualize a clustering is by using a dendrogram, because the
distances between the clusters are visible in this way. The Hierarchical Cluster
view offers this kind of model visualization. To show the similarity between the
rows, first you have to compute the cluster model using the Hierarchical Clustering
(DistMatrix) node from the KNIME Distance Matrix extension, available on the
KNIME update site.
JFreeChart bubble chart
[ 77 ]
For More Information:
www.packtpub.com/knime-essentials/book
Data Exploration
The Bubble Chart (JFreeChart) node can offer an alternative to the scatter plots;
however, in this case, the dimension of the size is also mandatory.
JFreeChart heatmap with Euclidean distance of numeric columns
The HeatMap (JFreeChart) node provides a way to visualize not just the collection
columns, but also the distances, as shown in the previous screenshot. To use the
regular tables, you might require a preprocessing step which uses the Create
Collection Column or the GroupBy node to compute the distances, but it also works
fine for displaying the values.
JFreeChart pie chart
The Pie Chart (JFreeChart) node also offers a visualization with a pie, and unlike the
Pie chart and the Pie chart (interactive) nodes, this can create three-dimensional pies.
[ 78 ]
For More Information:
www.packtpub.com/knime-essentials/book
Chapter 3
The spark lines and radar plot for numeric columns
The results of the Spark Lines Appender and the Radar Plot Appender nodes are
not the individual views, but are the new columns with the SVG images generated
for each row. We can use this in the next chapter.
Distance matrix
The distance matrix is used not just for visualization, but for learning algorithms
too. You can think of them as a column of collections, where each cell contains the
difference between the previous rows.
The supported distance functions are the following:
•
•
Real distances
°
Euclidean(
°
Manhattan (
°
Cosine (
)
)
)
Bitvector distances
|v1 v2|
°
Tanimoto ( 1
°
Dice ( 1
°
Bitvector cosine ( 1
|v1|+|v2|-|v1v2|
2|v1 v2|
)
|v1|+|v2|
)
|v1 v2|
|v1||v2 |
)
•
Distance vector (assuming you already have a distance vector, you can
transform it to a distance matrix when there are row order changes or filtering)
•
Molecule distances (from extensions)
[ 79 ]
For More Information:
www.packtpub.com/knime-essentials/book
Data Exploration
The distance matrix feature can be used together with the hierarchical clustering,
which also provides a node to view it; this is the main reason we introduced them in
this chapter.
You can generate distances using the Distance Matrix Calculate node (just select
the function, the numeric columns, and set the name. The chunk size is just for
fine tuning larger tables), but you can also load that information with the Distance
Matrix Reader node.The HiTS extension (http://code.google.com/p/hits) also
provides a view to show dendrograms with heatmaps.
Using visual properties
One of KNIME's great features is that it allows you to set certain properties of the
views in advance. So, you need not remember how you set them in one view and
how it is set in another, you just have to connect them to the same table. This is a
big step towards reproducible experimental results and figures with the ease of
graphical configuration. Each property is applied to the rows based on column
values, so changes in column values will affect (remove) the property and each
kind of property is exclusive (a new node with the same kind of properties
replaces the original property). When you want to reuse the properties in another
place of the workflow, you can use the appender nodes.
The three supported properties are: color, size, and shape.
Color
With the Color Manager node, you can set the color for different rows. The colors
can be assigned either to a nominal or a numeric column.
In the case of the nominal columns, each value can have a different color. This can
be useful when you want to compare the actual or the predicted labels/classes of
the rows.
When you assign colors to the numeric columns, the color of the minimal and the
maximal value (as it is available in the column specification: Lower Bound, Upper
Bound) should be specified. The remaining shades are linearly computed.
The Color Appender node allows you to use the same color configuration for other
tables. Be careful when there are values outside the domain. The nearest extreme
value is used in case of numeric columns and the black color is used for nominal
columns. It is also possible to set an incompatible format to the column, but in that
case, it will not be used.
[ 80 ]
For More Information:
www.packtpub.com/knime-essentials/book
Chapter 3
Size
The size of the points can be really a good indicator of the nonvisible attributes.
It allows you to have larger or smaller dots for the different data points in views.
The size is computed by the Size Manager node as a function of the input from the
minimal value to the maximal value, similar to the numeric color property. (Based
on the domain bounds, outside them the nearest extreme is used.)
Be careful not to use this node on columns where the minimum is less
than zero (the logarithmic and the square root function would generate
a complex number). Also, check the bounds after filtering; you might
need to use the Domain Calculator.
The following are the supported functions:
•
LINEAR: It is a linear function between the bounds
•
SQUARE_ROOT: It is useful when you want a less increase in the
higher values, but want more details of the lower values
•
LOGARITHMIC: It is ideal when there is large difference between
the bounds and more details near the lower bound is interesting
•
EXPONENTIAL: The exponential function will make even small
differences large
The Size Appender allows you to use the same size configurations in different
places of the workflow, even for other columns.
Shape
The last property you can set is the shape of the points. For this purpose, you have
the Shape Manager node, which allows you to set the shape based on a nominal
column's values. Together with the Color Manager, you can visualize both the
predicted and the original class of the training dataset. This can give you a better
idea when the data is not properly learned and clustered, and might give you ideas
to improve the settings.
Similar to other properties, the Shape Appender can bring the shape configuration
to other parts of a workflow.
[ 81 ]
For More Information:
www.packtpub.com/knime-essentials/book
Data Exploration
KNIME views
You can export the view contents to either the PNG or SVG files from the File | Export
as menu. (The latter is only available when the KNIME SVG Support is installed.)
It is worth noting the other usual view controls. The File menu contains the Always
on top and Close options, besides the previously discussed Export as menu. The first
option allows you to compare the multiple views easily by having them side-by-side
and still working with other windows.
The rest of the menus are related to HiLiting, which will be discussed soon.
The configuration of nodes usually includes an option of how many different
values or how many rows should be used when you create the view. Because the
views usually load all the data (or the specified amount) in the memory to have
a resizable content, too many rows would require too much memory, while too
many different values would make it hard to understand either the legends or the
whole view in certain cases.
The mouse mode controls allow you to select certain points or set of points (for
example, in the case of hierarchical clustering and the histogram nodes), to zoom
in or to move around in a zoomed view. With the Background Color option, you
can change the background of the plot. The Use anti-aliasing option can be used to
apply subpixel rendering for fonts and lines.
HiLite
The HiLite menu consists of the HiLite Selected, UnHiLite Selected, and Clear
HiLite items. With these items, you can create fine-grained HiLite rows. Once
you select a few data points/rows, you can add or remove the HiLite signal using
the first two options, and the third clears all the HiLite signals from this part of
the workflow.
Lots of the nonview nodes also have HiLite-related options, which can be very
handy when the row's IDs change and want to propagate HiLiting to the parts
with different row IDs of the workflow; however, beware, as this usually requires
additional memory.
The Show/Hide menu (or the HiLite/Filter menu) also helps the HiLite operations.
The Show hilited only option hides all the non-HiLited rows/points. The default
option is usually Show all, but the Fade unhilited option is a compromise between
the two (shows both the kinds of data, but the non-HiLited are faded or grey).
[ 82 ]
For More Information:
www.packtpub.com/knime-essentials/book
Chapter 3
Use cases for HiLite
You might wonder how this HiLite feature is useful.
With the Box Plot and the Conditional Box Plot nodes, you can select the rows
that have extreme values in certain columns or extreme values within a class
without creating complex filtering. (The extremity is defined as below Q1 - 1.5IQR
or as above Q3 - 1.5IQR
It is also useful to see the same selection of data from different perspectives. For
example, you have the extremes selected based on some columns, but you are
curious to know how they relate to other columns' values. The Parallel Coordinates
or the Line Plot can give a visual overview of the values. The Scatter Plot (or the
Scatter Matrix) node is also useful when different columns should be compared.
When you prefer the numeric/textual values of the selected rows, you should use
the Interactive Table node. It allows you to check the HiLited and non-HiLited rows
together or independently with the order of the column you want.
With the Hierarchical Clustering View node, you can select certain clusters (similar
rows). This can also be useful to identify the outlier groups based on multiple
columns (as the distances can be computed from more than one columns).
Row IDs
It is important to remember that the row IDs play an important role for most of the
KNIME views. The row IDs are used as axis values; that is, tooltips. So, to create a
nice, easy-to-understand figure/view, you have to provide as many useful row IDs
as you can.
To use meaningful labels, you have to create a column with the proper (unique)
values, and make that column a row ID with the help of the RowID node. This
node also offers HiLite support (Enable Hiliting), so you do not have to make a
compromise between neat figures and HiLiting.
Extreme values
The infinite values (Double.POSITIVE_INFINITY and Double.NEGATIVE_INFINITY)
make the ranges meaningless, because these values are not measurable by normal
real values.
[ 83 ]
For More Information:
www.packtpub.com/knime-essentials/book
Data Exploration
The other special value is the Double.NaN (not a number) value, which you get, for
example, when you divide zero by zero. It is not equal to any numeric value, not
even to itself. It also makes comparison impossible, so it should be avoided as much
as possible. The previous chapter has already introduced how to handle these cases.
The missing values are usually handled by not showing the rows containing them,
but some views make it possible to use different strategies.
Basic KNIME views
The main views of KNIME give you multiple options to explore data. These nodes
do not provide options to generate images for further nodes, but they give quite a
good overview about the data, and you can save the files using the File menu.
There are different flavors for some of the nodes: the interactive and the normal.
With the interactive flavor, you can modify certain parameters of the view without
reconfiguring (and executing) the view. The interactive versions are better suited
for data exploration, but the normal ones make it easier to check certain things with
new data.
The Box plots
The Box Plot node has no configuration, but gives robust statistics (minimum,
smallest, lower quartile, median, largest, and maximum) for numeric columns. You
might wonder about the difference between the minimum and the smallest values or
the largest and maximum values. The smallest is the maximum of the minimal value
and the Q1 - 1.5IQR = Q1 - 1.5(Q3 - Q1) value. The largest is computed analogously.
The view gives a box-and-whisker diagram, which is useful to find outliers. The
Column Selection tab allows you to focus only on certain columns. The Normalize
option on the Appearance tab will rescale the box-and-whisker diagrams to have the
same length on the screen between the minimum and maximum values.
The Conditional Box Plot node's view is quite similar to the Box Plot view, although
in this case, the diagram is not split by the columns, but by a preselected nominal
column. The values are representing the values from a numeric column. You can also
select whether the missing values should be visible or not.
The node view controls are really similar to the Box Plot's. However, in this case,
the Column Selection tab does not refer to the columns from the table, but to the
columns on the diagram; you can select the class values that should be visible.
[ 84 ]
For More Information:
www.packtpub.com/knime-essentials/book
Chapter 3
Hierarchical clustering
There is an option to visualize the result of hierarchical clustering with the
Hierarchical Cluster View node; however, it is worth summarizing how you can
reach the state when you can show the cluster model. First, you have to specify the
distance between the rows using one of the options we described in the Distance
matrix section.
In the Hierarchical Clustering (DistMatrix) node's configuration, the main option
you have to select is the Linkage Type, which defines how the distance between the
clusters should be measured:
•
Single: It measures the minimal distance between the cluster points
•
Average: It measures the average of differences between the points of
the clusters
•
Complete: It measures the maximal distance between the cluster points
You can also select between the distance matrices if you have multiple columns.
Histograms
The difference between Histogram and Histogram (interactive) is minimal in the
configurations (the non-interactive version allows you to specify the number of bins
configuration time). The common configuration options are the Binning column,
Aggregation column, and the No. of rows to display. With the Binning column
option, you can define how the main bins should be created; it can be either nominal
or numeric. The coloring information splits between the bars, and the aggregation
columns are available as separate, adjacent bars.
The possible aggregation options are: Average, Sum, Row Count, and Row Count
(w/o missing values). When you have multiple aggregation columns selected, Row
Count (with missing values) is not an informative or recommended choice.
On the Visualization settings tab, you can further customize the view, by enabling/
disabling outlines, grid lines, the orientation, width, or the labels.
The Details tab gives the information about the selected bars, such as the average,
sum, count for each column, and colors. (You can select the monochrome part of a
bar too.)
[ 85 ]
For More Information:
www.packtpub.com/knime-essentials/book
Data Exploration
Interactive Table
The interactive table looks like a plain port view; however, it gives further options,
such as the HiLiting support and the optional color information (in the port view,
it is not optional). You can also save the content to the CSV file (Output | Write
CSV), adjust the default column and row size (View | Row Height... and Column
Width...), and find certain values (Navigation | Find, Ctrl + F).
The options for sorting by columns (Ctrl + click, or the menu from the regular click)
and reordering (dragging) them are also available in this view, and you can select the
preferred renderers for them. However, you cannot check the metadata information
(column stats and the properties).
The Lift chart
The Lift Chart node is useful when you want to evaluate the fit of a model for a
binominal class. In the configuration dialog, you can specify what is the training
label and the value learned. The probabilities of the learned label should also be
specified, just like the width of the bins (in percentage, you will get 100/that value
points). In the view, there are two parts—Lift Chart and Cumulative Chart—both
with separate configurations of color, line widths and dot sizes (with visibilities).
The Lift Chart node also contains the cumulative lift, but it can be made invisible if
you do not want it.
Lines
The Line Plot node and the Parallel Coordinates views are similar, but they show
the data in the orthogonal/transposed form with respect to each other. The Parallel
Coordinates view contains the selected columns on the x axis and the row values
flow horizontally colored by the color properties, while in Line Plot, the rows are on
the x axis and the (numeric) columns are represented by user-defined colors.
The missing values are handled differently; in Line Plot, you can try to interpolate,
while in the other, you can either omit or show them or their rows.
Line Plot is more suited for equidistant data, such as time series, for other data
it might give misleading results (the distances between the rows are the same).
The Parallel Coordinates view is better suited to find connections between the
values of different columns, because in this case you have no ordering bias. The
Parallel Coordinates view gives a neat option to use curves instead of straight lines.
Fortunately, you can change the order of columns within the view using the extra
mouse mode Transformation, so you can create neat figures with this view. This
view is quite good to show intuitive correlations.
[ 86 ]
For More Information:
www.packtpub.com/knime-essentials/book
Chapter 3
Pie charts
The Pie Chart and the Pie Chart (interactive) nodes have the same configuration
options, although for the latter, the configuration gives only the overridable defaults
in the view. These configurations include the binning column and the aggregation
column, just like the aggregation function.
With Ctrl + click, you can select multiple pies. HiLiting works in this view, and
the Details tab contains statistical information for each selected sections, which
is split by the colors within the pies. When the binning is not consistent with the
color property, no coloring is applied unless you select them (and enable the Color
selected section).
In the Visualization setting tab, you can specify whether the section representing
the missing values should be visible or not, show outline, explode the selection, or
whether the aggregated value/percent should be visible or not (for selected, all, or
no sections). The size of the diagram too can be adjusted in this tab.
The Scatter plots
The Scatter Matrix and the Scatter Plot nodes are quite similar. The Scatter Matrix
node is a generalization of the latter. It allows you to check the scatter plots for
different columns side-by-side.
A scatter plot can use all the visual properties (size, shape, and color), so you can
visualize up to five different columns' values on a 2D plot.
There are not many configurations for either maximum rows or maximum distinct
nominal values in a column.
In the case of Scatter Plot, you can only select the two columns for the x and
y axes, but in case of the Scatter Matrix node, you can set the ranges for them.
With the Scatter Matrix, you can select multiple columns, and when you are in
the Transformation mouse mode, you can rearrange the rows/columns, but you
cannot change their ranges.
Both the views support the jittering when one of the columns is nominal (the
Appearance tab, Jitter slider). In that case, the values in the other dimension get
some random noise, so the number of points at a position could be easily estimated.
If you want precise positions, you might consider adding transparency to the color
of the points, so when there are overlaps, they will be more visible.
[ 87 ]
For More Information:
www.packtpub.com/knime-essentials/book
Data Exploration
The Linear Regression (Learner) and the Polynomial Regression (Learner) nodes
also provide the scatter plot views, although these show the model as a line. It can
be useful to have a visual view of the regression, even though these do not specify
which slice of the function is shown from the many possible functions, parallel to
the selected.
Spark Line Appender
The Spark Line Appender node does not have a view, but it generates a column
with an SVG image of a line plot of the selected numeric columns, for that row.
This can be useful to find interesting patterns. However, it is recommended to
use Interactive Table, because the initial size is hard to see, and changing the row
height multiple times is not so much fun (and can be avoided if you hold the Shift
key while you resize the height of a row). But with the special view, you can do
that from the menu.
Radar Plot Appender
The Radar Plot Appender node works quite like the previous node, although it has
more configuration options. You can set many colors for the SVG cell, and also the
ranges and the branches (columns) of the radar plot. The resulting table has a bit
larger predefined row height, but the use of an Interactive Table view might still be
a good idea.
The Scorer views
The ROC Curve (ROC (Receiver Operating Characteristic)) and Enrichment Plotter
nodes give options to evaluate a certain model's performance visually. Because the
views are not too interactive, you have to specify every parameter upfront in the
configuration dialog.
In the ROC Curve configuration, you have to select the binominal Class column and
the label (Positive class value) to which the probabilities belong. This way, you will
be able to compare different kinds of models or models with different parameters.
The node also provides the areas beneath the ROC curve in the result table.
The Enrichment Plotter node helps you decide where to set the cut-off point to select
the hits. The node description gives a more detailed guide on how to use it.
[ 88 ]
For More Information:
www.packtpub.com/knime-essentials/book
Chapter 3
JFreeChart
The JFreeChart nodes are not installed by default, but the extension is available
from the standard KNIME update site under the name KNIME JFreeChart.
The common part of these nodes is that you have to specify the appearance of
the result in advance, and the focus is not on the view, but on the resulting image
port object.
In the General Plot Options Configuration tab, you can specify the type of the
resulting image (PNG or SVG), the size, the title, colors, and the font size (relative
to the standard font for each item printed).
You can use the port objects in the reports, but you can also use them to check certain
properties if you iterate through a loop and convert the result with Image To Table.
It is important to note that the customizable JFreeChart View tab is only available in
freshly executed nodes. The generated image can be visualized either using the view
or the image output.
In the JFreeChart View tab, you can customize (from the context menu) almost every
aspect of the diagram (fonts, colors, tics, ranges, orientation, and outline style). This
way, the output can be of quite a high quality. It is also important to note that the
export is easier: you can use the Copy option to copy it to the clipboard or directly
use the Save as... option to save it as a PNG file, and because there are no visible
controls, you do not have to cut them off.
These nodes do not support HiLiting, but they provide tooltips about values. The
support for properties is usually not implemented.
You can zoom in on these nodes by selecting a region (left to right, top to bottom)
and zoom out by selecting in the opposite direction. You can also use the context
menu's zooming options. (It seems that you cannot move around using the mouse
or keyboard, so you have to zoom out and select another region if you want to see
the details of that region.)
The Bar charts
The Bar Chart (JFreeChart) node's view is similar to a usual histogram, but it does
not allow any other aggregation other than the count function, and only nominal
columns are accepted. The color of the first column can be specified, just like the
labels for the axis. The nominal columns' values can be rotated, and the angle can
be set. You can also enable/disable the legends.
[ 89 ]
For More Information:
www.packtpub.com/knime-essentials/book
Data Exploration
The GroupBy Bar Chart (JFreeChart) node's configuration is similar, except in this
case, the nominal column is a single column (it can also be numeric), and the rest
of the numeric columns can be visualized against it. It is important to note that the
binning column should contain unique values. (The numeric values are grouped by
these values.)
The Bubble chart
The Bubble Chart (JFreeChart) node's view is analogous to the Scatter Plot view,
but in this case, you cannot set the color and the shape, but the color is not opaque. It
also cannot handle nominal columns, so you have to convert them to numbers if you
want to plot them against other columns. You must specify the x and y positions of
the bubbles, just like their radius.
Heatmap
The Heatmap (JFreeChart) node is capable of visualizing not just the values in
multiple columns, but also the distances from the other color-coded rows, when a
distance column is available.
The extreme colors can be specified in the HeatMap (JFreeChart) node's
configuration for the minimal and the maximal distance, and the legend can also
be visible or hidden. The labels for the axes can be specified, and the tooltip is also
available on demand.
The Histogram chart
This is a bit different from the histogram views previously introduced. In this view,
the histograms can be either behind or in front of other histograms. The different
ranges are shown on the same scale, so some of them can be wider while the others
are narrower.
The color of the bars is only adjustable for the first column. The histograms are
plotted in order, the last is at the back, while the first is in the front. You cannot
change the order of the histograms from the view of Histogram (JFreeChart).
The Interval chart
The Interval Chart (JFreeChart) node's view is not so interesting when your
label is not unique (or the order is not defined by its alphabetical order). But this
view supports the time values without the need to transform your data with time
information before visualization, focusing on that information.
[ 90 ]
For More Information:
www.packtpub.com/knime-essentials/book
Chapter 3
You can specify the grouping nominal column (Label) and the start and end
positions of the time intervals. Each row represents an interval.
It supports the color properties, so you can create overlapping intervals with
different colors.
The Line chart
The Line Chart (JFreeChart) node's view is quite similar to the regular Line Plot
view, except in this case, you cannot have dots to show the values. However, there
is an extra input table to specify the colors of the series.
The other difference is that when specified, you can use the numeric or date column's
values instead of the rows for the values of other columns; however, the connections
are still done by the adjacent rows.
The Pie chart
The Pie Chart (JFreeChart) node's view is similar to the Pie Chart node, but it is
less interactive. It still uses the color properties (as opposed to the other JFreeChart
nodes) and can draw the pie in 3D.
The Scatter plot
The Scatter Plot (JFreeChart) node uses the shape and color properties, so it can
visualize at most four columns. This is still quite static but configurable, and the
result looks good (it can contain the legend, so it is practically ready to paste).
This node is quite constant too; you have to decide which columns should be there
in the configuration dialog.
Open Street Map
In the KNIME Labs Extensions (available from the main KNIME update site) you can
install the KNIME Open Street Map Integration in order to visualize spatial data.
This extension contains two nodes, OSM Map View and OSM Map to Image. The
first one is the interactive, you can browse the map and check the data points (the
tooltips can give details about them), think find the distribution of interesting points
by HiLiting them. (HiLiting cannot be done using these nodes, but you can select
area "blindly" if you use a Scatter Plot with the longitude and latitude information.)
[ 91 ]
For More Information:
www.packtpub.com/knime-essentials/book
Data Exploration
Both nodes require coordinates to be in the range of -90 to 90 for latitude and -180
to 180 for longitude if there is an input table (which is optional). The image node's
configuration includes a map to select which area should be visible on the resulting
image, the configuration for the coordinates is on the Map Marker tab.
In the OSM Map View, you can browse by holding the right mouse button down
and moving around. Zooming is configured for double-click and mouse wheel.
3D Scatterplot
We are highlighting a view from the many third party views because this is really
neatly done, and you might not find it initially interesting if you do not work with
chemical data.
In the Erl Wood Open Source Nodes extension (from the community update site),
you can find a node called 2D/3D Scatterplot. It allows you to plot 3D data and still
use KNIME The HiLite functionality and the color, and size properties (but that can
also be selected on demand). This is a very well designed and implemented view
node. Its configuration is limited to column filtering and the number of rows/distinct
values that should be on the screen.
This node does not support the automatic generation of a diagram. It's more focused
towards exploration and not towards creating final figures.
It can also provide a regression fit line in 2D mode. It can be a good alternative to the
normal Scatter Plot node too (unless you need the shape properties).
A right-click on the canvas gives information about the nearest point as a tooltip,
which can be very useful when you need more information about the other
dimensions (even the chemical structures and images are rendered nicely).
In the 3D mode, you can select points while holding down the Ctrl key.
Other visualization nodes
There are many options to show data, and you really do not have to limit yourself
with those which are bundled with KNIME. In the community contributions
(http://tech.knime.org/community), there are many options available. We will
cherry-pick some of the more general and interesting visualization nodes.
[ 92 ]
For More Information:
www.packtpub.com/knime-essentials/book
Chapter 3
The R plot, Python plot, and Matlab plot
The R plot, Python plot, and Matlab plot are available from the corresponding
scripting extensions (the KNIME R Scripting extension, KNIME Python Scripting
extension, and KNIME Matlab Scripting extension) on the community nodes
update site.
The usage of these nodes do not require experience in the corresponding
programming languages. There are templates from which you can choose and the
parameters can be adjusted using KNIME controls. Obviously, you can create your
own templates or fine-tune existing ones if you are not satisfied.
You need to have access to (possibly local) servers to connect to the extensions. (The
Python Plot node uses (C)Python with some extensions.)
These nodes also generate images as their outputs in the PNG format.
Please take a look at their figure template gallery (http://idisk-srv1.mpi-cbg.
de/knime/scripting-templates_public/figure-template-gallery.html) to
get an idea of what is possible and how they look.
The official R plots
The KNIME R Statistics Integration extension from the main KNIME update site
offers similar options like the R Plot discussed previously, but it does require some R
programming knowledge (the templates help the configuration).
When you want to use it locally, you will need the Table R-View node, but when
you use an R server, you should use the R View (Remote) node. The result is also
available in the PNG format.
The recently introduced R View and other interactive KNIME nodes offer other
options for the visualization of data. For details, please check KNIME's site at
http://tech.knime.org/whats-new-in-knime-28
The RapidMiner view
The RapidMiner Viewer node is available on the community nodes and offers the
Plot View and the Advanced Charts modes to visualize the data using RapidMiner's
results view. It requires some pre-configuration, but after that, you will have a
powerful tool for visual data exploration. (Unfortunately, it does not use many
KNIME features; it neither supports HiLiting, color, shape, or size properties, nor
provides the figure as an image.)
[ 93 ]
For More Information:
www.packtpub.com/knime-essentials/book
Data Exploration
The views offer a wide range of visualization options and give highly customizable
figures. It can even de-pivot in the view, so you do not have to create complex
workflows to get an overview of the data. This view supports the following plots:
Scatter, Scatter Multiple, Scatter Matrix, Scatter 3D, Scatter 3D Color, Bubble, Parallel,
Deviation, Series, Series Multiple, Survey, SOM, Block, Density, Pie, Pie 3D, Ring,
Bars, Bars Stacked, Pareto, Andrews Curves, Distribution, Histogram, Histogram
Color, Quartile, Quartile Color, Quartile Color Matrix, Sticks, Sticks 3D, Box, Box 3D,
and Surface 3D.
The Advanced Charts also support multiple visualizations. You can set the color,
shape, and the size dimensions, although these are not auto-populated by the
available properties. With the Advanced Charts, the details of the diagram can
be configured in more depth than with the JFreeChart. It is worth reading the
user manual of RapidMiner in this regard at http://docs.rapid-i.com/files/
rapidminer/RapidMiner-5.2-Advanced-Charts-english-v1.0.pdf.
This node allows you to export the figure (without the controls) in various image
formats. It is available from the icon in the upper-right corner.
The HiTS visualization
The HiTS visualization might not fit the previous extensions as it is not available
on the usual KNIME update sites. But it might bring your attention to look for
alternative options when you need a functionality, because there are many KNIME
nodes available besides the one we saw in the previous sections.
The HiTS extension's website is https://code.google.com/p/hits/. The update
site is http://hits.googlecode.com/svn/trunk/ie.tcd.imm.hits.update/.
On the website, look for the HiTS experimental features (and also check its
dependencies: HiTS main feature and HiTS third party components feature) in the
HiTS main category.
The Plate Heatmap node might not be so interesting, because it is quite specific to
high content/throughput screening, but the Simple Heatmap and the Dendrogram
with Heatmap nodes are generally useful. These support the HiLite feature and give
an overview about the data with color codes.
The Dendrogram with Heatmap node uses the hierarchical clustering model to
show the dendrogram. Together with the heatmap, it gives you a better idea about
your clusters.
[ 94 ]
For More Information:
www.packtpub.com/knime-essentials/book
Chapter 3
Tips for HiLiting
HiLiting gives great tools for various tasks: outlier detection, manual row selection,
and visualization of a custom subset.
Using Interactive HiLite Collector
First, let's assume you want to label the different outlier categories. In case of an iris
dataset, the outlier categories should be the high sepal length, high sepal width, high
petal length, high petal width, and their lower counterparts. You can also select the
outliers by different classes (iris-setosa, iris-versicolor, and iris-virginica) for each
column (in both extreme directions), which gives
possible options. Quite
a lot, but you will need only four views to compute these (and only a single, if you
do not want to split according to the classes).
Let's see how this can be done. We will cover only the simpler (no-class) analysis.
Connect the Box Plot node to the data source. Also, connect the Interactive
HiLite Collector node to it. Open both the views; you should execute Box Plot,
and the collector.
There are only four outlier points on this plot: three high values for sepal width and
one low value also for sepal width. First, you can select and HiLite, for example,
the high values. Now switch to the collector view and set a label to this group (for
example, high sepal width), and also check the New Column checkbox. Once done,
click on Apply. Now you can clear the HiLite (from any view) and select the other
group and HiLite. Go to the collector again and give a name to this group too; then
click on Apply again (keeping the New Column option on).
The Interactive HiLite Collector node is executed by every click on Apply and
augment the original table with two new columns. The different labels are in the new
columns. The rows that are not marked contain missing values in those columns.
If you do not check the New Column checkbox (when you click on Apply), the
values will go to the same column. If there were already some value(s), then the new
value will be appended, separated by a comma (,).
You can start a new selection after you reset the Interactive HiLite Collector node,
but you can use a different collector if you want to keep the previous selection.
In the final result, you might want to replace the missing values with something,
such as the text normal using the Missing Value node. (Do not forget to recalculate
the domain with the Domain Calculator node for certain use cases.) This way, you
can further visualize, add color, or shape properties. With this information, you can
have better understanding and can find other connections among the data.
[ 95 ]
For More Information:
www.packtpub.com/knime-essentials/book
Data Exploration
When you need only a single HiLited/non-HiLited option to split the data, you
should use the HiLite Filter option (yes, it would be more consistent if it were
named HiLite Splitter, but for historical reasons, this name remained).
Finding connections
We already mentioned the tip to further process the result of the Interactive HiLite
Collector node. That way, you can identify various outliers and compare them to
other dimensions; for example, with Parallel Coordinates, Line Chart, or one of the
scatter plots.
Use Color Manager or Shape Manager to change the plot of the points.
Most of the nodes supporting HiLite also support filtering out the non-HiLited rows;
because you can have multiple views open, and also focus only on the interesting
rows/points in the other views too.
When you pivot or group according to the table, you can still use HiLiting, so
you can select an interesting point in one table and HiLite it; on the other end, the
corresponding rows will also be HiLited. For example, with this technique you can
use Box Plot instead of the Conditional Box Plot, and you do not need to iterate
through the possible columns individually.
Visualizing models
In the previous chapter, we created a workflow to generate a grid. That must have
looked pointless at that time, but now, we will move a bit forward and show an
application. The GenerateGridForLogisticRegression.zip file contains the
workflow demonstrating this idea with the iris dataset.
In this workflow, we use a setup very similar to the Generate Grid workflow till
the preprocessing meta node, but in this case, we use the average of minimum and
maximum values instead of creating NaN values when we generate a grid with a
single value in that dimension. (This will be important when we apply the model.)
We also modified the grid parameters to be compatible with the iris dataset. In the
lower region of the workflow, we load the iris dataset from http://archive.ics.
uci.edu/ml/datasets/Iris, so we can create a logistic regression model with the
Logistic Regression (Learner) node (it uses all numeric columns).
We would like to apply this model to both the data and the grid. This is an easy part;
we can use two Logistic Regression (Predictor) nodes.
[ 96 ]
For More Information:
www.packtpub.com/knime-essentials/book
Chapter 3
Exercise
Once you understand the details of the Prepare (combine) meta node, try
to modify the workflow to use a single predictor. (You can use the Row
Filter node for an efficient solution, but other options are also possible.)
Let's see what is inside the Prepare (combine) meta node. It uses three input tables:
the configuration, the grid, and the data. We use the configuration to iterate through
the other tables' content and bin them according to the configuration settings.
There is one problem though. When you select a single point for one of the
dimensions, the grid will only have that value for binning, and the data values will
not be properly binned. For this reason, we will add the data to create a single bin.
But when the minimum and maximum values are present, we do not include them
because that would cause different bin boundaries. To express this condition, we use
two Java IF (Table) nodes and an End IF node.
With the Auto-Binner node, we create the bins. We have to keep only the newly
created binned column (Auto-Binner (Apply)). So, we first have to compute its name
(add [Binner] Java Edit Variable), then set as include column filter.
Finally, we collect the new columns (the Loop End (Column Append) node's "Loop
has same row IDs in each iteration" option) and join the two old (data and grid)
tables with the new bin columns using the Joiner node.
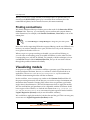
You might wonder why we have to bin the values at all. Look at the following figure:
In the three-dimensional space, we have some points and a plane orthogonal to one
of the axes; on that plane, there is a single red point. On most of the planes there are
no points; the circled points are between the two blue planes
[ 97 ]
For More Information:
www.packtpub.com/knime-essentials/book
Data Exploration
If we would slice by a single value on the orthogonal axis, there would be no values
most of the time. For this reason, we select a region (a bin on the orthogonal axis)
where we assume that the points would behave similarly when we project them to
the plane we selected. (That is the cuboid in the figure; however, that is not limited
to the non-orthogonal axis.)
Alright; so, we have these projections, but the points can be in multiple projections.
We have to select only a single one to not get confused. To achieve this, we have
added two Nominal Value Row Filters (filter by bin one and filter by bin two).
(In the current initial configuration, this is not required, but it is usually necessary.)
How many Row Filters do we need in the general case?
The number of columns used to generate the model specifies the
number of dimensions visualized in the view (for example, if we add
a size manager we would need only a single row filter).
Now, we add the training class information (class column) as a shape property
(the grid does not have this information) with the Shape Manager and add the
predicted class (class (prediction) column) as colors with the Color Manager.
Finally, we add the Scatter Plot node to visualize the data.
Exercise
Can you generate all the possible slices for the grid? (You should
increase the current 1 grid parameters before doing this.) With the
Scatter Plot (JFreeChart) node, you can generate quite similar figures.
KNIME has many nodes, not just for visualization, but for classification too.
This gives the idea for the next exercise.
Exercise
Try other classification models and check how they look like compared
to the logistic regression. Try other visualizing options too.
[ 98 ]
For More Information:
www.packtpub.com/knime-essentials/book
Chapter 3
Further ideas
One of our problems was that we cannot visualize four dimensions of data (with
two dimensions of nominal information) on the screen. Could we use a different
approach to approximate this problem? (Previously, we created slices of the space,
projected to 2D planes, and visualized the plane.) We are already familiar with the
dimension reduction techniques from the previous chapter. Why not use them in this
visualization task? We can do that. And it might be interesting to see which one is
easier to understand.
Where should we put the MDS or PCA transformation? It has to be somewhere
between the data and the visualization. But, should it be before the model learning
or after that? Both have advantages. When you reduce the dimensions after model
learning, you are creating the model with more available information, so it might get
better results and you can use that model without dimension reduction too. On the
other hand, when you do the dimension reduction in advance, the resulting model
is expressed in the reduced space. It can be simpler, even more accurate (because the
dimension reduction could rotate and transform the data to an easier-to-learn form),
and faster.
Exercise
Try the different dimension reduction techniques before and after
learning. Also try different classification tasks too. Does one of
them give you neat figures?
It might be interesting to see the transformed grid too, because the different dimension
reduction techniques will give different results. These will give some clue about where
the original points were. HiLiting is a great tool to understand these transformations.
Exercise
In your data analysis practice, you could try to adapt one of the
techniques we introduced. In real-world data, different approaches
might work better.
Summary
In this chapter, we introduced the main visualization nodes and the statistical
techniques that could be used to explore your data. We built on the knowledge
you gathered in the previous chapter, because data transformation is inevitable in
a complex analysis. The HiLiting was previously introduced, but with the use cases
in this chapter, you might now have a better idea about when you should use it.
[ 99 ]
For More Information:
www.packtpub.com/knime-essentials/book
Where to buy this book
You can buy KNIME Essentials from the Packt Publishing website:
.
Free shipping to the US, UK, Europe and selected Asian countries. For more information, please
read our shipping policy.
Alternatively, you can buy the book from Amazon, BN.com, Computer Manuals and
most internet book retailers.
www.PacktPub.com
For More Information:
www.packtpub.com/knime-essentials/book