1
A Tour of Trellis Graphics
Richard A. Becker
William S. Cleveland
Ming-Jen Shyu
Bell Laboratories
Murray Hill, New Jersey 07974
Stephen P. Kaluzny
Statistical Sciences Division, MathSoft
1700 Westlake Avenue North
Seattle, Washington 98109
April 15, 1996
-2-
TABLE OF CONTENTS
1. INTRODUCTION
1.1 New Capabilities for S and S-PLUS Graphics
1.2 A Simple Scatterplot: Ethanol Data
1.3 Conditioning on Numeric Variables: Ethanol Data
1.4 Conditioning on Factors: Barley Data
1.5 Other Examples
2. HOW TO USE TRELLIS SOFTWARE
2.1 Display Functions
2.2 Customization for Devices
2.3 Panel Functions
2.4 Formulas
2.5 Trellis Objects
2.6 Layout
2.7 Axes
2.8 Aspect Ratio
2.9 Data Structures
2.10 Labeling (Titles, Strip Labels, Keys)
3. ADVANCED CONCEPTS
3.1 Prepanel Functions
3.2 The subscripts= Argument
3.3 Device Settings
3.4 Finding the Data
4. HIGHER DIMENSIONS
4.1 3-D Plotting
4.2 Contour Plots
4.3 More Than Three Variables
5. A GRAB BAG
-31. INTRODUCTION
Trellis displays are plots which contain one or more panels, arranged in a regular grid-like
structure (a trellis). Each panel graphs a subset of the data. All panels in a Trellis display contain
the same type of graph but these graphs are general enough to encompass a wide variety of 2-D
and 3-D displays: histogram, scatter plot, dot plot, contour plot, wireframe, 3-D point cloud and
more. The data subsets are chosen in a regular manner, conditioning on continuous or discrete
variables in the data, thus providing a coordinated series of views of high-dimensional data.
This document leads you through Trellis graphics: it shows the functions in the Trellis
library, it describes the common arguments that the functions share, and shows how Trellis displays are customized for various graphical devices. Other information is available about Trellis,
including a user’s manual and a journal article with data analysis examples. To find these and
more, refer to the Trellis web page:
http://netlib.att.com/projects/trellis/
1.1 New Capabilities for S and S-PLUS Graphics
Graphics have always been a strong feature of S and S-PLUS (the commercial version of S,
distributed by MathSoft). Its graphics provide device independence, high-level plotting functions
that produce an entire display, low-level functions to augment existing displays or build new
ones, and a collection of graphical parameters that provide a wide range of control over the details
of plotting.
Graphical parameters in S provide the ability to produce several plots on a single page.
However, producing a coordinated set of plots on a page, with control over aspect ratios and axes,
has always taken more knowledge of the graphical functions than even a proficient user is likely
to possess. In addition, graphics devices may vary in their capabilities, thus requiring adaptations
in order to produce the best plot on each device.
The Trellis library is designed to remedy this situation. Besides providing a straightforward
way to produce multiple panels on a single page, it also sets up a unifying framework for doing
this. Trellis displays extend S graphics to handle multivariate data situations by using a powerful
and general technique, conditioning. In addition, the Trellis software does an excellent job with
single panel displays, making it a suitable vehicle for doing most high-level graphics in S.
While improving user control of graphics, the Trellis software also makes graphics functions behave just like any other S functions. The result of executing a Trellis expression is a Trellis object. Unless it is assigned a name or used in a further computation, the Trellis object is displayed.
The Trellis library is now distributed as a standard part of S-PLUS. (Hold onto your hats,
jargon to follow!) S-PLUS prior to version 3.3 does not come with the Trellis library. In the PC
environment, S-PLUS for Windows, Version 3.3 (and presumably anything later) comes with
Trellis Version 2.0, as described in this document. Under the Unix operating system, S-PLUS
Version 3.3 contains a slightly older version of Trellis. The next release, due in 1996, is scheduled to contain Trellis Version 2.0.
1.2 A Simple Scatterplot: Ethanol Data
Perhaps the easiest way to introduce Trellis displays is by examples. They illustrate the
variety of Trellis displays that can be produced and also introduce the way that Trellis displays
are controlled. This document gives an entry point to use of the software and explains common
features. It does not have the space to explain, except in the most cursory way, the meaning or
use of the graphical techniques. To find out much more about how to use Trellis displays to
-4understand data, read Visualizing Data by William S. Cleveland (1993).
Although Trellis graphics functions are capable of producing multiple panel displays, they
are also excellent at doing basic single-panel graphs. For this example, we will use data from an
experiment involving 88 trials of an engine running an ethanol mixture, contained in the data
frame ethanol. There are three variables: emissions of oxides of nitrogen, NOx, equivalence
ratio (a measure of the richness of the fuel/air mixture), E, and five values of compression ratio, C.
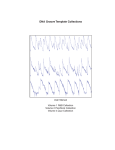
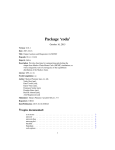
We can use the scatterplot function xyplot on the ethanol data to produce a simple scatterplot:
xyplot(NOx ˜ E, data = ethanol)
# Figure 1
4
NOx
3
2
1
0.6
0.8
1.0
1.2
E
Figure 1. A simple scatterplot of the engine data, showing NOx emissions as a function of equivalence ratio.
The first argument to xyplot and to most Trellis functions is a formula and the second tells
where the data in the formula can be found. Both of these kinds of arguments were introduced in
the book Statistical Models in S by Chambers & Hastie (1992). We have used this same paradigm for Trellis graphics.
1.3 Conditioning on Numeric Variables: Ethanol Data
A simple modification of the previous call to xyplot produces a multi-panel display:
xyplot(NOx ˜ E | C, data = ethanol)
# Figure 2
This produces Figure 2, which shows NOx emissions plotted against equivalence ratio, each panel
showing data for one of the five values of compression ratio.
The Trellis display consists of 5 panels, each showing NOx on the vertical axis and E on the
-5-
C
4
3
2
1
0.6
C
0.8
1.0
1.2
C
4
NOx
3
2
1
C
C
4
3
2
1
0.6
0.8
1.0
1.2
E
Figure 2. A Trellis display of engine emissions data.
horizontal axis. The value of C is shown by the strip label at the top of each panel; in this case, C
takes on 5 discrete values as shown by the darkly-shaded region of the strip label atop each panel.
The formula,
NOx ˜ E | C
is read aloud as “NOx is plotted against E given C”. Note that the variable that goes on the vertical
axis is mentioned first in the formula — conventionally the dependent variable is plotted on the
vertical axis; the variable for the horizontal axis is given after the “ ˜ ” operator, and given or
conditioning variables are mentioned last.
The data = ethanol tells xyplot to look first in the data frame ethanol for the objects
NOx, E, and C in the formula. A data frame contains a set of related vectors and can be operated
upon as if it were a matrix; however, data frames can hold data of various types, including
-6character and numeric vectors, factors, and shingles. Data mentioned in a formula can come from
anywhere on the S search list. However, data frames are often a convenient way to keep related
vectors together.
Suppose that we would like to control the layout of the five panels in Figure 2. We can do
that with the layout= argument:
xyplot(NOx ˜ E | C, data = ethanol, layout = c(3,2,1))
# Figure 3
This produces a layout with 3 columns and 2 rows on 1 page. Notice that layout specifies
columns and then rows, unlike matrix (row, column) notation. We do this because we are dealing
with graphs, and the convention with graphs is to have an origin in the lower left corner. We start
there and proceed left to right, bottom to top, page to page. The number of panels to be produced
in a Trellis display is determined by the number of levels in the given variables. However, if the
layout argument allows less room than required for all of the panels, only the panels that will fit
are produced. For example, using layout=c(2,2,1) with this example would produce just one
page with 4 panels.
0.6
C
0.8
1.0
1.2
C
4
3
2
NOx
1
C
C
C
4
3
2
1
0.6
0.8
1.0
1.2
0.6
0.8
1.0
1.2
E
Figure 3. The engine data with layout=c(3,2,1).
We have conditioned on compression ratio, a variable that has only 5 levels.
> sort(unique(ethanol$C))
[1] 7.5 9.0 12.0 15.0 18.0
Suppose we want to see how NOx concentrations depend on C for various values of E. It won’t
work to condition on E, since there are 83 unique values of E for the 88 observations. However,
we can do something similar by conditioning on intervals of E. The function equal.count constructs a data structure called a shingle from our data, with a specified number of intervals and a
specified amount of overlap from one interval to another. For example,
EE <- equal.count(ethanol$E, number = 9, overlap = 1/4)
constructs a shingle with 9 intervals spanning the range of E, each containing approximately the
-7same number of observations, and each having about 25% of its points in common with the each
of its two adjacent intervals.
> EE
Data:
[1] 0.907
[13] 1.138
[25] 1.175
[37] 0.868
[49] 0.765
[61] 0.749
[73] 0.694
[85] 0.584
0.761
0.601
0.568
0.762
0.878
0.892
0.816
0.562
1.108
0.696
0.977
1.144
0.811
1.002
1.037
0.535
1.016
0.686
0.767
1.045
0.676
0.812
1.181
0.655
1.189
1.072
1.006
0.797
1.045
1.230
0.899
1.001
1.074
0.893
1.115
0.968
0.804
1.227
1.231
0.934
1.152
1.070
0.846
0.813
1.180
1.123
0.808
0.693
1.219
0.684
1.002
0.795
1.042
1.071
1.232
0.637
0.729
0.696
0.990
1.215
1.009
1.036
0.733
0.911
1.199
1.201
0.930
1.142
1.125
0.715
0.808
1.030
0.629
1.152
1.229
1.081
0.872
1.168
0.602
0.608
Intervals:
min
max count
0.535 0.686
13
0.655 0.761
13
0.733 0.811
12
0.808 0.899
13
0.892 1.002
13
0.990 1.045
13
1.042 1.125
12
1.115 1.189
13
1.175 1.232
13
Overlap between adjacent intervals:
[1] 4 3 3 3 4 3 3 4
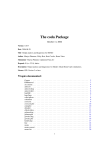
We can see the intervals graphically by using the plot function on a shingle:
plot(EE, xlab="Range of E", ylab="Interval")
# Figure 4
9
8
7
Interval
6
5
4
3
2
1
0.6
0.8
1.0
1.2
Range of E
Figure 4. A plot of the shingle with 9 equal-count intervals constructed from the engine data.
Now that we have a set of intervals, we can use them to produce conditional scatterplots of
NOx vs. C for the various ranges of E:
xyplot(NOx ˜ C | EE, data = ethanol, aspect = 2)
# Figure 5
We made the panels tall by specifying aspect=2 in the call. (The reason for this will be made
clear later.)
-8-
8
EE
10
12
14
16
18
8
EE
EE
10
12
14
16
18
EE
4
3
2
NOx
1
EE
EE
EE
EE
EE
4
3
2
1
8
10
12
14
16
18
8
10
12
14
16
18
8
10
12
14
16
18
C
Figure 5. Scatterplots show NOx emissions as a function of compression ratio for various values
of equivalence ratio.
Suppose that for some reason we wanted to recreate Figure 2, but to show it only for compression ratios greater than 8. One way to do this would be
ii <- ethanol$C > 8
xyplot(NOx[ii] ˜ E[ii] | C[ii], data = ethanol)
another possibility would be:
xyplot(NOx ˜ E | C, data = ethanol[ethanol$C>8, ])
but an easier version can be accomplished using the subset= argument:
xyplot(NOx ˜ E | C, data = ethanol, subset = C > 8)
# Figure 6
In complicated expressions, subset= can save you from lots of subscripting and also allows you
to refer to components of a data frame by name. In addition, using subset= causes an automatic
operation on all factors used in the formula, to drop any levels that have no data associated with
them. The next section describes how factors are handled in Trellis displays.
1.4 Conditioning on Factors: Barley Data
Let’s leave the engine example and go on to something else, this time involving more than
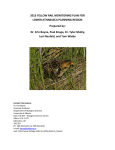
one conditioning variable and a dotplot rather than a scatterplot. The data frame barley
describes the yield in bushels per acre of 10 varieties of barley, harvested at 6 sites in 2 different
years. The expression
dotplot(variety ˜ yield | year * site,
# Figure 7
data = barley,
xlab = "Barley Yield (bushels/acre)")
-9-
0.6
C
0.8
1.0
1.2
C
4
3
2
NOx
1
C
C
4
3
2
1
0.6
0.8
1.0
1.2
E
Figure 6. Engine emissions data for compression ratios larger than 8.
produces Figure 7. See Cleveland (1993) for a thorough analysis of the barley data.
1.5 Other Examples
We have reached the end of this introductory section and you should now have some familiarity with Trellis displays and how they are produced. However, there is no way in a document
as short as this that we can do more than hint at the variety of displays you can produce with Trellis expressions. One way for you to get more experience is to explore the functions whose names
start with example in the Trellis library. Execute
help(example.bwplot)
to get a full list. For example, you can execute
example.bwplot()
to produce a Trellis box-and-whisker display (boxplot) and execute
example.bwplot
to print the function so you can understand how the display is created.
2. HOW TO USE TRELLIS SOFTWARE
The previous section showed a few examples of Trellis displays and how they are specified
and controlled in S. The purpose of this section is to give a broader look at the Trellis graphics
software.
In general, Trellis displays consist of one or more panels, arranged in a regular grid-like
structure of columns, rows, and pages. Simple displays are usually easy to create; multi-panel
displays take little more effort. A wide range of graphs can be drawn inside each panel, although
all panels in a particular Trellis display must be alike. Each panel displays a subset of the data,
determined by the values of the given variables.
The Trellis software is structured so that there is one piece of software, the Trellis print
method, that takes Trellis objects and produces all types of displays. It advances from panel to
panel, sets up axes, computes appropriate aspect ratios, and generates overall labels. The print
method calls a panel function once per panel to draw the graph inside the panel. This decoupling
of the overall setup and panel drawing provides much of the power to the Trellis software. We
- 10 -
20
30
40
Waseca
1932
•
Trebi
Wisconsin No. 38
No. 457
Glabron
Peatland
Velvet
No. 475
Manchuria
No. 462
Svansota
•
•
•
•
•
•
•
•
Crookston
1932
•
•
•
•
•
•
•
•
•
Morris
1932
Trebi
Wisconsin No. 38
No. 457
Glabron
Peatland
Velvet
No. 475
Manchuria
No. 462
Svansota
•
•
•
•
•
•
•
•
•
•
•
•
•
•
•
•
Trebi
Wisconsin No. 38
No. 457
Glabron
Peatland
Velvet
No. 475
Manchuria
No. 462
Svansota
Trebi
Wisconsin No. 38
No. 457
Glabron
Peatland
Velvet
No. 475
Manchuria
No. 462
Svansota
•
•
•
•
•
•
•
•
•
•
•
•
•
20
•
•
•
•
•
•
Grand Rapids
1932
•
•
•
•
•
30
40
50
•
•
•
•
•
Duluth
1931
Grand Rapids
1931
•
•
•
•
•
•
•
•
•
•
Duluth
1932
•
•
•
•
•
•
•
•
•
University Farm
1931
•
•
•
•
•
•
•
•
•
•
•
•
•
•
•
•
•
•
•
•
•
•
•
•
•
•
•
•
Morris
1931
University Farm
1932
Trebi
Wisconsin No. 38
No. 457
Glabron
Peatland
Velvet
No. 475
Manchuria
No. 462
Svansota
•
•
•
Crookston
1931
•
•
60
•
•
•
Trebi
Wisconsin No. 38
No. 457
Glabron
Peatland
Velvet
No. 475
Manchuria
No. 462
Svansota
50
Waseca
1931
•
•
60
Barley Yield (bushels/acre)
Figure 7. A dotplot shows how the yield of 10 varieties of barley varied over 6 sites and 2 years.
Notice that the 1931 yields were generally higher than 1932 except at the Morris site (a likely data
transcription error).
- 11 supply panel functions for doing many kinds of Trellis displays, but you always have the option
to write a custom panel function to draw just the right thing in each panel.
2.1 Display Functions
The Trellis graphics software comes with many display functions that produce various types
of complete graphs. One way of classifying the display functions is according to the dimensionality of the incoming data. Here’s a list:
_____________________________________________________________________
Table 1: Trellis Display Functions
Data Type
Function
Type of Plot
_____________________________________________________________________
Univariate
barchart
bar plots
bwplot
box and whisker plots
densityplot
kernel density plot
dotplot
dot plots
histogram
histograms
piechart
pie charts (yuck!)
qqmath
quantile plots against mathematical distribution
stripplot
1-dimensional scatter plot
qq
qq-plot for comparing two distributions
Bivariate
timeplot
time series plot
xyplot
scatter plot
Trivariate
contourplot
contour plot
levelplot
level plots
splom
scatterplot matrix
Hypervariate
parallel
parallel coordinate plots
wireframe
function as a wire frame
3-D Displays
_____________________________________________________________________
cloud
3-dimensional point cloud
2.2 Customization for Devices
Trellis displays are adapted to different graphical devices by the trellis.device function. When you are using Trellis graphics on your personal computer or workstation, you normally use trellis.device implicitly: when the first Trellis object is printed,
trellis.device is called automatically to produce a window in which to display the graph. If
you are running Windows, the win.graph function is invoked, and if you are on a workstation
running the Unix operating system, the motif device function is executed.
However, there may be times when you will want to run trellis.device explicitly. For
example, executing
trellis.device(postscript, file = "output.ps", color = TRUE)
will direct any further Trellis graphics to the postscript device function, leaving the file
output.ps filled with PostScript language commands. This file can then be sent to a printer
or included in documents. The color=TRUE argument says that your output should be done in
color. For a black and white printer, use color=FALSE.
Another reason why you may want to execute trellis.device explicitly is that you can
use it in S-Plus to display multiple windows on one screen or you can set up an on-screen device
in addition to a hardcopy device.
Not only does trellis.device set up the device, but it also initializes a list that controls
graph characteristics such as plotting characters, line types, and colors. Gray scales and different
- 12 line styles and symbol types are used in the black and white version to distinguish areas, lines,
and points. If color is available, the Trellis color scheme is used. It is designed to provide good
discrimination amongst a fairly large group of colors. This is necessary because Trellis displays
are often concerned with multivariate situations. The colors are also chosen to be relatively
robust across various graphics devices, screens and hardcopy—they are simple mixtures of the
cyan, magenta, and yellow printing primaries. The background and basic annotations are done
monochromatically to contrast with the color assigned to data-based graphics. Black text is used
because it is available on all devices and stands out well on white, gray, and color.
For hardcopy devices (e.g. those that support PostScript), the background color will be the
white of the paper; on a computer screen, the background color is light gray because white is too
harsh and tends to hide light colors. The colors used are those that empirically offer good discrimination and are not difficult for the device. In particular, text is drawn in black and the colors
cyan, magenta, green, orange, blue, yellow, and red are employed for various groups. The function show.settings gives a graphical display of the Trellis color (and other) parameter settings.
See section 3.3 for an example plot and more details about device settings.
2.3 Panel Functions
Panel functions lie at the heart of Trellis displays. When any Trellis display function is executed, common code parses the formula, gets the data, and returns a Trellis object. If the object is
“printed”, the print method, print.trellis, sets up the coordinate system, constructs appropriate axes, and then produces the panels, one by one. When the panel function is called, it is provided with two arguments, x and y, giving the horizontal and vertical coordinates of what should
be plotted. The data passed to the panel function consists of subsets of the independent and
dependent variables, the subsets determined by appropriate values of the given variables.
There is a default panel function for each of the high-level Trellis functions; the name is
constructed by gluing "panel." onto the name of the Trellis function. Thus panel.xyplot
corresponds to the xyplot function. Many of these functions are simple, basically a call to a
plotting routine like points or lines with a few graphical parameters specified to mesh with
the Trellis graphics customization rules (see section 3.3, “Device Settings”).
When a panel function is called, the Trellis code has already set up a coordinate system
(based upon data values, and arguments xlim=, ylim=, and scales=). It has also extracted,
from the entire collection of data, the data to be displayed upon the panel, the extraction based on
the levels of the given variables. The panel function is passed arguments x and y, the coordinates
for the points on the current panel. (If no points belong on the panel, the panel function is not
called.)
The panel function is passed in as an argument to a high-level Trellis function, perhaps as
an object (panel.xyplot), as a character string ("panel.xyplot"), or constructed on the fly
in the argument list (function(x,y) { ... }).
Any arguments given to the top-level Trellis function but not recognized by it are passed,
unchanged, down to the panel function. This can be a useful way of communicating extra information to the panel function, and is often used in conjunction with simple graphical parameters,
like col= or cex=.
Because Trellis displays may take up many pages, the paradigm of producing a plot and
then adding to it, will not work. (This was often the way things were done prior to Trellis graphics). However, the panel function can do something similar. This is relatively easy because panel
functions have a nice synergy with the ability to define functions. For example, suppose you
want panels with points and a smooth line. You can do this easily by combining two existing
panel functions into one:
- 13 xyplot(NOx ˜ E | C, data = ethanol, # Figure 8
panel = function(x,y){
panel.xyplot(x,y) # plot points
panel.loess(x,y)
# add smooth line
}
)
C
4
3
2
1
0.6
C
0.8
1.0
1.2
C
4
NOx
3
2
1
C
C
4
3
2
1
0.6
0.8
1.0
1.2
E
Figure 8. A Trellis display of engine emissions data. The smooth line was put on by the in-line
panel function.
The previous example used two panel functions that come with the Trellis software:
panel.xyplot and panel.loess. As described earlier, panel.xyplot is the default panel
function for xyplot. The panel.loess function is one of a group of functions that are useful
in constructing panel functions. This group includes: panel.abline, panel.fill,
panel.grid, panel.lmline, panel.loess, and panel.qqmathline.
The panel.abline function plots one or more lines on the panel. The lines can be
- 14 horizontal, vertical, or the result of a linear fit expressed in the form y = a + b * x. The function uses Trellis line style conventions and will not generate warning messages if any of the lines
fail to intersect the plot.
The function panel.fill is used to fill in the entire panel with a suitable color or gray
level. Aside from making pretty colored panels, it also allows further plotting on the panel in the
background color, col=0. For example, if you are on a device with a white background, you can
fill each panel with gray and later use panel.grid(col=0) to draw a reference grid on top in
white. The panel.grid function is designed to put a reference grid on each panel, to enhance
the visual comparisons from one panel to another. It should generally be the first thing drawn on
a panel (after panel.fill, though), so that the reference grid will not obscure any important
information. Arguments control how many grid lines are used:
panel.grid(h=-1, v=4)
draws a horizontal grid aligned with the vertical axis ticks and places 4 vertical reference lines on
the panel. Although conventional plots often have grids aligned with axes, there is no need for
this. In many cases the grid is not there to help the viewer read-off numeric values — it provides
reference lines against which patterns can be compared.
Functions panel.lmline and panel.qqmathline are designed to put fitted lines on the
panel. The former draws a line fit with least-squares; the latter does a robust fit to a theoretical
quantile plot.
As illustrated in Figure 7, the panel.loess function adds a smooth curve using the nonparametric loess procedure; various arguments to loess can be supplied.
The panel.superpose function is often used as a replacement for panel.xyplot when
each panel is intended to contain multiple lines or points based upon the values of a grouping
variable. The high-level function is given an argument, groups=, that specifies the grouping
variable (as a factor or something that will be coerced to a factor). This groups argument will be
passed down to panel.superpose to control the plotting symbols and colors used to display
the specified groups. Examples using panel.superpose appear later in Figures 20 and 21.
One important thing to remember about the Trellis software — everything is written in the
S/S-PLUS language. This means that you can read it and modify it. The panel functions are
intended as the place for users to customize their plots, so they are generally short and easy to
understand and modify. However, all of the Trellis functions are accessible and can often be
understood with a little bit of work. In any case, the point is that you should not be deterred if the
Trellis software doesn’t do exactly what you want — you can change it yourself.
2.4 Formulas
The formula argument for Trellis functions often comes in the form:
y ˜ x | g1 * g2 ...
Here, x, y, and the g variables are S objects or S function calls. The y variable describes the variable plotted on the vertical axis. In many cases, both the x and y variables are numeric, as in the
examples of the xyplot function that produced Figure 1. However, for the univariate display
functions such as bwplot, the y variable is treated as a factor (and is made into one if it isn’t a
factor already). For example, Figure 9 is produced from:
bwplot(voice.part ˜ height, data = singer,
xlab="Height (inches)")
# Figure 9
Notice that in producing Figure 9, we have not used any given variables, hence the Trellis display
consists of only one panel.
When given variables are used in a formula, they are handled as factors or shingles. If a
- 15 -
Soprano 1
Soprano 2
Alto 1
Alto 2
Tenor 1
Tenor 2
Bass 1
Bass 2
60
65
70
75
Height (inches)
Figure 9. A box and whisker plot showing heights of members of a choral group, arranged according to the part they sing.
given variable is a character vector, it is automatically turned into a factor (with the sorted, unique
values of the vector as the factor’s levels); if it is numeric, it is turned into a shingle (with zerowidth intervals at the unique values of the numeric variable; in this case, it may be better to create
a shingle yourself, perhaps by using the equal.count function, so that you can control the intervals chosen.)
Certain Trellis functions take slightly different kinds of formulas. Univariate functions that
produce a whole panel from one set of data omit the y variable and have a formula like
˜ x | g1 * g2
A rationale for this is that, for example, a histogram plots the data values along the x-axis and
internally computes the y values that determine the heights of the bars. So, Figure 10 is produced
from:
histogram(˜ height|voice.part, data = singer,
xlab="Height (inches)")
# Figure 10
In Figure 10, each value of the given variable has produced a separate panel. This is a general
principle: the x and y variables to the left of the vertical bar in a formula make up each panel and
the given variables cause multiple panels to be produced.
The function qq takes a simple formula
y ˜ x | g1 * g2 * ...
where the numeric response x is split into exactly two groups by the y variable. The resulting
panels each show a quantile-quantile plot of the data from one group against the data from the
other group.
The function qqmath produces quantile plots. Its formula is:
˜ x | g1 * g2
It also takes an argument, distribution, that specifies a quantile function — a function of a
vector of probabilities that produces a set of quantiles. The quantile function is often a standard
- 16 -
60
Alto 2
65
70
75
60
Alto 1
65
Soprano 2
70
75
Soprano 1
40
30
Percent of Total
20
10
0
Bass 2
Bass 1
Tenor 2
Tenor 1
40
30
20
10
0
60
65
70
75
60
65
70
75
Height (inches)
Figure 10. Histograms of singer heights by voice part.
reference distribution, qnorm (to compare the y data to the normal distribution) or qunif (to
compare to a uniform distribution). As an example, we can see how the heights of singers within
voice part compare to a normal distribution:
qqmath(˜ height | voice.part, distribution = qnorm,
data = singer)
# Figure 11
The plot of Figure 11 could be improved, perhaps by adding a reference line and grid to make it
easier to assess the quality of the fit and by adding a nicer x-label. The plots might also look better if they were made square (later, we can see if there is an even better aspect ratio). This is
accomplished in Figure 12, produced by:
qqmath(˜ height | voice.part, distribution = qnorm, # Figure 12
data = singer,
aspect = 1,
prepanel = prepanel.qqmathline,
panel = function(x, y, ...) {
panel.grid()
panel.qqmathline(y, distribution=qnorm, ...)
panel.qqmath(x, y, ...)
},
xlab = "Unit Normal Quantile"
)
The prepanel function will be described later, in the “ADVANCED CONCEPTS” section.
Suppose we thought that the square roots of the singer heights, rather than the raw values,
were more appropriate to compare to a normal distribution. We could have used the sqrt function inside the formula:
qqmath(˜ sqrt(height) | voice.part, distribution = qnorm, data = singer,
...
Functions and other S expressions can be used inside the formula. However, one disadvantage of
using complicated expressions inside the formula is that the default labels are also more complicated and can therefore be more difficult to read. This is especially true for strip labels. An alternative, especially if you are using equal.count to generate shingles for given variables, is to
- 17 -
-2
Alto 2
-1
0
1
2
-2
Alto 1
Soprano 2
-1
0
1
2
Soprano 1
75
70
height
65
60
Bass 2
Bass 1
Tenor 2
Tenor 1
75
70
65
60
-2
-1
0
1
2
-2
-1
0
1
2
qnorm
Figure 11. Singer heights within voice part compared to theoretical quantiles from a normal distribution.
create a new object with a nice-looking name (the variable’s name is used in labeling shingles)
prior to calling the S function.
The contourplot and wireframe functions also take a different sort of formula. Since
these plots are constructed from 3-D data, the formula is
z ˜ x * y | g1 * g2 ...
Here, x, y, and z are numeric vectors and x and y are evaluated on a regular grid. For example,
the z values may represent a surface evaluated at 60 points, made up from 6 unique x values and
10 unique y values. If given variables are present, there should be a regular surface of data for
each unique combination of values of the given variables, although the x and y values need not be
the same for each surface. (For an example, see section 4.1, “3-D PLOTTING”.)
2.5 Trellis Objects
All of the high-level Trellis functions (those listed in Table 1) return an object of class
trellis as their value. These objects are ordinarily plotted straight away, because the print
method for this class, print.trellis actually plots the objects. However, the fact that Trellis
functions return objects means that those objects can be stored and replotted later, perhaps when a
different device is active. For example, in S
NOxplot <- xyplot(NOx ˜ E | C, data = ethanol) # save result (no plotting)
trellis.device(iris4d) # graphics on the workstation
NOxplot # now plot it
trellis.device(postscript) # change devices
NOxplot # plot it again for new device
- 18 -
-2
Alto 2
-1
0
1
2
-2
Alto 1
Soprano 2
-1
0
1
2
Soprano 1
75
70
65
height
60
Bass 2
Bass 1
Tenor 2
Tenor 1
75
70
65
60
-2
-1
0
1
2
-2
-1
0
1
2
Unit Normal Quantile
Figure 12. An improved version of the singer heights data with a comparison to the normal distribution.
S-Plus users have slightly different device functions and can have several functions active at
once. Refer to the Trellis Graphics User’s Manual MathSoft (1995), for more details.
It is sometimes useful to call print.trellis directly, because it has several arguments
that can be used to position Trellis plots on a page. Suppose, for example, that you have two
Trellis objects, obj1 and obj2 and would like to position them one above the other on a single
page of output. If the two objects were identical in type, both scatterplots, for example, it might
have been easier to use xyplot with a made-up given variable to do this. However, suppose
obj1 is a multi-panel Trellis display and obj2 is a single display of a different type.
Let’s be more concrete. Let
obj1 <- qqmath(˜ sqrt(height) | voice.part, distribution = qnorm,
data = singer, ...)
obj2 <- histogram(˜ height, data = singer)
and now combine them using print.trellis:
print.trellis(obj1, split=c(1,2,1,2), more=TRUE)
print.trellis(obj2, split=c(1,1,1,2), more=FALSE)
# Figure 13
The split argument to print.trellis is a vector of length 4, c(x,y,nx,ny) saying to use
the x,y position of an nx by ny rectangular layout. The more= argument tells whether more
plotting is to be done on the same page.
As some of our examples have shown, the description of some Trellis displays (through
arguments to the high-level Trellis function) may take several lines. Suppose you are producing
Trellis displays and are trying to adjust things to come up with just the right look. One way to do
- 19 -
-2
Alto 2
-1
0
1
2
-2
Alto 1
Soprano 2
-1
0
1
2
Soprano 1
75
70
height
65
60
Bass 2
Bass 1
Tenor 2
Tenor 1
75
70
65
60
-2
-1
0
1
2
-2
-1
0
1
2
Unit Normal Quantile
Percent of Total
15
10
5
0
60
65
70
75
height
Figure 13. Two different Trellis displays on a single “page”, positioned by print.trellis.
this is to store the expression in a file, use your favorite editor to change the file, and then use
source to execute the expression in the file. One thing to note about this plan: automatic printing of results is not done within a source file, so you should surround your expression with
print(), for example, put the expression
print( xyplot(NOx ˜ E | C, data = ethanol) )
in file foo and execute
source("foo")
An alternative is to create a Trellis object and then modify and redisplay it with the update
function.
NOxplot <- xyplot(NOx ˜ E | C, data = ethanol)
NOxplot # display it
- 20 update(NOxplot, layout=c(3,2)) # display with new layout
NOxplot2 <- update(NOxplot, pch="X") # change plotting character
NOxplot2 # display it
You can also save the result of update and update that.
2.6 Layout
The formula given to a Trellis display determines the order in which subsets of the data are
produced. The first packet of Trellis data corresponds to the first level of each of the given variables (or the first interval of a shingle). The second packet is at the second level of the first given
variable and the first level of each of the other given variables. This goes on until the last level of
the first given variable. Next, the second level of the second given variable is reached and all
other variables go to their first level. All of the data packets are produced in this way. This determines the packet order. If there are N1, N2, and N3 levels for 3 given variables, then there will be
a total of N1*N2*N3 packets.
How does this relate to the layout of panels on the page? The page is divided into columns
and rows as specified by the layout= argument. The panel order is defined so that the first
panel begins at the lower left corner and successive panels fill the bottom row. Next, panels fill
the second row from left to right. The total number of panels in the panel order is determined by
the layout specification. Remember that Trellis displays are filled as graphs, from the origin in
the lower left, not top-down as in a table. That is also why the number of horizontal panels
(columns) precedes the number of vertical panels (rows) in the layout specification.
When it comes time to display a Trellis graph, the packets and panels are associated with
one another: the first packet (in the packet order) goes into the first panel (in panel order), and so
on.
The important concept is that the packets are produced in packet order, and the panels, in
panel order, are filled by those packets.
If you do not specify the layout= argument yourself, it has defaults that depend on how
many given variables are in the formula. For one given variable, the default layout is chosen by a
layout optimization algorithm. It chooses the number of rows and columns to maximize the page
area devoted to the panels, taking into account the aspect ratio of the panels, the size of the device
and the size of the strip labels. For two or more given variables, the default number of columns is
determined by the number of levels of the first given variable, the rows by the second given variable, and the rest of the given variables vary across pages.
There is also a way to have the layout optimization algorithm assist you with 2 or more
given variables. If you specify a layout argument of the form layout=c(0,n), the optimization
is carried out for n plots per page.
Occasionally, the layout of a Trellis display may be problematic. For example, suppose you
have two factors, one with 14 levels and another with 10 and would like to have 3 columns and 5
rows on each page for 10 pages. If you use layout=c(3,5) the result will not be satisfactory,
because there will be 15 panels on a page, so the arrangement of factor levels will not be consistent from page to page. Things would be better if you could have 14 panels on the page, but 7 by
2 or 2 by 7 layouts cause the panels to be too tall or fat. You can solve the problem by using the
3 by 5 layout along with the skip= argument to skip the center panel or perhaps the upper right
panel, when panels are traversed in panel order. The skip= argument is a logical vector that
tells, for each panel on a page, whether it should be skipped. The skip vector is replicated as
necessary and can even be longer than the number of panels on a page, so that complicated
multi-page skip patterns can be expressed. For example, the combination of
layout=c(3,5),skip=c(rep(F,14),T)
- 21 would skip the upper right hand panel and
layout=c(3,5),skip=c(rep(F,7),T,rep(F,7))
would skip the middle panel.
Another similar situation might involve two given factors, A and B, with 5 and 2 levels
respectively. As an exercise, consider how you could use skip to get 3 columns and 4 rows on a
page filled out reasonably.
Sometimes, the interaction of the page size and the number of factor levels can make a nice
layout difficult. Consider a plot of a fit to the ozone data where ozone is plotted as a function of
radiation for 6 levels each of temperature and wind speed.
xyplot(env.fit ˜ radiation | temperature * wind,
data = twr.grid,
panel = function(x,y) {
panel.grid(h = 2)
panel.xyplot(x, y, type = "l")
},
aspect = "xy",
xlab = "Radiation (langleys)",
ylab = "Cube Root Ozone (cube root ppb)")
# Figure 14
The plot has an aspect ratio chosen by the slope of the lines in the panels and these banking computations (described in section 2.7, “Axes”) make it tall and thin.
Suppose we needed to show this data on a landscape-oriented piece of paper or on a display
screen that was wider than high. How could we do this, preserve aspect ratios, and still make
good use of the display area? Rather than a display with 6 rows and 6 columns, we display the
panels in a layout with 12 columns and 3 rows, something that will fit the page quite well. The
trick to doing this is to reorder the levels of the second given variable, wind.
Why does this work? Think of how the layout argument interacts with the levels of the
given variable; in other words, think of the interaction between panel order and packet order.
Trellis cycles through levels of the first given variable, temperature for the first level of the
second given variable, wind. This uses 6 panels, starting from the lower left of the display and
going horizontally. There are still 6 panels left in the bottom row, and those are taken up by 6 the
temperature values and the second level of wind. We have reordered the levels of wind so
that the resulting plot appears to be organized into a left half and a right half.
wlevels <- seq(4, 16, length = 6)[c(1,4,2,5,3,6)]
# Figure 15
strip.shingle <- trellis.par.get("strip.background")
xyplot(env.fit ˜ radiation | temperature * shingle(wind,wlevels),
data = twr.grid,
layout = c(12,3),
between = list(x=c(0,0,0,0,0,1)),
strip = function(...)strip.default(...,strip.names=FALSE),
key = list(
text = list(c("wind","temperature")),
rectangle=Rows(strip.shingle,2:1),
space="Top"
),
panel = function(x,y) {
panel.grid(h = 2)
panel.xyplot(x, y, type = "l")
},
aspect = "xy",
xlab = "Radiation (langleys)",
ylab = "Cube Root Ozone (cube root ppb)")
You may find the panel order in Trellis displays somewhat peculiar, particularly the part
about the rows of panels being filled from bottom to top. The reason for this is that the vertical
- 22 -
0
250
0
250
0
250
Cube Root Ozone (cube root ppb)
wind wind wind wind wind wind
mperatu
mperatu
mperatu
mperatu
mperatu
mperatu
5.0
4.5
4.0
3.5
3.0
2.5
2.0
wind wind wind wind wind wind
mperatu
mperatu
mperatu
mperatu
mperatu
mperatu
wind wind wind wind wind wind
mperatu
mperatu
mperatu
mperatu
mperatu
mperatu
5.0
4.5
4.0
3.5
3.0
2.5
2.0
5.0
4.5
4.0
3.5
3.0
2.5
2.0
wind wind wind wind wind wind
mperatu
mperatu
mperatu
mperatu
mperatu
mperatu
wind wind wind wind wind wind
mperatu
mperatu
mperatu
mperatu
mperatu
mperatu
5.0
4.5
4.0
3.5
3.0
2.5
2.0
5.0
4.5
4.0
3.5
3.0
2.5
2.0
5.0
4.5
4.0
3.5
3.0
2.5
2.0
wind wind wind wind wind wind
mperatu
mperatu
mperatu
mperatu
mperatu
mperatu
0
250
0
250
0
250
Radiation (langleys)
Figure 14. Loess fit to the ozone data with aspect ratio chosen by banking computations.
axis of a graph generally increases from bottom to top, and if given variables have their levels in
increasing order, the standard Trellis panel order will make the given variables increase from bottom to top. That said, there are occasions when a top-to-bottom order might be convenient. This
is called table order, left-to-right top-to-bottom, and is specified by using as.table=TRUE as an
argument to a high-level Trellis function. For an example, see the function example.calendar.
Notice that the plot of Figure 17 contains a key that allows the reader to see how the shingle
colors correspond to the given variables. (Also, for those of you who are looking carefully, the
rectangle parameters given to key are done in reverse order, since key draws things top to bottom
while strip labels are constructed bottom to top!) The in-line strip= function was used to suppress the strip names. Also, the between= argument allows us to insert space (in units of characters) between panels in the x- or y- direction; we used it to distinguish between the two major levels of wind speed.
- 23 -
wind
temperature
0 100
250
0
100
250
0 100
250
0 100
250
0
100
250
0 100
250
5.0
4.5
4.0
3.5
Cube Root Ozone (cube root ppb)
3.0
2.5
2.0
5.0
4.5
4.0
3.5
3.0
2.5
2.0
5.0
4.5
4.0
3.5
3.0
2.5
2.0
0 100
250
0
100
250
0 100
250
0
100
250
0 100
250
0
100
250
Radiation (langleys)
Figure 15. Loess fit to the ozone data. The key appears in color on a color device. The leftmost
6 columns show temperature for the lowest 3 levels of wind speed; the rightmost 6 columns are for
the highest wind speeds.
Now that we have used the panel= and strip= functions, it should come as little surprise
that there is another function accepted by high-level Trellis functions. A page= function is called
at the end of each page of output and can be used to put on page numbers or other identifying
information. For example
xyplot( ... ,
page = function(x) if(x>1)
mtext(paste("page", x), side = 1, line = par("oma")[1]-1,
outer = TRUE, adj = 1)
)
would number each page but the first of a multi-page display, placing the page number at the bottom right of the page.
2.7 Axes
Alignment of axes is one characteristic that makes the layout of Trellis displays so powerful. Unlike arbitrary sized and positioned windows, such as those produced by many software
packages, Trellis displays ensure that axes are aligned and can be readily compared to one
another. In support of this capability, Trellis functions take several arguments that give control
over the axes. Most basic are the xlim= and ylim= arguments, that allow specification of lower
and upper limits for axes. For example, specifying, xlim=c(0,100) ensures that the x-axis will
accommodate values between 0 and 100.
Although xlim= and ylim= are convenient, they are only a quick way of specifying one
detail of the scales on a Trellis plot. Full axis control is available through the scales=
- 24 argument. It not only gives precise control over tick marks, labels, etc., but it also controls how
the horizontal and vertical axes relate from panel to panel. In general, scales= is a list with
components named x= and y=. Each of these components, in turn, is a list with components in
name=value form, giving information about the x or y axis. If the scales= list contains other
components, they are taken to apply to both the x- and y-axes. What kinds of things can you
specify in the scales= list? Here’s an example:
scales = list(
x = list(col=2, tck=.5, at=c(.7, .9, .11),
label=c("good","better","best"),
alternating=FALSE),
y = list("sliced", nticks=17, tick=FALSE, log=2),
cex=.75
)
This would place 3 tick marks on the x-axis at coordinates .7, .9 and .11, labeled with the words
“good”, “better”, and “best”, would make the tick marks half their normal length, and would draw
the axis line, tick marks and tick labels in color 2. In addition, the x-axis labels would not alternate from the bottom to the top of the page — they would all be on the bottom side. Each panel’s
y-axis would be logarithmic (base 2), would have approximately 17 tick labels (although no tick
marks), and the y-axes would all have the same range (the "sliced"specification). On both
axes, the character size would be .75 of standard for that device.
Of course, most of the time you will not need to specify so much about axes, but the point is
that the scales= argument gives you lots of control. In fact, it also lets you suppress the drawing of one or both axes:
scales=list(draw=FALSE)
suppresses both the x- and y-axes. This might be appropriate if, for example, the plot were a map
or other recognizable entity that did not require a numeric scale.
One of the most common uses of the scales= argument is to specify axis relationships.
By default, the scale argument takes the value relation="same", which means that the horizontal axes will be identical on all panels and the vertical axes will be identical on all panels (the
horizontal and vertical axes are not necessarily the same as one another, though). The value
relation="sliced" means that the axes are set up to have the same units per inch — as if
each axis was a slice from one consistent larger axis. This means that the maximum minus minimum value for each axis is identical. Finally, the value relation="free" can be used to allow
each panel to have freedom in constructing an axis that just accommodates the data to be plotted
there. Because it is used so often, the relation= component is the only one of the scale components that need not be named explicitly. For both “sliced” and “free” scaling, axes are drawn for
each panel, taking up extra space on the display.
Suppose we had wanted to modify Figure 14 by allowing the y-axes to vary from plot to
plot. If we include
scales=list(y="free"),
and remove aspect="xy" from the call, we generate Figure 16, which now makes most comparisons extremely difficult, since the vertical axes are now scaled differently.
When a Trellis display is finished, the coordinate system is left in a state that in general has
no relation to the scales that were plotted on the page. The margins and outer margins are
returned to their previous values and the multiple figure parameters are set for one plot per page.
Because these parameters are reset, it is seldom reasonable to add to Trellis displays after they are
produced. If you want to augment a Trellis display, do so by means of the panel or page functions.
- 25 -
250
0
150
250
0
50
150
250
wind
temperature
wind
temperature
wind
temperature
wind
temperature
wind
temperature
wind
temperature
wind
temperature
wind
temperature
wind
temperature
wind
temperature
wind
temperature
2.4
2.4
3.0
wind
temperature
2.4
2.2
1.9
wind
temperature
wind
temperature
2.6
4.2
3.6
3.0
3.0
2.6
50
150
250
0
50
150
250
4.0
wind
temperature
4.0
4.2
4.5
4.6
wind
temperature
3.4
3.5
3.8
4.0
4.4
wind
temperature
3.6
0
wind
temperature
3.5
3.0
3.0
3.4
3.4
3.8
3.8
2.4
3.0
wind
temperature
4.5
wind
temperature
wind
temperature
3.0
wind
temperature
wind
temperature
5.0
wind
temperature
3.8
wind
temperature
3.4
wind
temperature
wind
temperature
2.6
wind
temperature
4.2
wind
temperature
2.8
wind
temperature
3.4
.2
2.0
2.2
3.0
2.6
3.4
2.6
3.0
wind
temperature
2.4
wind
temperature
2.2
2.0
.8
.8
2.0
2.6
2.2
2.2
2.0
50
2.8
2.4
2.3
2.6
wind
temperature
3.2
150
wind
temperature
2.1
2.1
1.9
2.4
wind
temperature
Cube Root Ozone (cube root ppb)
50
2.0
2.5
2.3
2.5
0
wind
temperature
0
50
150
250
Radiation (langleys)
Figure 16. Loess fit to the ozone data, no aspect ratio control, vertical scales allowed to vary
from panel to panel.
2.8 Aspect Ratio
One of the important capabilities of Trellis displays is the ability to control the panel aspect
ratio in order to produce more understandable plots. The aspect ratio is the physical height of a
panel divided by its physical width. (Physical measurements are in inches or centimeters, not in
data units.) The aspect ratio can be specified numerically, or it can be computed by banking calculations. In particular, Cleveland has experimental evidence that angles near 45° are the easiest
for the viewer to discriminate. Banking computes an appropriate aspect ratio to make the important characteristics of the display appear close to ±45°. The aspect= argument controls the
aspect ratio of Trellis displays. If a numeric value is given, that aspect ratio is used for all panels.
For example, aspect=1 says that each panel should be square. Another common use for
numeric values is to ensure a physical relationship between the x- and y-coordinates:
aspect = diff(range(y))/diff(range(x))
would set up an aspect ratio that just matched the ratio of the y and x coordinates. This is what is
required for making circles appear circular, for preserving physical shapes, etc. Finally, using
aspect="xy" performs the banking to 45° computations on the x- and y-data for all panels. The
sorted x-values and corresponding y-values are converted to fractions of the range, are differenced, scaled by their length and all thrown together into one computation that finds the aspect
ratio that brings the segments closest to 45°.
Because control over the aspect ratio is best done with at least a hint from the user, the
default is to use aspect="fill" which makes the aspect ratio appropriate so that the collection
of panels fills the display area.
- 26 There is a lot of wasted space in Figure 14 because of the chosen aspect ratio. Suppose we
had not tried to control the aspect ratio, but instead allowed the panels to fill the space (using the
default aspect="fill"). Now we have a plot where the lines are too flat to compare easily
(Figure 17).
Cube Root Ozone (cube root ppb)
0
5.0
4.5
4.0
3.5
3.0
2.5
2.0
5.0
4.5
4.0
3.5
3.0
2.5
2.0
5.0
4.5
4.0
3.5
3.0
2.5
2.0
0
50
50
100
200
300
0
50
100
200
300
0
50
100
200
wind
temperature
wind
temperature
wind
temperature
wind
temperature
wind
temperature
wind
temperature
wind
temperature
wind
temperature
wind
temperature
wind
temperature
wind
temperature
wind
temperature
wind
temperature
wind
temperature
wind
temperature
wind
temperature
wind
temperature
wind
temperature
wind
temperature
wind
temperature
wind
temperature
wind
temperature
wind
temperature
wind
temperature
wind
temperature
wind
temperature
wind
temperature
wind
temperature
wind
temperature
wind
temperature
wind
temperature
wind
temperature
wind
temperature
wind
temperature
wind
temperature
wind
temperature
100
200
300
0
50
100
200
300
0
50
100
200
300
5.0
4.5
4.0
3.5
3.0
2.5
2.0
5.0
4.5
4.0
3.5
3.0
2.5
2.0
5.0
4.5
4.0
3.5
3.0
2.5
2.0
300
Radiation (langleys)
Figure 17. Loess fit to the ozone data, no aspect ratio control.
2.9 Data Structures
There are two data structures that are of particular importance to Trellis displays. These are
factors and shingles. Factors were described in detail in Chambers & Hastie (1992). They are
used to hold categorical values, for example, colors (red, green, blue), states (Alaska, Alabama,
...), etc. Factors are created by the factor function. The other data structure, a shingle, is a vector of numeric data and a set of intervals. Shingles get their name because, like shingles on a
roof, the intervals can overlap one another. For each interval, some subset of the numeric values
fall into that interval.
Two functions are available for dealing with shingles. The first is shingle, which creates
a shingle by specifying the data and intervals. By default, the intervals are zero-width at the
unique values of the data. This sort of shingle is almost like a factor, although the precise
numeric value of each interval is preserved. Consider, for example, the engine data and the values of compression ratio. Treated as a factor, there would be 5 values. Treated as a shingle, there
would also be 5 values, but the numerical spacing of the compression ratios would be preserved.
The second function for creating shingles is equal.count, where a numeric vector is
divided up as equally as possible into a specified number of overlapping intervals; the amount of
overlap between adjacent intervals can also be specified.
Why are we spending time discussing these data structures? One reason is that shingles are
- 27 new to Trellis displays. The other is that the ordered level names of factors are used to label Trellis plots, thus it is important to describe how these labels are created and manipulated. We chose
this strategy to avoid having complicated labeling arguments for Trellis functions. Thus, to
change the labels, you change the factor.
levels(month.observed) <- month.name
...
levels(month.observed) <- month.abb
# full names
# abbreviated names
This is a powerful notion and will come up in later examples.
Two other functions are useful for ordering the levels of a factor. The first is ordered:
ordered(grades) <- c("Poor","Fair","Good","Excellent")
The second function useful for modifying factors is reorder.factor. It allows you to rearrange the levels of a factor based upon a computed value. For example, you could reorder a
hypothetical factor state from its original alphabetical order to an order based upon the median
income of the observations in that state:
state <- reorder.factor(state, income, median)
The function make.groups is often useful with Trellis displays. It constructs a data frame
from several vectors and the data frame can be passed in to a Trellis function. Suppose that we
have several vectors and want to see box and whisker plots or histograms of each. For example,
we want to compare payoffs of the New Jersey Pick-It lottery from three time periods:
make.groups(lottery.payoff, lottery2.payoff, lottery3.payoff)
creates a data frame with two components: data and which. The data component is simply the
combined numbers from all the make.groups arguments. The which component is a factor
with 3 levels, giving the names of the original data vectors. So, we could use
bwplot(which ˜ data, data = make.groups(lottery.payoff,
lottery2.payoff,lottery3.payoff))
to produce box and whisker plots or
histogram(˜ data | which, data = make.groups(lottery.payoff,
lottery2.payoff,lottery3.payoff))
to produce histograms of the three sets of data.
Just as make.groups converts vectors to data frames for use with Trellis functions, there
are also functions to facilitate graphics with arrays and time series. The functions
as.data.frame.array and as.data.frame.ts convert arrays or time series into data frames
(sorry about the long names, for those of you who don’t like to type).
Consider the object iris, a 3-way array with a dim vector like this:
> dim(iris)
[1] 50 4 3
We can turn iris into a data frame in preparation for plotting by using:
iris.df <- as.data.frame.array(iris, col.dims = 2)
The resulting data frame has what used to be its second dimension turned into 4 columns, so that
it looks like this:
> iris.df[1:5,]
Sepal L. Sepal W. Petal L. Petal W. flower species
1
5.1
3.5
1.4
0.2
1 Setosa
2
4.9
3.0
1.4
0.2
2 Setosa
3
4.7
3.2
1.3
0.2
3 Setosa
4
4.6
3.1
1.5
0.2
4 Setosa
- 28 5
...
5.0
3.6
1.4
0.2
5
Setosa
So, given a data frame like this, we can now use it with Trellis functions. Let’s try a parallel
coordinate plot. The function parallel takes a formula in the form
˜ x | g1 * g2 ...
where x is a matrix. The expression
parallel(˜iris.df[,1:4] | iris.df[,6], layout = c(3,1), main = "Iris Data")
produces Figure 18.
Iris Data
Min
Setosa
Max
Versicolor
Virginica
Petal W.
Petal L.
Sepal W.
Sepal L.
Min
Max
Min
Max
Figure 18. Parallel coordinate plot showing three groups of the iris data.
The function as.data.frame.ts takes one or more time series as arguments and produces a data frame with components named series, which, time, and cycle. The series
component is just the data from all of the time series combined into one long vector. The time
component gives the time associated with each of the points (measured in the same units as the
original series, e.g. years), and cycle gives the periodic component of the time (e.g. 1=Jan,
2=Feb, ...). Finally, the which component is a factor that tells which of the time series the measurement came from. (In this case there was only one series, hstart, but in general
as.data.frame.ts can take many arguments). For example:
> as.data.frame.ts(hstart)
series which
time cycle
1
81.9 hstart 1966.000
Jan
2
79.0 hstart 1966.083
Feb
3 122.4 hstart 1966.167
Mar
4 143.0 hstart 1966.250
Apr
5 133.9 hstart 1966.333
May
- 29 ...
Using as.data.frame.ts, we can produce a plot that shows housing starts from 1966 to
1974, broken down by their monthly levels.
timeplot(series ˜ time|cycle, data = as.data.frame.ts(hstart), # Figure 19
type = "h", xlab="Year", ylab="Housing Starts by Month")
1966
1968
1970
1972
1974
1966
1968
1970
Sep
Oct
Nov
Dec
May
Jun
Jul
Aug
1972
1974
200
150
Housing Starts by Month
100
50
200
150
100
Jan
Feb
Mar
Apr
50
200
150
100
50
1966
1968
1970
1972
1974
1966
1968
1970
1972
1974
Year
Figure 19. Each panel shows the housing starts for a particular month during the years from
1966 to 1974.
Notice that Figure 19 would change if time in the formula were replaced with trunc(time);
the vertical lines for each month would line up exactly at the year marks.
2.10 Labeling (Titles, Strip Labels, Keys)
Labeling is an important part of Trellis displays. The Trellis functions take arguments,
xlab= and ylab= to control the x- and y-axis labels. By default, these labels are made up from
the names of the variables (or the expressions) plotted there. Of course, you can often make the
labels more meaningful by giving explicit values, for example:
xlab="Equivalence Ratio", ylab="NOx (micrograms/J)"
would do a nicer job of labeling Figure 1. Also, the arguments main= and sub= may be given to
any high-level Trellis function to put a main title (at the top) and a subtitle (at the bottom) on each
page. Any of these label arguments can be given as a list, so that the label comes along with
associated graphical parameters, e.g.:
xlab=list("Equivalence Ratio", cex=1.5, col=2)
Strip labels are an important part of a Trellis display. By looking at the panel and its
- 30 associated strip labels, you can see the given variables and which levels are used for the particular
panel. By default, strip labels for shingles give the name of the shingle variable and show by
shading the fraction of the entire data range taken up by the current shingle interval. Strip labels
for factors give the label corresponding to the factor level and are shaded to show the order of this
level within the factor. By now you probably can guess that there are many ways to customize
strip labels. At the most extreme level, you can pass an entire strip label drawing routine as the
strip= argument to high-level Trellis plots (the default strip label routine is called
strip.default). However, most of the time there is no need to do this much. The argument,
par.strip.text allows you to pass in a list of graphical parameters that controls the rendering
of the text strings in the strip labels. The most common use of this is to control the size of the
text in the strip labels; the size of the strip label box changes to accommodate the characters. You
can also use par.strip.text to control the color and font of the text:
par.strip.text=list(cex=.75)
By default, the text size varies with the layout; the more rows or columns on the display, the
smaller the default strip label text size. If you want more control, you may want to construct your
own strip label function or at least change the style given in the default strip function. It helps to
know that strip.default takes two arguments you may want to change: strip.names and
style. The strip.names argument to strip.default is a logical vector of length 2, for
factors and shingles, respectively, that controls whether or not the variable names are included on
strip labels. By default, names are present for shingles but not for factors. Similarly, there is a
style argument to strip.default. So, for example,
strip=function(...)strip.default(..., strip.names=TRUE)
would put the variable name on both factors and shingles in the strip labels, and
strip=function(...)strip.default(..., style=4)
would use style 4 for strip labels (style 4 is described in the online documentation for
strip.default). In some circumstances you may want to suppress the strip labels altogether.
In this case, you can use strip=FALSE.
Trellis graphics provides a key function that allows great flexibility in labeling plots. The
key argument to Trellis functions is a list that is passed down, almost unchanged, to the key
function. Why, then, is it an argument to Trellis functions? Why not just call key directly? The
reason is that the key argument is processed by Trellis functions so that they can leave sufficient
space around the plots to hold both key and titles and they can also produce a legend on each page
of a multi-page display.
One of the most common uses for a key is when you are using panel.superpose to distinguish between various groups of points on scatterplot panels. For example we can display a
scatterplot matrix of the Anderson Iris data, using colors to encode the three different species.
new.iris <- iris.df[,1:4]
for(i in 1:4)
new.iris[,i] <- jitter(new.iris[,i])
iris.variety <- iris.df[,6]
superpose.symbol <- trellis.par.get("superpose.symbol")
splom(˜new.iris,
panel = panel.superpose,
groups = iris.variety,
key = list(space="top", columns = 3,
transparent = TRUE, text = list(levels(iris.variety)),
points = Rows(superpose.symbol,1:3)))
The result is shown in Figure 20. The position of the key is controlled here by the space= component of the key= argument.
- 31 -
Setosa
o
Versicolor
oo
o o o
o
o oo
o ooooo
oooo oo
oo
oo o
o
oooooo o
oo
o
o
oo ooo
o
ooo ooooo
o
o
o
o
o
o o oo
oo
ooooo ooo
oooo
ooooo o
ooo
o
o
o
o
o
o
ooooooo
oo oo
o
oo ooooooo
ooooooooo
o
o
o
o
o
o
o
oo
o
o
o
o
ooo
oo oo o
o oo
ooo
ooo o
ooooo o
oo
o ooo
oo
oooo
ooo o
oo
ooo oo
oo
oo
ooooooo
o
o oo
o
o
oo
ooo
o
o
oo
o
ooo
o
oo
o o
oo
o
ooo
oo
o
o
oo oo o
oooo
o
oo
o
oo
oo
o
o
o
o
o
o
o
o
o
o
oo
ooo oo
6
oo
o oo
oo
ooo
oo o
o
o
oo ooo
o
o
ooooo
ooo
oooo
oo
o
o
o
ooo
oo
oooo
oo o
oo
o
o
o oo
oooo
o
o
o
5
oo
o
o
o
o
o
o
o
o
o
o
o
ooooo
o
ooo
ooooooo
o oooo
ooooooo
o o oo o
o
oo
ooo
o
ooooo
ooo
4
o
ooo
oooo
ooooooo o
oooo
o
o
o oo o
o
oo
o
o
Virginica
o
oo
ooooo
o
ooo oo
oo
oo o
o
o
o
o
ooo oo o
ooo
oooo o
o ooo
o
ooo
ooo
oo o
o
o
o
oo
oooo o
ooo
o
oo
o
o
oo o
oo
ooooo
oo o
oo
o
o
ooo
o
ooooo
o
oooo
oooo
oooo
oooooo
oo
o oo o o
oo
o o o
oo ooo
oo
o
oo
o
ooo
o
oo
oooo
oo
ooooo
o
oo
o
ooo
o
oo oo
ooooo
oo
oo
o
2
o
oo
oooo
o
o oo oo o
o
o
3.0
3.5
4.0
oo
o o
4.0
oooo
o
o oo oo
o
oo
oo
ooo
o
oo
o ooo
o
o
o
3.5
oo
o
o
ooo
o
o
oo
ooooo
o
o
oo o oooo oo
o
oooo
o oo
ooo
ooo
oo
o
oo
Sepal W. 3.0 oooooooooo
o
o
ooooo
oo oooo ooo
oo
o
oo
ooo oo 3.0
oooo
o
oooo
o
o
o
o
o
o
o
o
ooooo
o o
o o
ooo
o
oo
oo ooo
2.5
o oo o
o
o oo oo o o
oo
2.0
2.5
3.0
2.0
o
o
o o oo
6
7
o
oo
o
o
o
o
7
o
o
oo
oo
ooo
o ooo
ooo
oooo
oooo
o ooooooo
o
o
o
o
o
o
o
Sepal L.
6
6
o oo oo
oo o
o
o
o
oo
o
o
o o o o oo
o
o
o
o
o
o
o
o
oo
oo
oo
o oooo
o
ooooo o
oo
oo
oo
oo
o
ooo
o
o
ooo
o
o
ooo o o oo
o
5 o o
o
o
oo
o
o
o
o
o
o
o
o
o
o oooo
oo
o
o
o
o
ooooo
oo o
o
oo
5
6
oo
o
o
2.5
1.5
2.0
2.5
2.0
1.5
1.5
Petal W.
1.0
0.5
0.5
4
5
Petal L.
6
4
3
ooooo
o
o
o
oooo o
oo
ooo
oo
o
ooooooo
o
oo
o
o o ooooo
ooo
oo
o
oooo
oo
oo ooo
oo
ooo
o
o
oooooooooooo
o
o
o
o
o
o
o
oooooo
ooooooo oooo
oooo
o
o
o
o
o
o
ooo o o o o
oo
o oo
ooooooooo
o oooooooooo oo o
o
o oo o
o
oo
o
o
o ooo
o
ooooo
ooooo
o
o
o
ooo
oooo
oo
o
ooo
ooo
o
o
oo
o
oo
o
o
o
o
o
o
ooooooo
o
o
o ooo
oooo
o
ooo
oooo
ooo ooo
o
o oo
o
oooooo o
o
ooo
o
oo
oo o
o
o
oooooo
o
o
o
oo
oo
oo
o
oo
o
o
o
oo
1.0
1.5
o oo
oooo oo o
oo ooo
o o
o
o
oo ooo
o o
o ooo
oooo
oo
o
oo
oo o
o
oo
ooo
o
o
o
o
o
o
o
o
o
oo
o
ooo
oooo
o
o
o
ooo
o
o
o
oo
o
oo
2
3
4
oo
o
oo o
o
o
o oooooooo
oo
o
o
o oo
o
ooo
o
o
o
o
o
o
o
o
o
o
o
o
oo
o o
o
oo
o
ooo ooo
ooooo o o
o
ooo
o oooo
oooooo
o
oo
o o
o
oo o
oo
o
o o o
oo
oo
o
o
o
ooo
ooo
oo o
oo
o oooo
o o
o
oooo
oo
oo o
ooooo o
o
o
o
o
o
o oo o
ooo o oo
oo o
o
ooooo
o
o
o o
ooooo o
ooo
o
Figure 20. Scatterplot matrix of the jittered iris data with symbols coding the three species. Output from older versions of the Trellis library may not show the cute axes in the diagonal panels.
Precise control of key positioning could also have been done by using the x=, y=, and center= components to the key= argument. The coordinate system for x and y is a unit square surrounding the entire set of panels. If x= and y= are specified and space= is not specified, no
additional space is left for the legend. This may be useful if the legend actually is superimposed
on the panels (presumably in some unused space.)
Another thing to notice about the example is the use of the superpose.symbol customization list. The panel.superpose function uses superpose.symbol to encode the
groups, so it is important to use the same parameters to build the key. Function
trellis.par.get returns a list giving graphical parameters used to plot superposed symbols
(see the online documentation); Rows chops it down to the first three values for each component
of the list; and finally, those parameters are used by key to encode a column of points symbols.
The panel.superpose function can help us improve the Barley data plot of Figure 7. If
we show the 1931 and 1932 values superimposed on a single panel, it will make the comparisons
easier. We can use:
superpose.symbol <- trellis.par.get("superpose.symbol")
dot.line <- trellis.par.get("dot.line")
dotplot(variety ˜ yield | site,
# Figure 21
data = barley,
groups = year,
panel = function(x, y, subscripts, ...){
abline(h = y, lwd = dot.line$lwd, lty = dot.line$lty,
col = dot.line$col)
panel.superpose(x, y, subscripts, ...)
- 32 },
aspect = 0.5, layout = c(1,6),
xlab = "Barley Yield (bushels/acre)",
key = list(points = Rows(superpose.symbol, 1:2),
text = list(levels(barley$year)),
space = "Right", columns = 2))
Waseca
o
Trebi
Wisconsin No. 38
o
No. 457
o
o
o
Glabron
Peatland
Velvet
o
No. 475
o
Manchuria
o
No. 462
o
Svansota
o
o
o
o
o
oo
o
o
o
o
Crookston
o
o
No. 457
o
o
Glabron
Peatland
o
o
o
o
Velvet
No. 475
Manchuria
No. 462
o
Svansota
o
o
Trebi
Wisconsin No. 38
o
o
o
o
o
o
o
o
o
Morris
oo
o
Trebi
Wisconsin No. 38
No. 457
Glabron
Peatland
o
Velvet
o
No. 475
o
o
o
o
o
Manchuria
No. 462
o
Svansota
o
o
o
o
o
o
o
o
o
o
University Farm
o
Trebi
1932
o
1931
o
oo
Wisconsin No. 38
o
o
o o
o o
o
o
o o
o
o
o
o
o
No. 457
Glabron
Peatland
Velvet
No. 475
Manchuria
No. 462
Svansota
Duluth
Trebi
Wisconsin No. 38
o
No. 457
Glabron
Peatland
o
Velvet
No. 475
o
o
o
Manchuria
No. 462
Svansota
o o
oo
o
o o
oo
o
o o
o
o
o
Grand Rapids
o
o
o
Trebi
Wisconsin No. 38
No. 457
Glabron
o
o
Peatland
Velvet
No. 475
o o
Manchuria
No. 462
Svansota
o
o
20
o
o
o
o
o
o
o
o
o
o
o
30
40
50
60
Barley Yield (bushels/acre)
Figure 21. Barley Data: comparison of 1931 and 1932 on a single panel.
This figure makes the anomaly in Morris stand out boldly — it is the only panel where the 1932
symbols are furthest to the right. Notice how the panel function draws the horizontal dotted lines
and then uses panel.superpose to draw the symbols.
It is important that you realize that the row, column, and strip labels are ordered according
to how the data was initially read. For example, the data frame barley that we used earlier was
created by reading a data file and making an intermediate data frame named barley2. The data
file barley.data, looked like this:
- 33 yield
27.00000
48.86667
27.43334
39.93333
32.96667
28.96667
43.06666
. . .
variety
Manchuria
Manchuria
Manchuria
Manchuria
Manchuria
Manchuria
Glabron
year
1931
1931
1931
1931
1931
1931
1931
site
University Farm
Waseca
Morris
Crookston
Grand Rapids
Duluth
University Farm
The columns were separated by tab characters (important because sites like “University Farm”
have embedded blanks), so we could, for example, use read.table to create the barley2 data
frame.
barley2 <- read.table("barley.data", sep="\t", header=TRUE)
When such a table is made, the default is to alphabetize the various factors. So, the expression:
dotplot(variety ˜ yield | year * site,
# Figure 22
data = barley2,
xlab="Barley Yield (bushels/acre)")
produces the difficult-to-understand Figure 22. The problem is that this ordering obscures the
underlying pattern; the main-effects ordering that makes the Morris year anomaly stand out in
Figure 7 is not present here. Notice, too, that read.table has produced a numeric vector for
year and hence it is plotted as a shingle, rather than a factor.
In order to produce Figure 7, we changed the factors:
barley <- barley2
barley$variety <- reorder.factor(barley2$variety, barley2$yield, median)
barley$year
<- ordered(barley$year, c(1932,1931)) # make it a factor
barley$site
<- reorder.factor(barley2$site, barley2$yield, median)
For example, the levels of the variety factor were rearranged by reorder.factor by increasing order of barley yield.
3. ADVANCED CONCEPTS
3.1 Prepanel Functions
One of the strengths of a Trellis display is the independence between a) the common code
that sets up the coordinate systems, labels, aspect ratios, and b) the panel function that takes care
of the drawing for each individual panel. Generally, this decoupling allows you to customize the
drawing in the panel without having to work with or understand the common code. Unfortunately, this is not always the case. The only thing that the common code can do in order to figure
out how to set up coordinate systems is to look at the variables in the formula to determine what
is going to be plotted on the horizontal and vertical axes.
Suppose, though, that your panel function draws more on the panel than just the x- and ydata. For example, suppose it puts on a fitted line or curve. How, then, can the Trellis software
allocate enough space on the panel for the extra things plotted by the panel function, when the
common code has no idea what extra plotting is going to take place? Another problem involves
aspect ratio calculations. The Trellis code can bank to 45° based upon the x- and y-data, but suppose that the important thing for the banking computations is a fitted line, not the raw data. How
can that be taken into account so that an appropriate aspect ratio can be computed? Remember,
by the time the panel function is called, the coordinate system and aspect ratio are already locked
in.
These problems are solved by the argument prepanel, which provides a prepanel function.
The job of the prepanel function is to take the x- and y-data for a panel and return a list containing
- 34 -
20
30
40
Waseca
year
Wisconsin No. 38
Velvet
Trebi
Svansota
Peatland
No. 475
No. 462
No. 457
Manchuria
Glabron
•
•
•
University Farm
year
•
•
•
•
•
•
•
•
•
•
•
Wisconsin No. 38
Velvet
Trebi
Svansota
Peatland
No. 475
No. 462
No. 457
Manchuria
Glabron
•
•
•
•
•
Wisconsin No. 38
Velvet
Trebi
Svansota
Peatland
No. 475
No. 462
No. 457
Manchuria
Glabron
•
•
•
•
•
•
•
•
Grand Rapids
year
•
•
•
•
•
Duluth
year
•
•
•
•
•
•
•
Duluth
year
•
•
•
•
•
•
•
•
•
•
•
•
•
Crookston
year
•
•
•
•
•
Crookston
year
•
Wisconsin No. 38
Velvet
Trebi
Svansota
Peatland
No. 475
No. 462
No. 457
Manchuria
Glabron
•
20
30
•
•
•
•
•
•
•
•
40
•
•
•
•
•
•
•
•
•
•
•
Wisconsin No. 38
Velvet
Trebi
Svansota
Peatland
No. 475
No. 462
No. 457
Manchuria
Glabron
•
Grand Rapids
year
•
•
Morris
year
•
•
•
•
•
•
•
•
•
•
•
•
•
•
•
•
•
•
•
•
•
•
•
•
•
•
Morris
year
Wisconsin No. 38
Velvet
Trebi
Svansota
Peatland
No. 475
No. 462
No. 457
Manchuria
Glabron
60
University Farm
year
•
•
•
50
Waseca
year
50
•
•
•
•
•
•
•
•
•
•
60
Barley Yield (bushels/acre)
Figure 22.
The barley data, with factors in alphabetical order. Compare to Figure 7.
one or more of the following components: xlim, ylim, dx, and dy. The xlim and ylim values
are vectors that give the minimum and maximum value on each axis. The dx and dy vectors
describe (the run and rise of) line segments that should be banked to 45°.
Certain types of Trellis displays occur often enough that prepanel functions are already written for them. They are prepanel.lmline, prepanel.qqmathline, and prepanel.loess.
If you want a least-squares line fit via the lm function to the x-y data in each panel,
prepanel.lmline will carry out the computations so that the panels will have enough room to
show the fitted line over the range of the x-data and so that the lines on the panels will be banked
as closely as possible to 45°. The prepanel.qqmathline function does a similar thing, but the
line is fit to a quantile plot and goes through the 25th and 75th percentiles. It is used in conjunction with qqmath and the panel.qqmathline functions.
- 35 Perhaps the most commonly used prepanel function is prepanel.loess. It does a loess
smoothing on the data in each panel and banks the segments of the smooths to 45°. Let’s give an
example of this, applied to the engine data.
EE <- equal.count(ethanol$E, number = 9, overlap = 0.25)
# Figure 23
xyplot(NOx ˜ C | EE,
data = ethanol,
prepanel = function(x, y) prepanel.loess(x, y, span = 1),
panel = function(x, y) {
panel.grid(h = 2)
panel.xyplot(x, y)
panel.loess(x, y, span = 1)
},
aspect = 2.5,
xlab = "Compression Ratio", ylab = "NOx (micrograms/J)")
8
EE
10
12
14
16
18
8
EE
EE
10
12
14
16
18
EE
4
3
NOx (micrograms/J)
2
1
EE
EE
EE
EE
EE
4
3
2
1
8
10
12
14
16
18
8
10
12
14
16
18
8
10
12
14
16
18
Compression Ratio
Figure 23. Engine data showing how NOx emissions depend on compression ratio for various
intervals of equivalence ratio.
Studying Figure 23 and the xyplot expression that produced it gives a concrete example of
many of the issues that we have been discussing. For example, notice how the span argument to
loess is passed to both panel.loess and prepanel.loess.
As we mentioned earlier, the formulas given to Trellis functions are allowed to contain
expressions. That means we could have made the call to equal.count as part of the formula.
However, the problem with this is that there would then be no nice character string to use for the
strip labels and we have found that names on strip labels are particularly important for shingles.
Otherwise, the information about what variable is represented by the shingle needs to be placed in
the caption or somewhere else in the figure.
As you can see, calls to Trellis functions may get a bit large, even though no particular part
- 36 is all that difficult. The way we structured the call, with a separate argument on each line and
multi-line, indented panel functions, is designed to make it easier to read and understand. You
may find this layout technique useful, too.
When we first produced Figure 23, we did not include the aspect=2.5 argument. Because
we used a prepanel function that returned dx and dy values, the banking computation was done
automatically. Unfortunately, the resulting aspect ratio was far too big. To see how it looked, try
the expression without using the aspect= argument. The problem is that many of the panels
have basically horizontal fits, and only an extreme aspect ratio will make these panel fits non horizontal. This shows the occasional need for user adjustments to the automatically chosen values.
3.2 The subscripts= Argument
Suppose that we would like to produce the plot of Figure 3, but instead of plotting points,
we would like to plot the observation number for each point. Since a panel function only gets the
x- and y-values that belong on a panel, how are we to accomplish this? We solve this problem in
a very general way by allowing the panel function to request one extra argument, named subscripts. The subscripts argument is a numeric vector that tells which observation in the
original data is associated with the x- and y-values. Thus, we can neatly solve our problem by
using
xyplot(NOx ˜ E | C,
data = ethanol, # Figure 24
panel = function(x,y,subscripts)
text(x,y,subscripts)
)
This works because xyplot sees that the panel function expects an argument named subscripts and arranges to pass the appropriate information to the panel function.
We claimed that the subscripts argument was a very general solution to this and similar
problems. Why is that so? Basically, once a panel function knows which of the original observations correspond to the x- and y-values, that information can be used to deal with any other data
that is parallel to the original data. In particular, if x and y come from a data frame, any other
variables in the data frame can be subscripted by the subscripts vector. To facilitate this even
more, another argument, groups, can be given to all high-level Trellis functions. This argument
will be passed down to the panel function, along with the subscripts argument. Inside the
panel function, groups[subscripts] is a vector parallel to x and y that can be used for
attribute colors, identifiers, etc. to the observations. The panel function panel.superpose,
used earlier in several examples (Figures 18 and 20), uses exactly this mechanism to do its work.
When a high-level Trellis function can see that its panel function has a subscripts argument, it automatically arranges to call the panel function with arguments named x, y, and subscripts. The subscripts mechanism interacts properly with the subset argument: subscripts are done relative to the original data.
3.3 Device Settings
Before we get deeply into the concepts of device customization, a few words of reassurance.
Don’t worry — you normally do not need to write code like this yourself. Trellis graphics makes
use of customization to produce excellent plots on all devices without requiring any changes on
the part of the user to make it happen. If your device has color capabilities, Trellis functions will
use them; they may also use various fonts, character sizes, line styles, area fills, etc. However,
when you write your own panel functions, you may know for certain that you are producing the
plot for a particular device and you know just what values the parameters should have. If so, just
write the panel function with exactly the parameters you want.
- 37 -
0.6
0.8
C
1.0
1.2
C
55 19
27
74
4
54
81
64
66
41
3
34
52
56
73
32
86
26
2
43
88
42
35
14
13
76
31
33 87
72
NOx
53
7518
44
25
65
82
24
C
1
C
C
4
62
58
77
50
3
30
48
37
20
63
22
29
51
59
80
28
49
38
61
57
2
1
68
4
21
36
83
1.0
9
2
46
40
39
23
60 78
0.8
6
111
71
15
0.6
67
47
69
17
3
16
8
79
707
45
84
1.2
12
5
10
85
0.6
0.8
1.0
1.2
E
Figure 24. The ethanol data with each observation identified by observation number.
On the other hand, you may want to write your Trellis plot calls that adapt to device characteristics, too. In this case, an explanation of how Trellis functions deal with graphical parameters
may help you to understand how device-specific customization works.
Basically, all Trellis functions are careful to specify graphical parameters in a symbolic
way, by referring to objects that give the actual values of the parameters. For example, let’s look
at (a simplified version of) the most commonly used panel function, panel.xyplot:
panel.xyplot <- function(x, y, ...){
plot.symbol <- trellis.par.get("plot.symbol")
points(x, y,
cex = plot.symbol$cex, pch = plot.symbol$pch,
font = plot.symbol$font, col = plot.symbol$col, ...)
}
The object plot.symbol is a list with components pch, cex, font, and col to specify the plotting symbol, its size, font, and color. When the S device is set up by an explicit or implicit call to
trellis.device, the .Device object is given an attribute that stores a set of Trellis parameter
lists; plot.symbol is one such list. The function trellis.par.get gets the named list. As
illustrated above, it is often convenient to save the list and then extract components from it in various graphics routines inside the panel function.
To see how customization is set up for on any particular device, start the device and then
execute the function show.settings. Figure 25 shows an example.
- 38 -
o
o
o
o
o
o
o
o
o
o
o
o
o
o
o
o
o
o
o
o
o
o
o
o
o
o
o
o
o
o
o
o
o
o
o
o
o
o
o
o
o
o
superpose.symbol
•
superpose.line
strip.background
•
strip.shingle
World
Hello
dot.[symbol, line]
box.[dot, rectangle, umbrella]
add.[line, text]
reference.line
plot.[symbol, line]
plot.shingle (bar.fill)
histogram (bar.fill)
barchart (bar.fill)
l=
co
3
col =
2
•
•
•
o
o
o
o
o
o
o
l=
co
col =
5
col = 4
=1
col
col
=7
1-100
6
piechart (fill)
regions
Figure 25. Sample output from the show.settings function. This shows the various customization settings done for a PostScript printer.
3.4 Finding the Data
In many of the examples so far, we have used the data= argument to present a data frame
to be searched for objects named in a Trellis formula. There are a few subtleties of this that are
addressed here. (These same issues affect the functions described in the book Statistical Models
in S.) When the data= argument is given, the data frame or list specified by that argument is the
first place searched for finding objects named in the formula or in the subset= or groups=
arguments. This search of the data= argument replaces the normal search of the caller’s frame.
In any case, if an object is not found in the ‘data=’ argument or in the caller’s frame, the search
will continue through frames 1, 0, and the databases explicitly on the search list.
Why does this matter? It matters when you write functions that call Trellis functions. For
example:
myfun1 <- function(){
histogram(˜height | voice.part, data=singer)
}
would work and
myfun2 <- function(){
histogram(˜sqrt(height) | voice.part, data=singer)
}
would also work, but
myfun3 <- function(){
sqrtht <- sqrt(singer$height)
histogram(˜sqrtht | voice.part, data=singer)
- 39 }
would fail with the error message
> myfun3()
Error in myfun3(): Object "sqrtht" not found
This is because the presence of the data= argument prevents histogram from looking into
myfun3’s frame to find sqrtht.
Here are several ways to fix the problem. a) put the transformed object back into the data
frame.
myfun3a <- function(){
singer$sqrtht <- sqrt(singer$height)
histogram(˜sqrtht | voice.part, data=singer)
}
b) don’t use the data= arugment.
myfun3b <- function(){
sqrtht <- sqrt(singer$height)
histogram(˜sqrtht | singer$voice.part)
}
c) explicitly put the data frame on the search list.
myfun3c <- function(){
attach("singer")
sqrtht <- sqrt(height)
histogram(˜sqrtht | voice.part)
}
4. HIGHER DIMENSIONS
This section describes plots for data of three or more dimensions.
4.1 3-D Plotting
Perspective Trellis displays are carried out by the function cloud, which produces a 3dimensional point cloud, and the function wireframe, which draws a 3-D wireframe surface.
Unfortunately, static cloud displays are typically difficult to understand because even though
points in 3-space are displayed in perspective, there is too little structure for the viewer’s eye to
put together an integrated view when a static panel is drawn.
The going is a bit rough here, so we will give an extended example. The non-Trellis functions mentioned in this section are described in the book Statistical Models in S.
Suppose we are interested in learning about the environmental ozone data, where ozone
concentrations are to be related to wind speed, temperature and solar radiation. One way to learn
about the general pattern is to fit a smooth surface to the data, and we have previously determined
that the cube-root of ozone concentration is an appropriate response variable. We can use the
loess function compute the smooth fit:
attach(environmental)
ozo.m <- loess((ozoneˆ(1/3)) ˜ wind * temperature * radiation,
parametric = c("radiation", "wind"), span = 1, degree = 2)
Notice how the formula given to loess looks just like the formulas given to Trellis functions.
To produce a wireframe or surface plot, we need to evaluate the surface at a regular grid of values. We will evaluate the grid for 50 values of wind speed, ranging from the minimum to maximum observed speeds, 50 values of temperature, and 4 levels of radiation. We first form vectors
- 40 of the wind speed, temperature, and radiation marginal values, and then make a grid of all
50x50x4 combinations of those.
w.marginal <- seq(min(wind), max(wind), length = 50)
t.marginal <- seq(min(temperature), max(temperature), length = 50)
r.marginal <- seq(min(radiation), max(radiation), length = 4)
grid <- expand.grid( wind = w.marginal, temperature = t.marginal,
radiation = r.marginal)
The grid object is just what the predict function needs to produce the fitted values:
fit <- predict(ozo.m, grid)
The fit object is a vector that matches the vectors in the grid data frame: wind, temperature,
and radiation. Now, to produce the wireframe plots, we execute:
wireframe(fit ˜ wind * temperature | radiation,
# Figure 26
data = grid,
xlab = "Wind Speed (mph)",
ylab = "Temperature (F)",
zlab = "Cube Root Ozone \n(cube root ppb)")
The wireframe function also allows us to specify that color draping should be applied to the
wireframe; this means that each patch of the wireframe can be drawn in a solid color controlled
by the z value or by any other value given as the drape= argument (which must be the same
length as z). For more information on color draping, see the online documentation for wireframe.
There are a few arguments that are unique to the 3-D functions. These specify parameters
for the viewing transformation and provide for axis control. The default viewing perspective was
shown in the wireframe example. Suppose, however, that you wish to look at the surface from
other vantage points. You can do this with the argument screen, a list with named components,
each describing a rotation. The name of the element tells which axis the rotation should be
around; the value gives the degrees of rotation about the axis. For example, the default for
screen is
screen=list(z = 40, x = -60)
which means that we rotate by 40° about the z-axis and then by –60° about the x-axis. To understand these rotations, we need to understand the 3-D axis orientations: the x-axis extends horizontally across the screen, the positive y-axis goes back into the screen, and the z-axis is vertical.
Another important viewing parameter is named perspective. This is a logical flag that
tells whether the projection should be orthogonal (perspective=FALSE) or perspective. If a
perspective projection is desired, the parameter distance controls the apparent distance from the
eye to the object. A value of 0 implies an infinite viewing distance (an orthogonal view) while 1
has the eye point right up to the data; the default is 0.2.
There are two ways that the axes can be drawn in 3-D Trellis plots: either with 3-D axis
lines with ticks and tick labels or by simple arrows that run parallel to the axes and point in the
direction of increasing values. Arrows are the default; conventional axes by turning off the arrow
axes via the scale=list(arrows=FALSE) argument. In either case, the axes or arrows are
labeled by variable names, either taken from the formula or passed in through the arguments
xlab, ylab, and zlab.
Another quick comment related to 3-D plotting: the notion of a simple panel function breaks
down here. Unfortunately, the panel function does projections, axis drawing, etc., and thus it is
huge and unwieldy. Don’t expect to produce your own 3-D panel function without studying and
modifying a copy of an existing one.
- 41 -
radiation
oot Ozone
root ppb)
Temperature (F)
radiation
oot Ozone
root ppb)
Wind Speed (mph)
Temperature (F)
radiation
oot Ozone
root ppb)
Temperature (F)
Wind Speed (mph)
radiation
oot Ozone
root ppb)
Wind Speed (mph)
Temperature (F)
Wind Speed (mph)
Figure 26. A Trellis wireframe display showing the loess fit of ozone data to wind speed and
temperature, for four given levels of solar radiation. Notice the changes in height relative to the
surrounding box, especially in the far corner and at intersections with axes.
4.2 Contour Plots
Wireframe and contour displays share many characteristics; the input data is often identical
— only the way it is displayed changes. Once we have our data structures straight, a contour plot
corresponding to the previous wireframe is simple to produce:
contourplot(fit ˜ wind * temperature | radiation,
data = grid,
xlab = "Wind Speed (mph)",
ylab = "Temperature (F)",
main = "Cube Root Ozone (cube root ppb)")
# Figure 27
If you compare the contour and wireframe figures you can probably see that the contour plot is
preferable for quantitative information but the wireframe gives a good gestalt of the surface.
- 42 -
Cube Root Ozone (cube root ppb)
5
10
radiation
15
20
radiation
5
5
7
7
6
6
5
5
90
80
Temperature (F)
70
60
4
3
4
3
radiation
radiation
6
5
90
5
4
80
4
4
70
60
3
2
5
10
3
15
20
Wind Speed (mph)
Figure 27. A Trellis contour display showing the loess fit of ozone data to wind speed and temperature, for four given levels of solar radiation. Compare to the wireframe display in Figure 24.
The function levelplot produces a color level plot, where color or gray levels are used to
encode the value of a third variable. It is closely related to a contour plot — the boundaries
between different regions of a levelplot are contours.
4.3 More Than Three Variables
Two functions are designed to work with more than three variables on each panel of a Trellis display: splom and parallel. You saw the result of parallel in Figure 18. The splom
function produces a plot in which each column in an input matrix, x, is plotted against each other
column. Figure 20 was an example of this. What might not be obvious is that the formula may
also contain given variables,
splom( ˜x | g1 * g2 * ... )
- 43 Here, x is a matrix, and the given vectors cause the packets to contain sub-matrices consisting of
various rows of x. For each packet, a scatterplot matrix is plotted. The axes produced by splom
are cleverly constructed to use minimal space; there is an argument, pscales, that can control
these axes.
5. A GRAB BAG
This section contains descriptions of several Trellis functions that don’t quite fit in with the
general formula and data framework that has been introduced earlier. However, don’t get the idea
that they are not important, just because they are hard to place. Each of these functions does
something non-trivial.
The function rfs produces a plot that shows the residual and fitted-values spreads (as
described in Cleveland, 1993). It is used to assess the magnitude of the fit to the magnitude of the
residuals. You initially fit a model, then give the model object to rfs. It produces a pair of plots
with identical y-axis scaling (in units per inch). By comparing the sizes of the y-variation two
plots, you can determine the importance of the fit.
The tmd function computes a Tukey mean and difference plot. It is unusual since it takes as
an argument the output of one of the other plotting functions and it produces from that another
similar object (of class trellis). However, for each plot it transforms the data so that the x-axis
holds the mean of the original x- and y-variables and the y-axis gives the difference. The purpose
of this is to allow more effective comparisons. Instead of comparing how well data fits the y=x
line, you can look at how well the tmd-modified data follows a horizontal line.
Finally, the function oneway is provided to do a one way analysis of variance. Suppose we
believe that the heights of singers can be modeled by a typical value for each voice part with variation about that typical value. We can fit this model with oneway and assess the quality of the fit
with rfs:
attach(singer)
# Figure 28
singer.model <- oneway(height ˜ voice.part, spread = 1)
rfs(singer.model, aspect = 1, ylab = "Height (inches)")
The results are shown in Figure 28.
- 44 -
0.0
Fitted Values minus Mean
0.2
0.4
0.6
0.8
1.0
Residuals
6
Height (inches)
4
2
0
-2
-4
0.0
0.2
0.4
0.6
0.8
1.0
f-value
Figure 28. Residuals and fitted values from a one-way fit to the singer data.
REFERENCES
[1]
Becker, Richard A., Chambers, John M., and Wilks, Allan R., The New S Language, Chapman & Hall, 1988.
[2]
Cleveland, William S., Visualizing Data, Hobart Press, Summit NJ, 1993.
[3]
Chambers, John M. and Hastie, Trevor J., eds., Statistical Models in S, Chapman & Hall,
1992.
[4]
Becker, Richard A., Cleveland, William S., and Shyu, Ming-Jen, ‘‘The Visual Design and
Control of Trellis Display’’, J. Computational and Graphical Statistics, 1995, to appear.
[5]
MathSoft, S-PLUS Trellis Graphics User’s Manual, Version 3.3, Seattle: MathSoft, Inc.