1
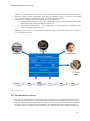
ProPerf Configuration User’s Guide Chapter 1: About this Manual Overview ProPerf Configuration is a specific-purpose application that is part of Tekelec's IAS system. The ProPerf Configuration application enables operators to view performance and quality indicators in real-time or using historical data, with a dynamic display of curves and graphs. Performance or quality indicators, calculated with xDRs, are provided by the probes and/or defined with the ProTraq application. The data is stored into statistical sessions within remote applications such as IXP or DataServer and managed using Centralized Configuration Manager (CCM). The following indicators can be displayed in ProPerf Configuration: SS7 network performance indicators according to ITU Q.752 Customer traffic indicators based on ISUP and links analysis in real-time Real-time indicators based on Traffic or IP service Quality monitoring Load indicators on IN-transactions (per link and reprocessed for all links per SCP) INAP, MAP, CAP transaction efficiency, duration, operation, and global title Volume, efficiency, split of cause values for GPRS Session Management, Mobility Management, SMS management Using ProPerf Configuration enables you to see failures and overloads instantly. In addition, trends can be easily estimated according to the shape of the curve. Scope and Audience This user's manual provides information about the ProPerf Configuration application. It is designed to be both a beginners' guide to working with performance indicators as well as an intermediate and advanced user's reference to general concepts. This guide is designed around performing common tasks such as: Understanding ProPerf dashboard and panel layouts to create statistical sessions Working with dashboards and panels Creating line charts, pie charts and bar graphs Modifying privacy settings to share your information with other users Take a few minutes to browse through these tasks and become acquainted with the layout of this guide to become familiar with the headings and subheadings that allow you to find the information you need. About the Performance Intelligence Center The Performance Intelligence Center (PIC) is a monitoring and data gathering system that provides network performance, service quality and customer experience - across various networks, technologies, protocols, etc. Beyond monitoring performance and gathering data, the solution also provides analytics, actionable intelligence and potentially an intelligent feedback mechanism. It allows Service Providersto simultaneously look across the Data Link, Network, Transport and Application layer traffic to better correlate and identify the impact of network problems on revenue generating applications and services. PIC functionality is based on the following general flow. The Integrated Message Feeder (IMF) is used to capture SS7 and SigTran traffic. The Probed Message Feeder (PMF) is used to capture both SS7 and IP traffic. Both products forward Probe Data Units (PDUs) to the Integrated xDR Platform (IXP). The IXP stores this traffic data and correlates the data into detailed records (CDRs, IPDRs, 1