1
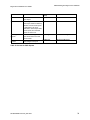
Oracle® Communications
Performance Intelligence Center
Report Server Platform User Guide
Release 9.0
February 2014
Oracle Communications Performance Intelligence Center Report Server Platform User Guide, Release 9.0
Copyright © 2003, 2014, Oracle and/or its affiliates.
All rights reserved.
This software and related documentation are provided under a license agreement containing restrictions on use and disclosure and
are protected by intellectual property laws. Except as expressly permitted in your license agreement or allowed by law, you may not
use, copy, reproduce, translate, broadcast, modify, license, transmit, distribute, exhibit, perform, publish, or display any part, in any
form, or by any means. Reverse engineering, disassembly, or decompilation of this software, unless required by law for
interoperability, is prohibited.
The information contained herein is subject to change without notice and is not warranted to be error-free. If you find any errors,
please report them to us in writing.
If this is software or related documentation that is delivered to the U.S. Government or anyone licensing it on behalf of the U.S.
Government, the following notice is applicable:
U.S. GOVERNMENT RIGHTS Programs, software, databases, and related documentation and technical data delivered to U.S.
Government customers are "commercial computer software" or "commercial technical data" pursuant to the applicable Federal
Acquisition Regulation and agency-specific supplemental regulations. As such, the use, duplication, disclosure, modification, and
adaptation shall be subject to the restrictions and license terms set forth in the applicable Government contract, and, to the extent
applicable by the terms of the Government contract, the additional rights set forth in FAR 52.227-19, Commercial Computer Software
License (December 2007). Oracle America, Inc., 500 Oracle Parkway, Redwood City, CA 94065.
This software or hardware is developed for general use in a variety of information management applications. It is not developed or
intended for use in any inherently dangerous applications, including applications that may create a risk of personal injury. If you use
this software or hardware in dangerous applications, then you shall be responsible to take all appropriate fail-safe, backup,
redundancy, and other measures to ensure its safe use. Oracle Corporation and its affiliates disclaim any liability for any damages
caused by use of this software or hardware in dangerous applications.
Oracle and Java are registered trademarks of Oracle and/or its affiliates. Other names may be trademarks of their respective owners.
Intel and Intel Xeon are trademarks or registered trademarks of Intel Corporation. All SPARC trademarks are used under license and
are trademarks or registered trademarks of SPARC International, Inc. AMD, Opteron, the AMD logo, and the AMD Opteron logo are
trademarks or registered trademarks of Advanced Micro Devices. UNIX is a registered trademark of The Open Group.
This software or hardware and documentation may provide access to or information on content, products, and services from third
parties. Oracle Corporation and its affiliates are not responsible for and expressly disclaim all warranties of any kind with respect to
third-party content, products, and services. Oracle Corporation and its affiliates will not be responsible for any loss, costs, or damages
incurred due to your access to or use of third-party content, products, or services.
2
Table of Contents
Report Server Platform User Guide .............................................................. Error! Bookmark not defined.
Table of Contents ................................................................................................................................... 3
List of Figures ......................................................................................................................................... 5
List of Tables ........................................................................................................................................... 6
Chapter1: About this Manual ................................................................................................................. 7
Overview............................................................................................................................................... 8
Scope and Audience ............................................................................................................................ 8
Customer Care Center ......................................................................................................................... 8
PIC Documentation Library ................................................................................................................ 10
Locate Product Documentation on the Customer Support Site ......................................................... 11
Chapter 2: Understanding Report Server Platform ........................................................................... 12
RSP Overview .................................................................................................................................... 13
RSP Components ............................................................................................................................... 13
Acronyms............................................................................................................................................ 13
Chapter 3: Using ReportInfoView ....................................................................................................... 15
Overview............................................................................................................................................. 16
Accessing the Network Intelligence Reports ...................................................................................... 16
Working with Web Intelligence Reports ............................................................................................. 16
Navigating the Web Intelligence Reports ....................................................................................... 16
Understanding the Right-Click Menu ............................................................................................. 17
Viewing the Web Intelligence Reports ........................................................................................... 18
Scheduling Web Intelligence Reports ............................................................................................ 18
Refreshing Web Intelligence Reports ............................................................................................ 19
Viewing Previously Run Web Intelligence Reports ........................................................................ 20
Using Drill Filters in Web Intelligence Reports ............................................................................... 20
Using the Drill Feature in Web Intelligence Reports ...................................................................... 21
Linking to Detailed Records in ProTrace ....................................................................................... 21
Saving and Forwarding Web Intelligence Reports ......................................................................... 21
Chapter 4: Administering the Report Server Platform ...................................................................... 23
Overview............................................................................................................................................. 24
Summary of Tasks and Access Privileges ..................................................................................... 24
Prerequisites .................................................................................................................................. 24
Accessing the Necessary Tools for Configuring Reports ................................................................... 25
Accessing NSP Tools: CCM and Report Administrator ................................................................. 25
Accessing the Report Server ......................................................................................................... 25
Registering the Report Server ............................................................................................................ 25
Managing Report Packages ............................................................................................................... 26
Activating a Report Package .......................................................................................................... 26
Setting the RS Parameters for Data Retention .............................................................................. 27
Setting the PPS Parameters .......................................................................................................... 28
Viewing a Report Package Configuration ...................................................................................... 28
Removing a Report Package from a Network View ....................................................................... 28
3
Reconfiguring a Network View ....................................................................................................... 28
Managing Reporting Sessions ........................................................................................................... 29
Dissociating an Output Session from a Report .............................................................................. 29
Removing an output session from the Database ........................................................................... 30
Defining User Access ......................................................................................................................... 30
Setting Up User Accounts on PIC .................................................................................................. 30
Levels of Access for Report Server Platform ................................................................................. 30
4
List of Figures
Figure 1: Web Intelligence Report List ........................................................................................................ 17
Figure 2: Schedule Page ............................................................................................................................ 19
Figure 3: Sample Refresh Dialog ................................................................................................................ 20
Figure 4: Drill Filters Toolbar ....................................................................................................................... 21
5
List of Tables
Table 1: Acronyms for Report Server Platform ........................................................................................... 14
Table 2: Columns in the Report List............................................................................................................ 17
Table 3: Right-Click Menu Options ............................................................................................................. 18
Table 4: Save Options in Document Menu ................................................................................................. 22
Table 5: Options in Send to Menu .............................................................................................................. 22
Table 6: Report Manager Tasks, Tools, and User Groups ......................................................................... 24
Table 7: Columns in Report Package Distribution Table ............................................................................ 26
Table 8: Columns In List Of Sessions Table ............................................................................................... 27
Table 9: Columns in Reporting Sessions Table .......................................................................................... 29
Table 10: Access For RSP Reports ............................................................................................................ 31
6
Chapter1: About this Manual
Topics:
•
Overview
•
Scope and Audience
•
Error! Reference source not found.
•
PIC Documentation Library
•
Locate Product Documentation on the Customer Support Site
7
Overview
The Report Server Platform (RSP) is part of the NSP application set and includes the Report
InfoView and Report Administrator applications. The reporting feature enables users to configure,
generate, view, and store analytic packages and reports.
This user documentation explains how to view and schedule the reports as well as how to configure
the components of RSP.
Note: In addition to this help text, the InfoView application has its own on-line help. The Business
Objects Enterprise (BOE) help is not specific to NSP. Access this help by clicking the Help icon
in the upper right section of the page. Clicking this icon opens the Business Objects Enterprise
InfoView User's Guide in a new window.
Hel
P
Scope and Audience
This user manual provides information about the Report Server Platform in NSP. It addresses general reporting
concepts as well as specific information on using the Web Intelligence Reports, and Report Administrator. For
information about a specific report or analytic package see the documentation for that package.
The audience of this manual is any user who needs to view and/or schedule the reports. NSPBusinessUser
have View privileges and NSPBusinessPowerUser have View and Schedule privileges. For configuration
access privileges, see Chapter 4: Administering the Report Server Platform
Customer Care Center
The Tekelec Customer Care Center is your initial point of contact for all product support needs. A representative
takes your call or email, creates a Customer Service Request (CSR) and directs your requests to the Tekelec
Technical Assistance Center (TAC). Each CSR includes an individual tracking number. Together with TAC
Engineers, the representative will help you resolve your request.
The Customer Care Center is available 24 hours a day, 7 days a week, 365 days a year, and is linked to TAC
Engineers around the globe.
Tekelec TAC Engineers are available to provide solutions to your technical questions and issues 7 days a week,
24 hours a day. After a CSR is issued, the TAC Engineer determines the classification of the trouble. If a critical
problem exists, emergency procedures are initiated. If the problem is not critical, normal support procedures
apply. A primary Technical Engineer is assigned to work on the CSR and provide a solution to the problem. The
CSR is closed when the problem is resolved.
Tekelec Technical Assistance Centers are located around the globe in the following locations:
Tekelec - Global
Email (All Regions): [email protected]
USA and Canada
Phone:
8
1-888-FOR-TKLC or 1-888-367-8552 (toll-free, within continental USA and Canada)
1-919-460-2150 (outside continental USA and Canada)
TAC Regional Support Office Hours:
8:00 a.m. through 5:00 p.m. (GMT minus 5 hours), Monday through Friday, excluding holidays
Caribbean and Latin America (CALA)
Phone:
USA access code +1-800-658-5454, then 1-888-FOR-TKLC or 1-888-367-8552 (toll-free)
TAC Regional Support Office Hours (except Brazil):
10:00 a.m. through 7:00 p.m. (GMT minus 6 hours), Monday through Friday, excluding holidays
•
Argentina
Phone:
0-800-555-5246 (toll-free)
•
Brazil
Phone:
800-891-4341 (toll-free)
TAC Regional Support Office Hours:
8:30 a.m. through 6:30 p.m. (GMT minus 3 hours), Monday through Friday, excluding holidays
•
Chile
Phone:
1230-020-555-5468
•
Colombia
Phone:
800-912-0537
•
Dominican Republic
Phone:
1-888-367-8552
•
Mexico
Phone:
001-888-367-8552
•
Peru
Phone:
0800-53-087
•
Puerto Rico
Phone:
1-888-367-8552 (1-888-FOR-TKLC)
•
Venezuela
Phone:
0800-176-6497
9
Europe, Middle East, and Africa
Regional Office Hours:
8:30 a.m. through 5:00 p.m. (GMT), Monday through Friday, excluding holidays
•
Signaling
Phone:
+44 1784 467 804 (within UK)
•
Software Solutions
Phone:
+33 3 89 33 54 00
•
India
Asia
Phone:
+91 124 436 8552 or +91 124 436 8553
TAC Regional Support Office Hours:
10:00 a.m. through 7:00 p.m. (GMT plus 5 1/2 hours), Monday through Saturday, excluding holidays
•
Singapore
Phone:
+65 6796 2288
TAC Regional Support Office Hours:
9:00 a.m. through 6:00 p.m. (GMT plus 8 hours), Monday through Friday, excluding holidays
PIC Documentation Library
PIC customer documentation and online help are created whenever significant changes are made that affect
system operation or configuration. Revised editions of the documentation and online help are distributed and
installed on the customer system. Consult your NSP Installation Manual for details on how to update user
documentation. Additionally, a Release Notice is distributed on the Tekelec Customer Support site along with
each new release of software. A Release Notice lists the PRs that have been resolved in the current release and
the PRs that are known to exist in the current release.
Listed is the entire PIC documentation library of user guides.
•
•
•
•
•
•
Security User Guide
Alarms User Guide
ProAlarm Viewer User Guide
ProAlarm Configuration User Guide
Centralized Configuration Manager Administration Guide
Customer Care User Guide
• Alarm Forwarding Administration Guide
• Diagnostic Utility Administration Guide
10
•
•
•
•
•
•
•
ProTraq User Guide
ProPerf User Guide
ProPerf Configuration User Guide
System Alarms User Guide
ProTrace User Guide
Data Feed Export User Guide
Audit Viewer Administration Guide
•
•
•
•
•
•
•
ProDiag User Guide
SigTran ProDiag User Guide
Report Server Platform User Guide
Reference Data User Guide
Exported Files User Guide
Scheduler User Guide
Quick Start User Guide
Locate Product Documentation on the Customer Support Site
Access to Tekelec's Customer Support site is restricted to current Tekelec customers only. This section
describes how to log into the Tekelec Customer Support site and locate a document. Viewing the document
requires Adobe Acrobat Reader, which can be downloaded at www.adobe.com.
1. Log into the Tekelec Customer Support site.
Note: If you have not registered for this new site, click the Register Here link. Have your customer
number available. The response time for registration requests is 24 to 48 hours.
2. Click the Product Support tab.
3. Use the Search field to locate a document by its part number, release number, document name, or
document type. The Search field accepts both full and partial entries.
4. Click a subject folder to browse through a list of related files.
5. To download a file to your location, right-click the file name and select “Save Target As”
11
Chapter 2: Understanding Report Server Platform
Topics:
•
RSP Overview
•
RSP Components
•
Acronyms
12
RSP Overview
The Report Server Platform (RSP) enables PIC users to configure, generate, view, and store reports and
analytic documents. RSP uses a combination of PIC components and a dedicated Report Server for report
processing.
RSP includes three Web-based applications, all of which are accessible through the NSP Portal:
• Report InfoView (for scheduling queries and viewing reports)
• Report Administrator (for configuring KPI sessions used for reporting)
• Reference Data Application (for configuring analytic reference data)
The Centralized Configuration Manager (CCM) application of NSP is also used to configure certain components
of RSP (for example, registering the report server).
Internet Explorer 7 is the recommended browser for use with the RSP.
For tasks performed in the administration of RSP, see Summary of Tasks and Access Privileges.
Note: For the reports, NSPBusinessUsers have View privileges and NSPBusinessPowerUsers have View and
Schedule privileges. For configuration access privileges, see Chapter 4: Administering the Report Server
Platform.
RSP Components
The Report Server Platform includes the following applications:
• Report InfoView
• Report Administrator
• Reference Data Application
The Report InfoView application uses the Business Objects Enterprise Web Intelligence interface. This help text
addresses the following:
• Viewing, scheduling and configuration of analytics packages
• Report administration
Acronyms
Acronym
Definition
BOE
Business Objects Enterprise
CDR
Call Detail Record
CCM
Centralized Configuration Management
13
FTP
File Transfer Protocol
IMF
Integrated Message Feeder
IP
Internet Protocol
IXP
Integrated XDR Platform
KPI
Key Performance Indicator
NSP
Network Software Platform
PIC
Performance Intelligence Center
PPS
Post Processing Service
RDA
Reference Data Application
RS
Report Server
RSP
Report Server Platform
XDR
X Data Record, Generic term for CDR, IPDR, SUDR
Table 1: Acronyms for Report Server Platform
14
Chapter 3: Using ReportInfoView
Topics:
•
Overview
•
Accessing the Network Intelligence Reports
•
Working with Web Intelligence Reports
15
Overview
The section describes how you can schedule, generate, view, refresh, and export reports using the Report
InfoView application.
To schedule/view a report, open the Report InfoView application and select the report. The system prompts for
the filtering criteria for the report. After you enter the filtering criteria, the system generates the report by
querying the database and presents the report on the screen and in a printable format. The generated reports
are interactive and can be expanded to view hidden report sections by "drilling down" to more detailed views.
You can specify different search criteria to modify the report as well as launch ad-hoc reports. Report data can
also be exported to a variety of other data formats.
Accessing the Network Intelligence Reports
To access the reports:
1. Log in to NSP using your User ID and password. The
Application board is displayed.
Note: NSP only supports versions of IE 7.0 or later and Firefox 3.6 or later. Before using NSP, turn off the
browser pop up blocker for the NSP site.
2. Click the Report InfoView icon in the Application group.
Note: If you are logging on for the first time you will receive a login error. When this occurs, manually log in
from the InfoView Login Page. After successfully logging in once, clicking Report InfoView on the
Application group will bypass the Login Page after that.
3. From the Report InfoView home page, select Document List.
4. In the left frame, click the plus symbol to expand the Public Folders, and then click the plus symbol to
expand the desired analytics folder.
5. Click the sub-folder for the type of analytics you want to open, or double-click the corresponding folder in the
right panel.
The list of reports is displayed.
Working with Web Intelligence Reports
The Web Intelligence interface allows you to view, schedule, and run reports as well as work through the report
data in detail.
Navigating the Web Intelligence Reports
After selecting the report package folder in the InfoView page, the report list for that package is displayed.
16
Column Header
Title
Last Run
Type
Owner
Instances
Description
Name of the specific report type.
Most recent date this type of report was run.
Web Intelligence Report.
User who scheduled the report.
Number of instances for this type of report in the report database.
Table 2: Columns in the Report List
Figure 1: Web Intelligence Report List
See Understanding the Right-Click Menu, and Viewing the Web Intelligence Reports. Also, click the Help icon in the
upper right section of the page to access Business Objects Intelligence on-line help.
Understanding the Right-Click Menu
Right-clicking on a report displays a menu with options that are key to using the reports. This menu has the following
options:
Option
Explanation
View Latest Instance
Displays the most recent instance of the report
Properties
Displays properties of the report, including Title; ID; File Name; Description;
Keywords; Dates Created, Modified, and Last Run; and Locale
Categories
Custom groupings for organizing objects in Business Objects Enterprise
View
Displays the report (as opposed to the report instance)
Schedule
Displays prompts for scheduling a report.
History
Displays list of previous reports
New: InfoView Page Layout
Enables you to set up a custom page including objects, Web addresses,
headers, and footers
17
New: Analytic
N/A
New: Web Intelligence
Document
N/A
Add
N/A
Organize
Provides options to copy a report and make a shortcut to a report for ease in
organizing your report lists
Table 3: Right-Click Menu Options
For more specific use of these options, click the Help icon
access the Business Objects Enterprise on-line help.
in the upper right section of the page to
Viewing the Web Intelligence Reports
To view a report, go to step 1. To view a report instance, go to step 2.
1. To view an instance of a report, either double click the report name or right-click the report name and select
View.
The Report Parameters page is displayed. This page contains the Report Description and a table with
Report Prompts and Values Entered from the original report. Go to Step 2
2. To view a report instance, double-click the report name or right-click the report name and select View Latest
Instance.
This page contains the Report Description and a table with Report Prompts and Values Entered from the
most recent report. Go to the next step.
3. Click the tab labeled with the report name or click the report name in the left frame (if the left frame is set to
Navigation Map).
The full report or report instance is displayed. For a description of each report, see the documentation for
that report package.
Note: The Drill Filters at the top of the report table may limit the data that is displayed even though the report
execution retrieved all the data. If you need to see all the fields returned, set the Drill Filters to All Values
and then filter as needed based on the specific report.
Note: Icons at the bottom of the left frame enable you to switch form Navigation Map to User Prompt Input
views.
4. For help with icons, menus, and other features specific to Web Intelligence, click the Help icon in the upper
right section of the page.
Business Objects Enterprise on-line help is displayed.
Scheduling Web Intelligence Reports
Scheduling a report causes the report to execute as a job at a specified time. The report job results are saved in
BOE and are accessible from the report History.
Any report (whether scheduled, viewed, or refreshed) can be saved to a local file on your computer. For more
information about saving reports see Saving and Forwarding Web Intelligence Reports.
To schedule a report:
1. From the Reports Page, right click the report you want to schedule and select Schedule.
18
2. Fill in prompts that are applicable to the report type you are running.
3. Click Schedule. Once you see Success displayed, you can view the new document.
Note: This should take no more than a few seconds.
You can use ProTrace to create a query for sessions that match your criteria for the report prompts to verify
there is data available for your parameters. See the ProTrace Users Guide for more information.
Note: Only users with the privilege of NSPBusinessPowerUsers can schedule reports.
Figure 2: Schedule Page
Note: If you are prompted to "Block potentially unsafe components from being run? (Recommended)" at any
point, decline by clicking "No" in the "Warning - Security" popup. Clicking "Yes" could result in an inability to view
report results.
For more detailed help in scheduling or responding to prompts, click the Help icon in the upper right section of
the page to access Business Objects Enterprise on-line help.
Refreshing Web Intelligence Reports
Refreshing a report fetches and displays the latest data. A report that is refreshed can be stored on your hard drive.
Any report (whether scheduled, viewed, or refreshed) can be saved to a local file on your computer. Note: Only users
with the privilege of NSPBusinessPowerUsers can schedule or refresh reports.
19
Figure 3: Sample Refresh Dialog
The prompt dialog as seen in Figure 3: Sample Refresh Dialog is a sample of what is displayed when you click the
Refresh All icon in a report view. The prompts vary, depending on the type of report. (Prompts are also used in
scheduling reports.)Note: After a report is run, the Drill Filters at the top of the report table may limit the data that is
displayed even though the report execution retrieved all the data. If you need to see all fields returned, set the Drill
Filters to All Values and then filter as needed based on the specific report.
For more detailed help in refreshing reports, click the Help icon in the upper right section of the page to access
Business Objects Enterprise on-line help.
Viewing Previously Run Web Intelligence Reports
To view previously run Web Intelligence Reports, right-click the report name in the Report List and select
History. The History page is displayed with options to filter the list of previously run reports. From the History
page, you can view the status and results of any report.
For more detailed help in viewing the history of reports, click the Help icon in the upper right section of the page
to access Business Objects Enterprise on-line help.
Using Drill Filters in Web Intelligence Reports
Drill Filters enable you to change the view of the report such that only certain values are displayed.
20
Figure 4: Drill Filters Toolbar
Filtering Options for reports are explained in detail in the documentation for each report package.
Note: The Drill Filters at the top of the report table may limit the data that is displayed even though the report
execution retrieved all the data. Set the Drill Filters to All Values and then filter as needed based on the specific
report.
Also, for help specific to using the Web Intelligence Reports click the Help icon in the upper right section of the
page.
Using the Drill Feature in Web Intelligence Reports
You can drill down or up by Time in the reports. For example, you can click any cell item that is underlined to drill
down from the week view to the day view; and you can drill down from the day view to the hour view. From the
lower levels, you can drill up by clicking the up arrow in the Day or Week column.
Note: This feature is not available in all reports.
Linking to Detailed Records in ProTrace
You can view the detailed records in ProTrace for each report.
1. In the Report View, click the report tab with the report name.
The report is displayed.
2. Click View Details on the right side of the page, just above the report table.
ProTrace is opened to the detailed records for the current report. See the ProTrace User Guide
for information about ProTrace.
Note: If the report was executed far enough in the past (weeks), the original detail records might
have expired according to the configured lifetime for the protocol session.
Note: The View Details link to ProTrace is not available on all report views. It is generally
available only on the first tabular report view. Also, it will only produce detailed records for the
Hour table.
Saving and Forwarding Web Intelligence Reports
You can save Web Intelligence Reports and Sub-Reports to InfoView folders or to your computer. A
high-level view of available options is provided here. For more detailed help in saving and forwarding
Web Intelligence Reports, click the Help icon in the upper right section of the page to access
Business Objects Enterprise on-line help.
Select the Document menu and choose one of the following options:
Option
Explanation
Save as
Saves to InfoView folders and categories
Save to my computer as
Save report to my computer as
Saves a file containing all Sub-Reports to your computer
Saves the currently selected Sub-Report to your computer
21
Table 4: Save Options in Document Menu
You can forward Web Intelligence Reports to various locations, as explained below. Select the
Send To menu and choose one of the following options. Clicking any option displays a
summary page with options to use default settings or to generate your own.
Option
Explanation
Business Objects Inbox
Sends report to the inbox shown on the InfoView Home page
Email
Not configured for use
FTP Location
Not configured for use
File Location
Not configured for use
Table 5: Options in Send to Menu
22
Chapter 4: Administering the Report Server Platform
Topics:
•
Overview
•
Accessing the Necessary Tools for Configuring Reports
•
Registering the Report Server
•
Managing Report Packages
•
Managing Reporting Sessions
•
Defining User Access
23
Overview
Administering the Report Server Platform (RSP) involves registering the report servers in the NSP database,
activating report packages in network views, managing reference data, defining system parameters and limits,
and assigning user access privileges. The following sections explain the tasks, the tools, and prerequisites for
RSP administration.
Summary of Tasks and Access Privileges
This section explains what must be done to administer RSP. See Table 6: Report Manager Tasks, Tools, and
User Groups for tasks involved, the tools used to perform these tasks, and the user groups associated with
these tasks.
Report Administrative Task
Tool Used
User Group
Add (register) the report server
Centralized Configuration Manager
(CCM)
nspPowerUsers
Activate a report package for a
session.
Report Administrator
nspAdmin
Define user rights
Security (NSP) and Central
Management Console
(BusinessObjects Enterprise)
nspAdmin
Manage reference data for
Carriers and Carrier Categories
CCM
nspPowerUsers
Manage reference data for
Directions and Direction
Categories
CCM
nspPowerUsers
Schedule reports
Report InfoView
nspBusinessPow
erUsers
Table 6: Report Manager Tasks, Tools, and User Groups
Prerequisites
The following are prerequisites for the instructions in this chapter:
• The RSP software suite must be installed on the NSP, IXP, and Reports servers.
• The following components must be installed:
• NSP, which includes InfoView and Report Administrator
• IXP, which includes Post Processing Service (PPS)
• Business Objects Enterprise (BOE). The BOE XI R3.1 installation installs on the Report Server, which is
a data warehouse for storing data. This product contains a Web server, report execution tools, and a
scheduler.
24
•
BOE contains the internal User Group NSPBusinessUsers and NSPBusinessPowerUsers, which are defined
during installation. These are mapped to the NSP Groups with like names.
Accessing the Necessary Tools for Configuring Reports
The subsections below explain how to access the tools needed for configuring reports. See Table 6: Report
Manager Tasks, Tools, and User Groups for tasks, related tools, and user groups.
Accessing NSP Tools: CCM and Report Administrator
Log in to NSP using the login procedure in the NSP Platform Guide. The NSP Application board is displayed.
From the Application board, click one of the following:
• For functions performed in CCM, click Centralized Configuration.
• For functions performed in Security, click Security.
• For functions performed in Reference Data Application, click Reference Data Application.
• For functions performed in Report Administrator, click Report Administrator.
Note: For the functions performed in each tool or application mentioned above, see Table 6: Report
Manager Tasks, Tools, and User Groups.
Accessing the Report Server
Access the Central Management Console (CMC) Web application from the following:
http://<report-server-host>:8080/CmcApp
where <report-server-host> is the IP address of the host.
Registering the Report Server
All servers in NSP have to be registered in the Centralized Configuration Manager (CCM) database prior to
discovery by CCM.
You can register report servers in CCM using the Equipment Registry function to name the report server
(logical) and its host. You must have the IP address of the host and it must reside in the NOC portion of the Site
Registry.
For detailed instructions on registering a report server or modifying its information, see Centralized
Configuration Manager Administration Guide.
Note: You must have the user profile nspPowerUser to use CCM.
25
Managing Report Packages
The PIC system supports the partitioning of customer networks into zones and sub-zones for ease of use. The
zones are called "Network Views." A network view can be based on geographical areas or other configurations,
such as traffic to and from carriers or partners.
The report package must be applied to a Network View for the report data to be generated and made available
for reports. Report packages are applied in Report Administrator.
Note: To manage a report package, you must have the role of nspAdmin.
Activating a Report Package
To activate a Report Package for a Network View, perform the following steps:
1. Log in to NSP as nspAdmin, using the login procedure in the NSP Platform Guide. The NSP
Application board is displayed.
2. Click Report Administrator.
3. From the Report Administrator home page, click the appropriate Network View in the left panel.
The Report Package Distribution and Session tables are displayed in the right panels of the screen.
The column headers in the Report Package Distribution Table are explained in Table 7: Columns in Report
Package Distribution Table.
Column Header
Description
Name
Name of the Report Package
Description
Brief explanation of what the Report Package covers
Version
Version of the Report Package
Application
NA (for internal use)
Owner
NA (for internal use)
State
NA (Reserved for future use.)
Creation Time
Date the Report Package was created
Table 7: Columns in Report Package Distribution Table
The column headers in the Sessions table are explained in Table 8: Columns in List of Sessions Table
Note: Sessions are the database tables that store the data generated by the IXP system. Sessions are
created and defined in the Central Configuration Manager.
26
4. Click the check box by each Session you want to activate.
Column Header
Description
Check Box
Box used to identify the item(s) to which the action will apply.
Session Name
Unique name given to the session in CCM.
Protocol
Type of network and how the data is transmitted, represented,
and authenticated.
PPS Server
Name of the host that will execute the Post Processing
Service (PPS)
Output KPI Name
Name of the output session
KPI Lifetime
The amount of time in weeks that data is retained in the KPI
session before purging
Bundles
Reserved for internal use. The default is for bundles not to be
visible.
Table 8: Columns in List of Sessions Table
5. Use the drop-down lists to select the PPS Server (if applicable), Output KPI Name, and KPI Lifetime; then
click the green Activate icon.
The Summary of Report Package Distribution table is displayed, showing the changes.
Note: The PPS Server drop-down may be disabled if it is not applicable to the report package. You may
need to contact Tekelec to identify the correct server to select. For information about contacting Tekelec see
Customer Care Center.
Setting the RS Parameters for Data Retention
The Report Administrator allows you to create output KPI sessions that contain 15 or 30 minute records.
KPI aggregation is managed by the system automatically. KPI aggregation will automatically aggregate KPIs in
an hourly, daily, weekly, quarterly, monthly and yearly manner. For example, hourly aggregation will aggregate
the KPIs generated by the platform for the given hour and store them into a corresponding hourly session.
Similarly, daily aggregation will again aggregate the KPIs generated hourly and store them into a corresponding
daily session, and so on up to a yearly aggregation for up to ten years.
You can use the Report Administrator to set the data retention times for automatically created KPI sessions.
To configure the data aggregation does the following:
1. From the Report Administrator home page select Configuration > RS parameters. The RS
parameters page is displayed.
2. Use the pull-down to select the retention period for the desired time aggregate.
27
3. Select the Agg Monitor Retention Period using the pull-down. This parameter controls data retention for
diagnostics data that is logged in the database. This information is displayed in a report named Aggregation
Monitor Report found in the Data Aging folder.
4. Select the Logging check box to activate/deactivate logging to the Aggregation Monitor Report.
5. Click Modify when done.
Note: The Beginning of the Week parameter is for information only, and is set during installation.
Setting the PPS Parameters
The Post Processing Service (PPS) parameters can be set using the Report Administrator. Follow these steps
to set the PPS parameters:
1. From the Report Administrator main menu, mouse over Configuration at the top of the page and select
PPS Parameters.
The System Parameters window opens.
2. Scroll down the list of parameters and adjust the values accordingly.
3. When done click the Modify button.
4. You can also select Reset to reset all the parameters to the previous values.
5. Select the Close button when done.
Viewing a Report Package Configuration
To view the configuration of a report package, simply click on the report in the Report Package Distribution
table.
The list of Sessions for that report is displayed in the List of Sessions Table below.
Removing a Report Package from a Network View
1. Perform steps 1-3 in "Activating a Report Package."
2. Click the check box by each Session you want to remove.
3. Click the red Deactivate icon. The Summary of Report Package Distribution table is displayed, showing the
changes.
Reconfiguring a Network View
Reconfiguring a Network View can involve adding, modifying, or deleting Sessions as well as organizing
Sessions and Views. Centralized Configuration Manager (CCM) is used for reconfiguring a Network View. CCM
notifies the Report Administrator application, which performs the necessary back-end operations to apply the
new data.
For instructions on working with Network Views and Sessions, see Centralized Configuration Manager
Administration Guide.
28
Managing Reporting Sessions
When the Report Package is applied to a Network View, the Sessions are implicitly associated with a
Consolidated View. A Consolidated View is the logical union of associated Session tables in the Report Server
database. A Consolidated View is used as the source of data for a set of reports. The Session tables are created
and populated by Post Processing Service (PPS) processes on various IXP subsystems. Reports retrieve data
from tables in the Consolidated View.
Dissociating an Output Session from a Report
If the you do not want to include a particular Session's data (KPIs) in a report, the you can dissociate that data
from the Consolidated View. The Reporting Sessions function enables you to explicitly remove a Session as
well as re-associate the Session at a later time. Re-association can only occur if the Session has been
dissociated temporarily. The following instructions explain how to perform these tasks.
1. In the Report Administrator menu toolbar, select Sessions > Reporting Sessions.
The Reporting Sessions window is displayed, showing existing associations.
Note: You can sort on the Consolidated View column by clicking on the Consolidated View column header.
Column Header
Description
Consolidated View
Report Server Platform database view that contains a logical
union of multiple Output Sessions
Output Session Name
Name of the database table that stores the output (KPIs)
generated by the PPS engine.
Associated with Reporting
Indicator (Y or N) as to whether the Session is associated with
the Consolidated View report.
Report Server
Specifies which report server is associated with the session.
Table 9: Columns in Reporting Sessions Table
The columns for the Reporting Sessions window are:
2. Select the check box for the appropriate Session and click Add, Remove, or Permanently Remove.
a) Add -- The session is re-associated with a report package.
b) Remove -- The session is temporarily dissociated from the report package.
c) Permanently Remove -- The session is permanently dissociated from the report package.
The session cannot be re-associated with that report package.
A message is displayed above the table confirming that the Association was successfully updated. Also,
the Y or N is toggled in the Associated with Reporting column.
29
Removing an output session from the Database
Deleting a session from the database removes the session forever, meaning no reports can display that data
again. To delete a session from the database, perform the following steps:
1. Permanently dissociate the session from the report package by following steps in "Dissociating an Output
Session from a Report" and selecting Permanently Remove inClick Home to exit Report Administrator. You
are redirected to the Application board..
2. Click Home to exit Report Administrator. You are
redirected to the Application board.
3. Click Centralized Configuration.
The Centralized Configuration Management page is displayed. NOTE: You must have the nspPowerUser
profile to access Centralized Configuration.
4. Click Mediation > Sessions.
5. Click the check box for the Session you want to remove from the database.
6. Click the icon to Delete Session. A dialog is displayed
to confirm the deletion.
7. Click OK in the confirmation dialog box. The
session is removed from the database.
Defining User Access
Part of administering the Report Server Platform is managing User access privileges in NSP and Business
Objects Enterprise.
Setting Up User Accounts on PIC
For details about setting up user accounts and defining roles in PIC, see NSP Security Online Help.
Levels of Access for Report Server Platform
In BOE, rights are assigned to report objects and folders containing them. Rights for these are assigned to
specific Groups and Users. Users in a Group inherit the Group's rights. Report objects within a folder inherit the
folder's rights.
Table 10: Access for RSP Reports explains the different levels of Group access for the RSP reports:
30
Administering the Report Server Platform
Report Server Platform User Guide
Level of Access
Explanation
IAS-View
Associated
Group
nspUser
Can view the instance of a
report object.
IAS-Schedule
Can view, generate, delete, and nspPowerUser
pause report instances that they
initiated. Can also send reports
to destinations, set report
parameters, refresh report data,
format reports, and schedule
reports for future runs.
IAS - Copy Installed Allows access to copy installed nspManager
Reports
report documents to the User
Content folder.
nspManager
IAS - Reports
Access to create and modify
Creation
Web Intelligence Reports.
Associated Role
NSPBusinessUsers
NSPBusinessPowerUsers
NSPBusinessManagers
NSPBusinessManagers
Table 10: Access for RSP Reports
910-5955-001 Revision A, June 2011
31