1
Appendix
D
μC/Trace Triggers Control
μC/Trace is a runtime diagnostics tool for embedded software systems based on μC/OS-III.
μC/Trace gives developers an unprecedented insight into the runtime behavior, which
allows for reduced troubleshooting time and improved software quality, performance and
reliability. Complex software problems which otherwise may require many hours or days to
solve, can with μC/Trace be understood quickly, often in a tenth of the time otherwise
required. This saves you many hours of troubleshooting time. Moreover, the increased
software quality resulting from using μC/Trace can reduce the risk of defective software
releases, causing damaged customer relations.
The insight provided by μC/Trace also allows you to find opportunities for optimizing your
software. You might have unnecessary resource conflicts in your software, which are "low
hanging fruit" for optimization and where a minor change can give a significant
improvement in real-time responsiveness and user-perceived performance. By using
μC/Trace, software developers can reduce their troubleshooting time and thereby get more
time for developing new valuable features. This means a general increase in development
efficiency and a better ability to deliver high-quality embedded software within budget.
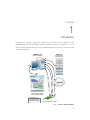
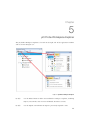
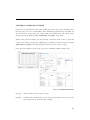
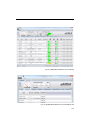
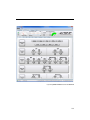
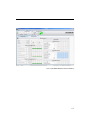
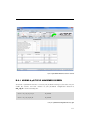
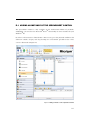
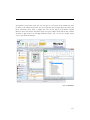
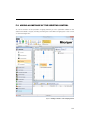
μC/Trace provides more than 20 interconnected views of the runtime behavior, including
task scheduling and timing, interrupts, interaction between tasks, as well as user events
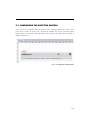
generated from your application as shown in Figure D-1. μC/Trace can be used side-by-side
with a traditional debugger and complements the debugger view with a higher level
perspective, ideal for understanding the complex errors where a debugger’s perspective is
too narrow.
μC/Trace is more than just a viewer. It contains several advanced analyses developed since
2004, that helps you faster comprehend the trace data. For instance, it connects related
events, which allows you to follow messages between tasks and to find the event that
triggers a particular task instance. Moreover, it provides various higher level views such as
the Communication Flow graph and the CPU load graph, which make it easier to find
anomalies in a trace.
117