1
XLReportGen
User Manual
Version 5.2
2014-04
Copyright© 2014 LJZsoft Corporation
All rights reserved
Contents
CHAPTER 1 INTRODUCTION ........................................................................................................... 1
1.1 OVERVIEW ...................................................................................................................................... 1
1.2 FEATURES ....................................................................................................................................... 1
CHAPTER 2 INSTALLATION AND STARTUP ............................................................................... 5
2.1 SOFTWARE REQUIREMENTS ............................................................................................................ 5
2.2 INSTALLING XLREPORTGEN .......................................................................................................... 5
2.3 UNINSTALLING XLREPORTGEN ..................................................................................................... 5
2.4 COMMAND LINE ............................................................................................................................. 5
CHAPTER 3 QUICK START ............................................................................................................... 7
3.1 LEARNING HOW TO USE XLREPORTGEN......................................................................................... 7
3.2 SAMPLE DATABASE ........................................................................................................................ 7
3.3 STEPS OF REPORTING ...................................................................................................................... 8
3.4 MY FIRST REPORT .......................................................................................................................... 9
3.4.1 Creating a report template ..................................................................................................... 9
3.4.2 Creating an XRF file ............................................................................................................ 10
3.4.3 Configuring the report ......................................................................................................... 10
3.4.4 Inputting a function .............................................................................................................. 10
3.4.5 Understanding the function .................................................................................................. 11
3.4.6 Running an XRF file ............................................................................................................. 11
3.4.7 Opening a report .................................................................................................................. 11
3.4.8 Modifying the report template .............................................................................................. 12
3.4.9 Modifying the function ......................................................................................................... 12
3.4.10 Generating the report again............................................................................................... 13
3.5 SAMPLES ....................................................................................................................................... 13
CHAPTER 4 REPORT TEMPLATES .............................................................................................. 15
-I-
4.1 ABOUT REPORTS........................................................................................................................... 15
4.2 ABOUT REPORT TEMPLATES ......................................................................................................... 15
4.3 EXCEL BASIC CONCEPTS .............................................................................................................. 15
4.3.1 Workbooks and Worksheets ................................................................................................. 15
4.3.2 Ranges .................................................................................................................................. 16
4.3.3 Formulas .............................................................................................................................. 16
4.3.4 Names................................................................................................................................... 16
4.3.5 Headers and Footers ............................................................................................................ 16
4.3.6 Page Breaks ......................................................................................................................... 17
4.3.7 Drawings, Pictures and Diagrams ....................................................................................... 17
4.3.8 Charts................................................................................................................................... 17
4.3.9 Formatting ........................................................................................................................... 17
4.4 TABLE REPORTS ........................................................................................................................... 18
4.4.1 About Table Reports............................................................................................................. 18
4.4.2 Creating a Worksheet for a Fixed Table Report .................................................................. 19
4.4.3 Creating a Worksheet for a Variable Table Report ............................................................. 19
4.4.4 Formatting Cells for Pictures .............................................................................................. 20
4.5 CHARTS ........................................................................................................................................ 22
4.5.1 About Charts ........................................................................................................................ 22
4.5.2 Creating a Blank Chart ........................................................................................................ 22
CHAPTER 5 REPORTING WITH XLREPORTGEN ..................................................................... 23
5.1 CREATING AND OPENING XRF FILES............................................................................................ 23
5.1.1 About XRF files .................................................................................................................... 23
5.1.2 Create a new XRF file .......................................................................................................... 23
5.1.3 Open an XRF file.................................................................................................................. 23
5.1.4 Save an XRF file................................................................................................................... 23
5.2 CONFIGURING FILES ..................................................................................................................... 24
5.2.1 About files ............................................................................................................................ 24
- II -
5.2.2 Configuring file information ................................................................................................ 24
5.2.3 Converting files .................................................................................................................... 25
5.3 CONFIGURING DATA SOURCES ..................................................................................................... 25
5.3.1 About data source ................................................................................................................ 25
5.3.2 Adding, modifying and deleting a data source ..................................................................... 25
5.4 CONFIGURING PARAMETERS ......................................................................................................... 26
5.4.1 About parameters ................................................................................................................. 26
5.4.2 Adding, modifying and deleting a parameter ....................................................................... 27
5.5 INPUTTING FUNCTIONS ................................................................................................................. 28
5.6 RUNNING XRF FILES .................................................................................................................... 28
5.6.1 Windows mode ..................................................................................................................... 29
5.6.2 Command line mode............................................................................................................. 29
5.7 USING EXCEL FORMULAS ............................................................................................................. 30
5.8 SORTING, GROUPING AND TOTALING ........................................................................................... 33
5.8.1 Sorting data .......................................................................................................................... 33
5.8.2 Totaling ................................................................................................................................ 33
5.8.3 Grouping data and subreports ............................................................................................. 34
5.8.4 Subtotaling ........................................................................................................................... 34
5.9 CHARTING .................................................................................................................................... 36
5.10 PICTURES .................................................................................................................................... 38
5.10.1 Inserting pictures into a report template ............................................................................ 38
5.10.2 Inserting pictures into a report .......................................................................................... 39
5.11 USING PARAMETERS ................................................................................................................... 40
5.12 PROGRAMMING ........................................................................................................................... 43
5.12.1 Making XRF files programmatically .................................................................................. 43
CHAPTER 6 FUNCTION REFERENCE .......................................................................................... 45
6.1 REPORT FUNCTION ....................................................................................................................... 45
6.2 NAME FUNCTION .......................................................................................................................... 54
- III -
6.3 EXECSQL FUNCTION .................................................................................................................... 55
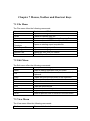
CHAPTER 7 MENUS, TOOLBAR AND SHORTCUT KEYS ........................................................ 57
7.1 FILE MENU ................................................................................................................................... 57
7.2 EDIT MENU ................................................................................................................................... 57
7.3 VIEW MENU .................................................................................................................................. 57
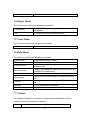
7.4 REPORT MENU .............................................................................................................................. 58
7.5 TOOLS MENU ................................................................................................................................ 58
7.6 HELP MENU .................................................................................................................................. 58
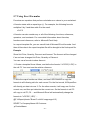
7.7 TOOLBAR ...................................................................................................................................... 58
7.8 SHORTCUT KEYS .......................................................................................................................... 59
CHAPTER 8 HINTS AND TIPS ......................................................................................................... 61
CHAPTER 9 XRF FILE REFERENCE ............................................................................................. 65
9.1 XRF FILE FORMAT ....................................................................................................................... 65
9.2 [DATA SOURCE] SECTION ............................................................................................................. 66
9.3 [FILE] SECTION ............................................................................................................................ 68
9.4 [PARAMETER] SECTION ............................................................................................................ 69
CHAPTER 10 LICENSE AND SUPPORT ........................................................................................ 71
10.1 LICENSE ...................................................................................................................................... 71
10.2 TECHNICAL SUPPORT .................................................................................................................. 72
- IV -
Chapter 1 Introduction
1.1 Overview
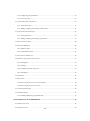
XLReportGen is a report generator for Microsoft Excel that outputs reports in
Microsoft Excel spreadsheet format. If you know how to use Microsoft Excel
and write SQL statements, you can use XLReportGen to create all kinds of
reports as you need.
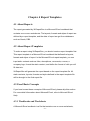
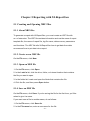
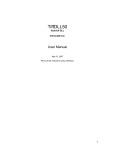
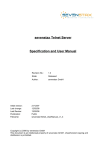
To create a report,
XLReportGen need to read a
Report
Template
report template file and an XRF
XLReportGen
Report
file. The report template file is a
SQL
Microsoft Excel workbook that
defines the layouts and formats
Database
of a report. The XRF file
contains SQL statements and some information, and tells XLReportGen how
to get data from database and how to put data into a report. XLReportGen
creates a blank report using the report template file, executes SQL statements
in the XRF file, and puts the data from database into the report.
1.2 Features
XLReportGen includes the following features:
Using Microsoft Excel as your reporting tool
Just use Microsoft Excel as your reporting tool. You design reports like layouts,
formats and styles directly using Microsoft Excel. And you will get reports in
Microsoft Excel spreadsheet format as a result. Microsoft Excel is powerful,
flexible and familiar. You do not need to buy and learn extra reporting tools.
-1-
Making report template directly using Microsoft Excel
The main advantage of using XLReportGen is based on the fact that all
formatting is done directly in Microsoft Excel. You can take advantage of
Microsoft Excel including cell formatting, formulas, drawing and pictures,
charts, multiple sheets, page setup, headers and footers, and more.
Manipulating Excel reports with OpenXML SDK
Open XML is an open file format for the core document-oriented Office
applications. It facilitates document creation and manipulation in server
environments where you do not need to install the Office client applications.
Accessing to data using SQL
XLReportGen executes SQL statements to extract data from database.
Supports all type SQL: DML, DDL and DCL. Multiple SQL statements can be
executed in one report building process. You can perform queries on
databases, insert data into databases, and create database objects like tables.
The power of SQL can be harnessed for maximum efficiency in reporting.
Creating reports without programming experience
If you know how to use Microsoft Excel and how to write SQL, it is enough. It
does not require programming to create reports.
Connection to databases using ADO.Net
Using ADO.NET to connect to databases, XLReportGen is independent of
database systems. It can access to almost all of databases such as Oracle,
DB2, Sybase, Informix, Microsoft SQL Server, Teradata, MySQL, Microsoft
Access and dBase through OLE DB and ODBC.
Supporting multi-databases in one report
XLReportGen supports multi-databases in one report. You can get data from
some different databases such as Oracle, DB2 and Microsoft SQL Server, and
put these data into one report.
Generating reports with parameters
-2-
XLReportGen enables you to create reports with parameters. You may use
parameters in SQL statements. You will be asked to input the values of
parameters while creating reports.
Supporting Windows mode and command line mode
XLReportGen supports command line mode. So it is possible to call
XLReportGen from other program. For developers, you can integrate
XLReportGen into your application.
Creating complex reports
You can create complex reports. The complexity might come from report
formatting as well as report content.
Creating reports with charts
XLReportGen enables you to include sophisticated, colorful charts in your
reports. You can use charts any time you want to improve the usefulness of a
report.
Creating reports with pictures
XLReportGen can insert pictures from the graphics files, position and size the
pictures according to your instruction.
Many reports in one Microsoft Excel workbook
One Microsoft Excel workbook may contain many reports. You can generate a
book of reports in one generating process.
Generating reports automatically
The process of report generation can be fully automated, periodically or on
events. XLReportGen can be scheduled with Windows Scheduled Tasks or
other tools.
One time configuration
With one time configuration, you can repeatedly generate reports especially
periodic reports such as daily, weekly, monthly and annual reports.
Flexible deployment
-3-
XLReportGen can be run on your desktop or server.
-4-
Chapter 2 Installation and Startup
2.1 Software Requirements
Supported Operating System:
Microsoft Windows XP, Windows Server 2003, Windows Vista, Windows
Server 2008, Windows 7 or later.
This software requires the following:
Microsoft .NET Framework 4.
Open XML SDK 2.5 for Microsoft Office.
2.2 Installing XLReportGen
Run the installation program, and follow the instructions to complete
XLReportGen installation.
If you don’t have Microsoft .NET Framework 4 installed, please install it first.
If you don’t have Open XML SDK 2.5 installed, please install it first.
2.3 Uninstalling XLReportGen
1. Quit XLReportGen.
2. Double-click the Add/Remove Programs icon in the Windows Control
Panel.
3. Click XLReportGen in the Currently installed programs box, and then
click the Change/Remove button.
4. Follow the instructions on the screen to complete uninstalling the program.
2.4 Command Line
XLReportGen can be run in Windows mode or command line mode. The
-5-
syntax of command is:
excelreport <xrf file name> [-C] [-D] [-I interval] [-U1 user1] [-P1 pwd1] …
[-U10 user10] [-P10 pwd10] [pa1 pa2 … pa10]
xrf file name
Specifying an XRF (.xrf) file that tells XLReportGen how to get
data from data sources and how to put data into a report.
-C
Run XLReportGen in command line mode.
-D
Display the generated report with Microsoft Excel.
-I interval
Log the processing records message. If interval is greater than
1, it is the interval of records. If interval is less than 1, it is the
percent of interval.
-U1 user1 …
Specify the user names. user1 is the user name of the first
-U10 user10
data source. user2 is the user name of the second data
source……
-P1 pwd1 ...
Specify the passwords. pwd1 is the password of the first data
-P10 pwd10
source. Pwd2 is the password of the second data source……
pa1 … pa10
The values of parameters defined in the XRF file. You can use
parameters in SQL statements. XLReportGen will replace the
names of parameters in a SQL statement with the actual
values before it executes the SQL statement. You can use no
more than 10 parameters in one report.
For example, you have defined two parameters in your XRF file. The first
parameter is the sales date, and the second is the category of product. You
can run XLReportGen in command line mode as follows:
excelreport c:\excelreport\myreport.xrf -c 1996-05-01 “Dairy Products”
-6-
Chapter 3 Quick Start
3.1 Learning how to use XLReportGen
You can teach yourself how to use XLReportGen by choosing from the
methods available in this section:
You can study the sample reports and sample database included with
XLReportGen.
You can use the detailed descriptions and instructions in the “My First
Report”.
3.2 Sample Database
XLReportGen comes with Sample.mdb, a sample database you can use when
learning the program. Sample.mdb is a Microsoft Access database. Virtually all
of the examples in this manual are based on Sample.mdb data.
The sample reports access to the sample database through the ODBC data
source name “Report Sample”. When you install XLReportGen, you can
choose to add the ODBC data source name. And you also can add the ODBC
data source name manually.
To create the System DSN “Report Sample”, do as follows:
1. Click the Windows Start button, choose Settings, and then click Control
Panel.
2. Double-click Administrative Tools, and then double-click Data Sources
(ODBC). The ODBC Data Source Administrator dialog box appears.
3. Select the System DSN tab, and then press Add button.
4. Choose Microsoft Access Driver (*.mdb), then press Finish button.
5. In the ODBC Microsoft Access Setup dialog box, type Report Sample in
the Data Source Name box.
-7-
6. Press the Select button, and browse to select Sample.mdb.
7. Press OK button to close the ODBC Microsoft Access Setup dialog box.
8. Press OK button to close the ODBC Data Source Administrator dialog
box.
3.3 Steps of Reporting
To create a report with XLReportGen, you should do as follows:
1. Prepare works
Before you create a report, you should determine the layout of report, and
know where and how to get the data.
You must know how to access to the databases you are reporting from. So you
need the data source name, user name and password. If you don’t have data
sources added, please add data sources first. Run ODBC Administrator, you
can add a new data source. For detailed information about configuring ODBC,
refer to ODBC Administrator Help.
2. Make a report template file
Create a report template file using Microsoft Excel. For detailed information
about report template, refer to “Report Templates” in this document.
3. Create an XRF file
Create an XRF file with an .xrf extension using XLReportGen. There are two
steps to create an XRF file.
(1) Configure the report
Define the names of data sources, the name of report template file, the name
of report file and the name of log file. If you want to use parameters in SQL
statements, define these parameters.
(2) Write functions
Write the functions and SQL statements that specify how to get data from data
sources and how to put data into the report.
-8-
For detailed information, refer to “Reporting with XLReportGen” in this
document.
4. Run the XRF file
Run the XRF file to generate a report file. For detailed information about
running report, refer to “Running an XRF File” in this document.
3.4 My First Report
The following tutorial has been designed to guide you to create your first report.
In this tutorial, you will get an introduction to the program as you create a
Customer List report. The Customer List is one of the most basic business
reports and typically has information such as Customer Name, City, Country,
and Contact Name.
3.4.1 Creating a report template
1. Run Microsoft Excel, a new workbook will open.
2. Select the cell A1, type “Customer Name”. In the same way, you input “City”,
“Country” and “Contact Name” into the cells B1, C1 and D1.
3. Format the text of A1, B1, C1 and D1 as you like, including font, font size,
font color, bold, background, alignment and border.
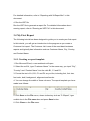
4. You can change the width of these columns. The report template you have
made is as follows:
5. Click Save on the File menu, chose a directory such as “C:\Report”, type
custlist.xlsx in the File name box and press Save button.
6. Click Close on the File menu.
-9-
3.4.2 Creating an XRF file
1. Run XLReportGen.
2. Click New on the File menu.
3. Click Save on the File menu, chose the directory to which you have saved
the report template, type custlist.xrf in the File name box and press Save
button.
3.4.3 Configuring the report
1. On the Report menu, click Configuration. The Configuration dialog box
appears.
2. Click the File tab.
In the Template File box, type custlist.xlsx; In the Report File box, type
Report\custlist.xlsx; In the Log File box, type Log\custlist.log.
3. Click the Data Source tab.
Press New button, the New Data Source dialog box appears. In the Name
box, type Report Sample, press OK button.
4. On the Configuration dialog box, press OK button.
3.4.4 Inputting a function
In the editor windows, input a function as follows:
@F1=Report(sheet=Sheet1 cell=A2)
SELECT CompanyName
,CityName
,CountryName
,ContactName
FROM Customers, Cities, Countries
WHERE Customers.CityCode = Cities.CityCode
- 10 -
AND Customers.CountryCode = Cities.CountryCode
AND Customers.CountryCode = Countries.CountryCode
ORDER BY CompanyName,CityName,CountryName
;
You can test the SQL statement in a query tool such as Microsoft Access or
Microsoft Query.
3.4.5 Understanding the function
Before going any further, let us understand this function.
1. The Report function will execute the SQL statement, get data from data
source, and put data into the report.
2. The sheet argument identifies a worksheet, and the value Sheet1 is the
name of worksheet.
3. The cell argument specifies the cells that the first record will be filled into.
The value is A2. So XLReportGen will fetch the first record, put the value of
CompanyName field into A2, the value of CityName field into B2, the value of
CountryName field into C2, and the value of ContactName field into D2. And
then it will fetch the next record, and put them into A3,B3,C3 and D3……
3.4.6 Running an XRF file
1. On the Report menu, click Run, the Run Report dialog box appears.
2. Press Start button to run the XRF file.
3. XLReportGen will generate a report.
4. After the status is Done, click Close button.
3.4.7 Opening a report
1. On the File menu, click Open Report File to open the report you have
generated.
- 11 -
You can view and check the report.
2. On the File menu, click Open Log File to open the log file that recorded the
log information in the report generating. You can check the log.
3. Close the report file and the log file.
3.4.8 Modifying the report template
1. On the File menu, click Open Template File to open the report template.
2. Change the width of columns. It is very useful to copy some sample data
from the report file into the report template for formatting.
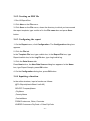
3. Insert a new row on the top, type Customer List as the report title.
4. Add borders for the range “A2:D4”. The external border can be different from
the internal border. The report template you have made is as follows:
5. Save and close the template file.
3.4.9 Modifying the function
In the editor windows, modify the function as follows:
@F1=Report(sheet=Sheet1 cell=A3 rangecount=2)
SELECT CompanyName
,CityName
,CountryName
,ContactName
FROM Customers, Cities, Countries
WHERE Customers.CityCode = Cities.CityCode
AND Customers.CountryCode = Cities.CountryCode
- 12 -
AND Customers.CountryCode = Countries.CountryCode
ORDER BY CompanyName,CityName,CountryName
;
1. Change the value of cell argument because you insert a row.
2. The rangecount argument specifies the number of ranges in the report
template. You have defined two blank ranges in the report template. One row
is one range. If you hope that the format of the last row/column border is
different from the others, you can define two ranges in the report template.
3.4.10 Generating the report again
1. Save the XRF file.
2. Run the XRF file to generate the report.
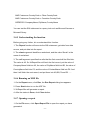
3. Open the report, view and check the report.
The report should now look similar to the following:
Now you have created a report.
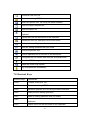
3.5 Samples
After XLReportGen is installed, some sample reports are installed too. Use
these reports to learn XLReportGen. The sample reports can be changed to
adapt to your own needs.
- 13 -
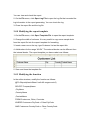
The sample reports include a sample database, some report template files
(.xlsx) and XRF files (.xrf). They are located in the Application Data\LJZsoft
under All Users or your profile folder.
Directory
Description
{commonappdata}\LJZsoft\Common\Sa
Contains the sample database
mpleDatabase
“Sample.mdb”.
{commonappdata}\LJZsoft\XLReportGe
Contains the report template files
n\Samples
(.xlsx) and the XRF files (.xrf).
{commonappdata}\LJZsoft\XLReportGe
Contains the report files (.xlsx)
n\Samples\Report
generated by XLReportGen.
{commonappdata}\LJZsoft\XLReportGe
Contains the log files created by
n\Samples\Log
XLReportGen during generating
report files.
{commonappdata} is the path to the Application Data folder under All Users.
The Application Data folder is usually at:
Windows XP: C:\Documents and Settings\All Users\Application Data\
Windows Vista or later: C:\ProgramData\
- 14 -
Chapter 4 Report Templates
4.1 About Reports
The report generated by XLReportGen is a Microsoft Excel workbook that
contains one or more worksheets. The layouts, formats and styles of report are
defined by a report template, and the data of report are got from databases
such as Oracle, DB2.
4.2 About Report Templates
To make a report using XLReportGen, you should create a report template first.
This report template is a Microsoft Excel workbook that defines the layouts,
formats and styles of report. In the Microsoft Excel report template, you can
input static contents such as titles, descriptions, comments, a cover, a
company logo, format the static content, and define the format of cells you will
fill data into.
XLReportGen will generate the report based on the report template file. All
static contents, layouts, formats and styles defined in the report template file
will be brought to the final report file.
4.3 Excel Basic Concepts
If you have known these concepts of Microsoft Excel, please skip this section.
For more detail information about Microsoft Excel, refer to Microsoft Excel
Help.
4.3.1 Workbooks and Worksheets
A Microsoft Excel workbook is a file that contains one or more worksheets,
- 15 -
which you can use to organize various kinds of related information. You can
enter and edit data on several worksheets simultaneously and perform
calculations based on data from more than one worksheet. When you create a
chart, you can place the chart on the same worksheet as its related data or on
a separate chart sheet.
Worksheet is the primary document that you use in Microsoft Excel to store
and work with data. It also called a spreadsheet. A worksheet consists of cells
that are organized into columns and rows; a worksheet is always stored in a
workbook.
4.3.2 Ranges
A range represents a cell, a row, a column, or a selection of cells containing
one or more contiguous blocks of cells. The cells in a range can be adjacent or
nonadjacent.
4.3.3 Formulas
Formulas are equations that perform calculations on values in your worksheet.
A formula starts with an equal sign (=). A formula can contain any or all of the
following: functions, references, operators, and constants. You can perform
calculations using formulas.
4.3.4 Names
A name is a word or string of characters that represents a cell, range of cells,
formula, or constant value. Use easy to understand names, such as Products
to refer to hard to understand ranges, such as Sales!C20:C30.
4.3.5 Headers and Footers
Headers and footers are areas in the top and bottom margins of a worksheet.
- 16 -
You can add a header and footer on each worksheet. You can insert a page
number, date and time, graphic, file name in a header and footer, and change
the font in header and footer text. You can have only one custom header and
one custom footer on each worksheet. If you create a new custom header or
footer, it replaces any other custom header or footer on the worksheet.
4.3.6 Page Breaks
Microsoft Excel will break pages automatically. You can manually insert
horizontal or vertical page breaks.
4.3.7 Drawings, Pictures and Diagrams
You can add graphics to your worksheets and charts to make them more
visually appealing, to create eye-catching reports, or to add emphasis. For
example, you can display a logo on your worksheet, create a flowchart, and
use graphics in chart data markers. You can make your worksheet interactive
by using graphic objects as hyperlinks or by assigning buttons to macros.
4.3.8 Charts
Charts are visually appealing and make it easy for users to see comparisons,
patterns, and trends in data. To create a chart, you must first enter the data for
the chart on the worksheet. Then select that data and create a chart. A chart is
linked to the worksheet data it's created from and is updated automatically
when you change the worksheet data.
4.3.9 Formatting
You can use these formatting features of Microsoft Excel to effectively display
your data.
Format text and individual characters
- 17 -
To make text stand out, you can format all of the text in a cell or selected
characters. You can set the font, color, and alignment of text.
Rotate text and borders
The data in a column is often very narrow while the label for the column is
much wider. Instead of creating unnecessarily wide columns or abbreviated
labels, you can rotate text and apply borders that are rotated to the same
degree as the text.
Add borders, colors, and patterns
To distinguish between different types of information in a worksheet, you can
apply borders to cells, shade cells with a background color, or shade cells with
a color pattern.
Number formats
You can use number formats to change the appearance of numbers, including
dates and times, without changing the number behind the appearance. The
number format does not affect the actual cell value that Microsoft Excel uses to
perform calculations.
Conditional formatting
The conditional format is a format, such as cell shading or font color, that
Microsoft Excel automatically applies to cells if a specified condition is true.
Style
The style is a combination of formatting characteristics, such as font, font size,
and indentation, that you name and store as a set. When you apply a style, all
of the formatting instructions in that style are applied at one time.
4.4 Table Reports
4.4.1 About Table Reports
A table is made up of rows and columns of cells that you can fill with text and
- 18 -
graphics. Tables are often used to make reports, and organize and present
information.
XLReportGen supports two types of table reports: fixed table report, variable
table report.
Fixed table report: The number of rows and columns in the table is fixed. When
XLReportGen executes a SQL statement, directly puts the result data into the
cells in the table.
Variable table report: The number of rows or columns in the table is unfixed,
and it is variable as the number of result records. When XLReportGen
executes a SQL statement, it repeats the table rows or columns for each
record or group, and then puts data into the cells of table.
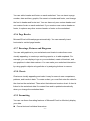
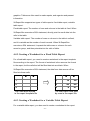
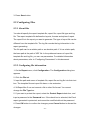
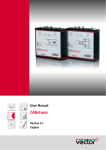
4.4.2 Creating a Worksheet for a Fixed Table Report
For a fixed table report, you need to create a worksheet in the report template
file according to the report. The format of worksheet is the same as the format
in the report, but the cells that will be filled data into are blank. When
XLReportGen executes a SQL statement, the data from data source will be
filled into these cells.
A
B
A
B
1
1
14
3.4
2
2
20
5.2
3
3
8
2.7
The fixed table defined
in the report template file
The fixed table filled data
by rows in the report file
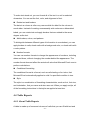
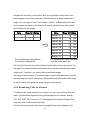
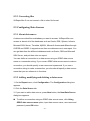
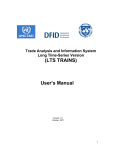
4.4.3 Creating a Worksheet for a Variable Table Report
For a variable table report, you also need to create a worksheet in the report
- 19 -
template file according to the report. But you just need to define one or two
blank ranges for one or two records in the worksheet. A range represents a
single cell or a range of cells. For example, “A3:D3”. XLReportGen will insert
some ranges according to the number of records returned from data source,
and fill data into the ranges.
Date
Item Id
Sales
Date
The variable-rows table defined
in the report template file
Item Id
Sales
1998-01-01
3
150
1998-01-02
3
200
1998-01-03
3
250
1998-01-05
3
350
1998-01-10
3
550
1998-01-21
3
150
1998-01-25
3
200
1998-01-31
3
100
The variable-rows table filled data
by rows in the report file
The format of the last row/column border can be different from the others. For
example, the outside borders used double lines, and the inside borders used
single lines. To do this, you should define two blank ranges.
The ranges can be nested. The inside range is used for the detail data, and the
external range is used for the group. XLReportGen will repeat the inside range
for each record, and repeat the group range for each group.
4.4.4 Formatting Cells for Pictures
To enhance the visual impact of your report, you can insert pictures into your
report. XLReportGen supports many popular graphics file formats: bitmap,
JPG, GIF, PNG, TIFF and so on. For the graphics file formats XLReportGen
supports, refer to Microsoft Excel Help.
You should store the path and name of graphics files in the database, and
- 20 -
identify the image fields in the report function. XLReportGen will read the
graphics files, and insert them into the cells in the report file.
To specify the positioning option and size, you should write a formatting
expression into the cell in the report template file. XLReportGen will get the
text of cell, and insert a picture into the cell according to the instruction in the
format expression. The format expression for pictures as follows:
[placement] [size]
The placement specifies the positioning option, and can be one of the
following values. The default value is MNS.
Values
MAS
MNS
NMS
Description
Move and size with cells.
Move but don't size with cells.
Don't move or size with cells.
The size specifies the size of a picture. Possible values are STRETCH, Wnnn
or / and Hnnn. "STRETCH" means that the picture is resized to fit within the
cell. “W100” means that the width of picture is set to 100 points. “H50” means
that the height of picture is set to 50 points. The default means the original size.
If you just specify the width or height of picture, not both, XLReportGen will
retain the original proportions of picture when XLReportGen resize it.
Example
w84
Remarks
On the supposition that the original picture is size 144 x 168 points.
XLReportGen will insert a picture, set the positioning option to Move but don't
size with cells, set the height of picture to 72 points, and the width to 84
points.
- 21 -
4.5 Charts
4.5.1 About Charts
Charts are visually appealing and make it easy for users to see comparisons,
patterns, and trends in data. You can use Microsoft Excel to add sophisticated,
colorful charts in your reports. For example, you can see at a glance whether
sales are falling or rising over quarterly periods, or how the actual sales
compare to the projected sales. You can create a chart on its own sheet or as
an embedded object on a worksheet.
4.5.2 Creating a Blank Chart
To create a chart in the report using XLReportGen, you need to add a chart in
the report template file. The chart will be brought into the report file with the
same chart type, display option, number format, titles, data labels and legends.
To add a chart in the template file:
1. Open the report template file using Microsoft Excel.
2. Enter the sample data for the chart on the worksheet.
3. Select these data and use the Chart Wizard to step through the process of
choosing the chart type and the various chart options, or use the Chart toolbar
to create a basic chart that you can format later.
4. Customize the chart. For example, change the chart type, colors, lines, fills,
number formats, titles, data labels and legends in charts.
5. After you have finished the customization, delete data from the chart. You
should keep a blank chart in the report template file.
For more detail information, refer to Microsoft Excel Help.
- 22 -
Chapter 5 Reporting with XLReportGen
5.1 Creating and Opening XRF Files
5.1.1 About XRF files
To generate a report with XLReportGen, you must create an XRF file with
an .xrf extension. The XRF file contains information such as the name of report
template file, the name of report file, log file name, data sources, parameters
and functions. The XRF file tells XLReportGen how to get data from data
sources and how to put data into a report.
5.1.2 Create a new XRF file
On the File menu, click New.
5.1.3 Open an XRF file
1. On the File menu, click Open.
2. In the Look in list, click the drive, folder, or Internet location that contains
the file you want to open.
3. In the folder list, locate and open the folder that contains the file.
4. Click the file, and then press Open button.
5.1.4 Save an XRF file
On the File menu, click Save. If you're saving the file for the first time, you'll be
asked to give it a name.
If you want save a file to another name, do as follows:
1. On the File menu, click Save As.
2. In the File name box, enter a new name for the file.
- 23 -
3. Press Save button.
5.2 Configuring Files
5.2.1 About files
You should specify the report template file, report file, report file type and log
file. The report template file defines the layouts, formats and styles of report.
The report file is the report you want to generate. The type of report file can be
different from the template file. The log file records the log information in the
report generating.
The file path can be a relative path or an absolute path. If it is a relative path,
the base path is the path of XRF file. In the paths and names of report file,
template file and log file, you can use parameters. For detailed information
about parameters, refer to “Configuring Parameters” in this document.
5.2.2 Configuring file information
1. On the Report menu, click Configuration. The Configuration dialog box
appears.
2. Click the File tab.
3. Input the path and name of template file, report file and log file into their text
box. The template file and report file have a .xlsx extension.
4. XLReportGen 5 can not convert a file to other file format. You cannot
change the File Type box.
5. If you want to protect the report, select the Protect Report check box, and
input a password in the Password box. If the check box is selected, the Excel
report generated is protected, and cannot be modified without the password.
6. Press OK button to confirm the changes, press Cancel button to discard the
changes.
- 24 -
5.2.3 Converting files
XLReportGen 5 can not convert a file to other file format.
5.3 Configuring Data Sources
5.3.1 About data source
A data source identifies a database you want to access. XLReportGen can
access to almost all of the databases such as Oracle, DB2, Sybase, Informix,
Microsoft SQL Server, Teradata, MySQL, Microsoft Access and dBase through
OLE DB and ODBC. It supports more than one data sources in one report. You
can get data from the different databases such as Oracle, DB2 and Microsoft
SQL Server, and put them into one report.
You can define a connection to a data source using an ODBC data source
name or a connection string. If you use an ODBC data source name to make a
connection, you should specify a user name and a password. If you use a
connection string to make a connection, you also should specify a data source
name that you can reference in functions.
5.3.2 Adding, modifying and deleting a data source
1. On the Report menu, click Configuration. The Configuration dialog box
appears.
2. Click the Data Source tab.
3. If you want to add a data source, press New button, the New Data Source
dialog box appears.
To define a connection using an ODBC data source name, click Using
ODBC data source name option, input data source name, user name and
password, press OK button.
- 25 -
To define a connection using a connection string, click Using connection
string option, input data source name and connection string, select a data
provider, press OK button.
4. If you want to modify a data source, click the data source name in the Data
Source list box, and press Edit button, the Edit Data Source dialog box
appears.
To define a connection using an ODBC data source name, click Using
ODBC data source name option, change data source name, user name
and password, press OK button.
To define a connection using a connection string, click Using connection
string option, change data source name, connection string, and data
provider, press OK button.
5. If you want to delete a data source, click the data source name in the Data
Source list box, and press Delete button, the confirmation dialog box appears.
Press Yes button to delete the data source.
6. You can test a data source. Click the data source name in the Data Source
list box, and Press Test button to display the information of connection to the
data source.
7. Select or clear the Encrypt Password check box. If the check box is
selected, passwords will be saved in an encrypted format. Or passwords will
be saved in plain text.
8. Press OK button to confirm the changes, press Cancel button to discard the
changes.
5.4 Configuring Parameters
5.4.1 About parameters
You can use parameters in the SQL statements. These values need to be
- 26 -
provided to XLReportGen before it executes these SQL statements. To use a
parameter, you must declare it first. When XLReportGen generate a report, it
will prompt you to input the value of parameter. XLReportGen will replace the
parameter name in the SQL statements with the actual value before it submits
the SQL statements to data sources.
A parameter has a name, a title and a default value. The name of parameter
identifies the parameter. You can use the names in SQL statements. The titles
will be displayed in the prompt dialog box when XLReportGen is run.
Note: XLReportGen will replace all strings that are the same as the names of
parameters. You should be careful to define a unique name for each
parameter. It is a good choice a name begins with the “$” character. For
example, you give the name “$ReportDate” for a parameter. Parameters are
case-sensitive.
5.4.2 Adding, modifying and deleting a parameter
1. On the Report menu, click Configuration. The Configuration dialog box
appears.
2. Click the Parameter tab.
3. If you want to add a parameter, press New button, the New Parameter
dialog box appears. Input parameter name, parameter title and default value,
press OK button.
4. If you want to modify a parameter, click the parameter name in the
Parameter list box, and press Edit button, the Edit Parameter dialog box
appears. Change the name, title and default value of parameter, press OK
button.
5. If you want to delete a parameter, click the parameter name in the
Parameter list box, and press Delete button, the confirmation dialog box
appears. Press Yes button to delete the parameter.
- 27 -
6. Press OK button to confirm the changes, press Cancel button to discard the
changes.
5.5 Inputting Functions
You should input functions in the editor window. A function includes a SQL
statement and some arguments. XLReportGen executes the SQL statement,
and determines whether or how to add data into the report. XLReportGen
sequentially executes the functions.
Each function is begin with the “@” character. Syntax:
@functionno=functionname(arguments)
sqlstatement
The functionno is the label of report function.
The functionname represents a report function.
The arguments for a function define various properties for the function. For
example, the “sheet” argument identifies a worksheet in the Excel workbook.
An argument takes the form Name="Value". The argument value can be
delimited by single or double quotes.
The sqlstatement is a SQL statement.
For more detailed information about functions, see “Function Reference” in this
document.
You can use comments in text. A comment is the “/*” characters, followed by
any sequence of characters (including new lines), followed by the “*/”
characters. You cannot nest comments.
5.6 Running XRF Files
You can run an XRF file to generate a report in Microsoft Excel spreadsheet
- 28 -
format. XLReportGen supports Windows mode and command line mode.
5.6.1 Windows mode
1. On the Report menu, click Run, the Run Report dialog box appears.
2. If you want to display the generated report, select the Display Report with
Microsoft Excel check box.
3. Press Start button to run the XRF file.
4. If parameters are defined in the XRF file, XLReportGen will pop up a prompt
dialog box. Input the values of parameters, and press OK button.
5. While XLReportGen is being run, it will display some information such as
status, SQL count, error count, function No., records count and log information.
6. You can interrupt the running. Click End button to interrupt it. XLReportGen
will immediately save and close the report.
7. Click Close button after completion.
8. If you want to open the report, click Open Report File on the File menu.
9. If you want to check the log, click Open Log File on the File menu.
5.6.2 Command line mode
You can run an XRF file in command line. You have defined two parameters in
the XRF file “myreport.xrf”. The first parameter is sales date “$SalesDate”, and
the second is the category of products “$Category”. You can run XLReportGen
in command line mode as follows:
excelreport c:\excelreport\myreport.xrf -c 1996-05-01 “Dairy Products”
XLReportGen will replace “$SalesDate” in SQL statements with “1996-05-01”,
replace “$Category” with “Dairy Products”, and then submit SQL statements to
data sources.
- 29 -
5.7 Using Excel Formulas
Formulas are equations that perform calculations on values in your worksheet.
A formula starts with an equal sign (=). For example, the following formula
multiplies 2 by 3 and then adds 5 to the result.
=5+2*3
A formula can also contain any or all of the following: functions, references,
operators, and constants. For more detail information about formulas,
functions and references, refer to Microsoft Excel Help.
In a report template file, you can use all kind of Microsoft Excel formulas. And
then all formulas in the report template file will be brought to the final report file.
Example
Show Unit Price, Quantity, Discount and Amount. The Amount will be changed
if an end user changes Unit Price, Quantity or Discount.
You can use a formula to show Amount.
1. Create a template file as follows, and define the formula "=C2*D2*(1-E2)" in
the cell F2. You must use the relative reference.
2. Write the report function as follow, and use COPYRANGE to copy the
formula to all following cells for each record. For the first record, XLReportGen
will directly put data into row 2. For the other records, it will copy row 2 to the
current row, and then put data into the current row. So the formula in cell F2
will copy to cell F3, F4… and Microsoft Excel will automatically change the
formula to "=C3*D3*(1-E3)" …
@F1=Report(sheet="Sheet1" cell=A2 copyrange=2:2)
SELECT c.CompanyName AS Customer
,p.ProductName
- 30 -
,d.Quantity
,d.UnitPrice
,d.Discount
FROM Orders o
, Customers c
, OrderDetails d
, Products p
WHERE o.CustomerID = c.CustomerID
AND o.OrderID = d.OrderID
AND d.ProductID = p.ProductID
AND YEAR(o.OrderDate) = YEAR('1996-04-01')
AND MONTH(o.OrderDate) = MONTH('1996-04-01')
ORDER BY 1, 2
3. The report generated by XLReportGen is as follows.
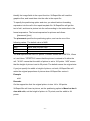
Example
Add totals such as Total Quantity, Total Amount.
You can use the math functions of Microsoft Excel, such as SUM.
1. Create a report template file as follows, define the formula of total quantity
as "=SUM(C7:C8)" in cell C9, and the formula of total amount as
"=SUM(D7:D8)" in cell D9. You must use the relative reference.
2. Write the report function as follow. When XLReportGen insert some rows
- 31 -
according to the records, Microsoft Excel will automatically change the
formulas.
@F2=REPORT(sheet="Report2" type=var cell=B7 rangecount=2)
SELECT c.CategoryName, SUM(d.Quantity), Sum(d.UnitPrice * d.Quantity *
(1-d.Discount))
FROM Orders o
,OrderDetails d
,Products p
,Categories c
WHERE o.OrderID = d.OrderID
AND d.ProductID = p.ProductID
AND p.CategoryID = c.CategoryID
AND YEAR(o.OrderDate) = YEAR('1996-04-01')
AND MONTH(o.OrderDate) = MONTH('1996-04-01')
GROUP BY c.CategoryName
ORDER BY c.CategoryName
;
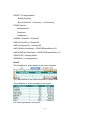
3. The following is the generated report. The formula of total quantity is
changed to “=SUM(C7:C14)”, and the formula of total amount is changed to
“=SUM(D7:D14)”.
- 32 -
5.8 Sorting, Grouping and Totaling
5.8.1 Sorting data
Sorting means placing data in some kind of order to help you find and evaluate
it. For example, you may want to have a customer list sorted alphabetically by
name or by country.
To sort your data, you can use SQL. Use the ORDER BY clause to have your
results displayed in a sorted order.
SELECT EmployeeID
,LastName
,FirstName
,HireDate
FROM Employees
ORDER BY HireDate; /* ascending sort */
In the example above, results will come back in ascending order by hire date.
To explicitly specify ascending or descending order, add ASC or DESC, to the
end of your ORDER BY clause. The following is an example of a descending
order sort.
ORDER BY HireDate DESC;
/* descending sort */
5.8.2 Totaling
You can sum the values, count all the values or only those values that are
distinct from one another, and determine the maximum, minimum, average. To
add totals, there are two ways.
1. You can add the totals using the math functions of Microsoft Excel, such as
SUM. For more detail information, refer to “Using Excel Formulas” in this
document.
- 33 -
2. You can use the aggregate functions in SQL statement, such as COUNT,
SUM, AVG, MAX, MIN.
(1) In the fixed table report, you can add a total directly using a separate SQL.
(2) In the variable table report, you must add the total first using a fixed table
report function before you use the variable table report function. Because the
cell address of the total field will change after you use the variable table report
function.
5.8.3 Grouping data and subreports
Grouped data is data that is sorted and broken up into meaningful groups. In a
customer list, for example, a group might consist of all those customers living
in the same region.
To group data in a report, you should use GROUP argument in the REPORT
function. For more detail information, refer to “Report Function” in this
document.
Using the feature of grouping data, you can make sub reports within a report. A
sub report would typically be used to perform one-to-many lookups such as
Customer / Order / OrderDetails.
To make sub reports within the main report,
1. Write a JOIN SQL statement to get data from two or more tables. For
example, you can join Customers, Orders and OrderDetails tables.
2. Use GROUP argument in the REPORT function.
For more detail information, refer to the samples invoice.xrf,
product_catalog.xrf and sales_detail.xrf within XLReportGen.
5.8.4 Subtotaling
A subtotal is a summary that totals or sums numeric values in a group. You
can sum the values in each group, count all the values in each group, and
- 34 -
determine the maximum, minimum, average in each group. For example,
determine the total sales per sales representative in a sales report.
To add subtotals, you can use the functions of Microsoft Excel or aggregate
functions in SQL statement.
1. You can add sub-totals using math functions of Microsoft Excel, such as
SUM.
(1) The range of SUM function should contain cells for detail records in the
report template file.
(2) The range of SUM function must contain at least one row/column that is not
included in the range used for the details. For example, the row 13 is defined
for the details, you should add blank row 14, and write the function as
SUM(H13:H14). If you do not want to show the blank row in the report, you
may hide the row.
(3) You should use the relative references. For example, SUM(H13:H14).
Microsoft Excel will change the function automatically when XLReportGen
adds some rows in the report.
2. If you want to have a total and sub-totals,
(1) You can add the total using SUMIF function. The range of SUMIF function
must contain one row/column that is not included in the range of group. For
example, the range of group is “1:15”, you should add blank row 16, and write
the function as SUMIF(G:G,"Subtotal:",H1:H16). You may hide the blank row.
(2) You can add the total using the aggregate function in SQL statement. You
must add the total first using a fixed table report function before you use the
variable table report function. Because the cell address of total field will change
after you use the variable table report function.
3. You can add sub-totals using the aggregate function in SQL statement too.
(1) Use aggregate function and GROUP BY clause, get summary data for each
group, and insert results into a temporary table.
- 35 -
(2) If you have the different kinds of summaries, repeat the step 1, and insert
results into another temporary table.
(3) Use the variable table report function, and join the detail data and the
summary data using JOIN. The summary fields must be included in the group
list.
For more detail information, please refer to the samples invoice.xrf and
sales_detail.xrf within XLReportGen.
5.9 Charting
Charts are visually appealing and make it easy for users to see comparisons,
patterns, and trends in data. You can use Microsoft Excel to add sophisticated,
colorful charts in your reports. For example, you can see at a glance whether
sales are falling or rising over quarterly periods, or how the actual sales
compare to the projected sales.
To create a chart in a report, you should create the chart in the template file.
You can create a chart on its own sheet or as an embedded object on a
worksheet. For more detail information how to create chart, refer to Microsoft
Excel Help.
To create a chart in the report template file, you can use some sample data.
Using sample data, you can set the various chart options. After you have
finished the customization, delete the sample data from the chart. You should
keep a blank chart in the report template file.
You can use Report function to generate charts. For more detail information
about charting, refer to the sample monthly_sales.xrf within XLReportGen.
Example
The following function provides data for the chart: Sales by Categories.
@F2=REPORT(sheet="Report2" type=var cell=B7 rangecount=2)
- 36 -
SELECT c.CategoryName
, SUM(d.Quantity)
, Sum(d.UnitPrice * d.Quantity * (1-d.Discount))
FROM Orders o
,OrderDetails d
,Products p
,Categories c
WHERE o.OrderID = d.OrderID
AND d.ProductID = p.ProductID
AND p.CategoryID = c.CategoryID
AND YEAR(o.OrderDate) = YEAR('$ReportMonth-01')
AND MONTH(o.OrderDate) = MONTH('$ReportMonth-01')
GROUP BY c.CategoryName
ORDER BY c.CategoryName
Result
The worksheet of chart defined in the report template:
The chart defined in the report template is a blank chart.
The worksheet of chart generated in the report:
The chart generated in the report:
- 37 -
Remarks
1. The SQL statement will get the information of categories including category
name, quantity, and amount.
2. type = “var”. It is a variable table report.
3. sheet=" Report2". XLReportGen will put data into the worksheet “Report2” in
the report file.
4. cell=B7. The cells corresponding to the first record are “B7,C7,D7”.
5. The default range is “B7:D7”.
6. rangecount=2. There are two blank ranges in the report template.
7. XLReportGen executes the SQL statement, and gets data from data source.
First, it inserts some ranges according to the number of records. Second, it
puts the data into the report by records. And then the chart is updated
automatically.
5.10 Pictures
5.10.1 Inserting pictures into a report template
To make eye-catching reports, you can add pictures to your reports. You can
insert pictures into the report template directly in Microsoft Excel. For example,
you want to display a logo in your report. You can insert the logo graphics file
into the report template. For more information about adding pictures to
- 38 -
worksheets, refer to Microsoft Excel Help.
5.10.2 Inserting pictures into a report
Except for inserting the static pictures during report design, you want to insert
pictures during report building process. XLReportGen can insert pictures from
the graphics files, and support all graphics file format that Microsoft Excel
support.
To insert pictures into a report using XLReportGen, you should do as follows:
1. Store the path and name of graphics files in the database
You stored the path and file name of pictures in database, did not store the
pictures. The file path can be a relative path, an absolute path or a URL. For
example, you store "images\emp1.jpg" in Photo field.
2. Identify the image fields in the report function
Write a report function in the XRF file, and identify the image fields using
IMAGE argument. For example,
@F1=Report(sheet="Employee Profile" ... image=photo)
3. Specify the positioning option and size in the report template
To specify the positioning option and size, you should write a formatting
expression into the cell in the report template file. XLReportGen will get the
text of cell, and insert a picture into the cell according to the instruction in the
format expression.
4. Run XLReportGen to generate report with pictures
During report generating process, XLReportGen will read the graphics files,
and insert them into the report according to your instruction. If the path and file
name of picture is “”, XLReportGen will return “”.
For more detail information about pictures, refer to the samples
employee_profile.xrf, product_catalog.xrf within XLReportGen.
- 39 -
5.11 Using Parameters
To use a parameter, you must define it first. If you have defined a parameter
name, you can use it in SQL statements. When XLReportGen is run, it will
replace the parameter name in the SQL statements with the actual value
before it submits the SQL statements to data sources. Besides in SQL
statements, you can use parameters in the paths and names of report file and
log file.
In fact, XLReportGen will replace all strings that are the same as the names of
parameters. You should be careful to define a unique name for each
parameter. It is a good choice a name begins with the “$” character.
Example
Input an order id to get the order information. The field OrderID is numeric
type.
1. Defining a parameter
Define a parameter as follows:
Name: $OrderID
Title: Order ID (>=10248)
Default: 10360
2. Using a parameter
You can use the parameter “$OrderID” in SQL statements. For example:
SELECT o.OrderID
,o.OrderDate
,SUM(d.UnitPrice * d.Quantity * (1-d.Discount)) AS Amount
FROM Orders o, OrderDetails d
WHERE o.OrderID = d.OrderID
AND o.OrderID = $OrderID
GROUP BY o.OrderID, o.OrderDate
- 40 -
;
Example
Define two parameters. The first parameter is the sales date, and the second is
the category of products. The field OrderDate is the date type, and
CategoryName is the char type.
1. Defining parameters
Define parameters as follows:
Name1: $SalesDate
Title1: Sales Date
Default1: 1996-05-01
Name2: $Category
Title2: Category of Products
Default2:
2. Using parameters
You can use the parameters “$SalesDate”, “$Category” in SQL statements.
For example:
SELECT ……
FROM Orders, OrderDetails, Products, Categories
WHERE ……
AND OrderDate = ‘$SalesDate’
AND CategoryName LIKE '$Category%'
;
/* For Microsoft Jet SQL, LIKE '$Category*' */
Example
Get the information from the database, table and column that you identify when
the report is generated.
1. Defining parameters
Define parameters as follows:
- 41 -
Name1: $Database
Title1: Database Name
Default1:
Name2: $Table
Title2: Table Name
Default2:
Name3: $Column
Title3: Column Name
Default3:
2. Using parameters
You can use the parameters “$Database”, “$Table” and “$Column” in SQL
statements. For example:
USE $Database;
or
DATABASE $Database;
SELECT $Column
FROM $Table
;
Example
Use parameters in the path and name of report file and log file.
1. Defining a parameter
Define a parameter as follows:
Name: $CustomerID
Title: Customer ID
Default: C000001
2. Using a parameter
ReportFileName=report\report_$CustomerID.xlsx
LogFileName=log\report_$CustomerID.log
- 42 -
or
ReportFileName=report\$CustomerID\report.xlsx
LogFileName=log\$CustomerID\report.log
5.12 Programming
5.12.1 Making XRF files programmatically
Sometimes you want to make an XRF file programmatically. You can do this
because the XRF file is a text file. You can write a program to make an XRF file
using C, perl or DOS shell, and then run XLReportGen to generate report. The
two steps can be written into a batch file.
1. Write a program to make the XRF file as you need.
2. Write a batch file to call the program and XLReportGen in command line
mode.
For example, you write a batch file runrpt.bat as follows. changexrf is an
executable file that reads template.txt and outputs template.xrf. First runrpt.bat
calls changexrf to make the XRF file, and then calls XLReportGen to generate
the report.
@echo off
if "%1"=="" goto usage
goto process
:usage
echo Usage: runrpt ReportDate
echo ReportDate Date format 'YYYY-MM-DD'
goto :EOF
:process
changexrf %1 <"template.txt" >"template.xrf"
ExcelReport "template.xrf" –C %1
- 43 -
- 44 -
Chapter 6 Function Reference
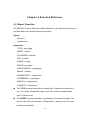
6.1 Report Function
The REPORT function executes a SQL statement to get data from data source,
and puts data into a worksheet in the report file.
Syntax
Report(…)
sqlstatement
Arguments
TYPE = reporttype
SHEET = sheet
FILLORDER = fillorder
CELL= celllist
RANGE = range
GROUP= grouplist
GROUPRANGE = grouprange
IMAGE = fieldlist
RANGECOUNT = rangecount
PAGEBREAK = pagelength
NODATA = nodataoption
CONNECT = datasource
The TYPE argument specifies the report type. Possible values are fix or
var. "fix" means a fixed table report, and "var" means a variable table
report. Default is var.
The SHEET argument identifies a worksheet in the report template. The
sheet is the name of worksheet. XLReportGen 5 does not use the index
number of worksheet.
- 45 -
The FILLORDER argument specifies the order in which XLReportGen fills
data. Possible values are row or col. "row" means to fill data by rows. "col"
means to fill data by columns. Default is row.
The CELL argument specifies the positions where data values will be
inserted. The celllist is the list of cells separated by the “,” character. It
identifies the cells in a worksheet. For example, “A2,B2,B3,D2,D3”. The
cells in the celllist should correspond to the data source fields in the SQL
statement. The value of the first field is put into the first cell, and the value
of the second field is put into the second cell …… XLReportGen will use
the next cell if you omit a cell except the first cell. If FILLORDER=“row”, the
next cell is the right cell. If FILLORDER=“col”, the next cell is the below
cell.
The RANGE or COPYRANGE argument specifies the range in the
worksheet to be used for the records. XLReportGen will skip or repeat the
range for each record. You can reference a range of cells like “2:4” or
“B2:D5”. The range “2:4” means 3 entire rows. The range “A:B” means 2
entire columns. The default range is the area that includes all cells for the
records. For the fixed table report, XLReportGen will skip the range for
each record. For the variable table report, it will insert the blank range for
each record. The COPYRANGE argument is similar to the Range. It will
copy the original range to the range where data will be filled for each
record. If there is no range or copyrange argument, the default for the fixed
table report is range, and the default for the variable table report is
copyrange.
The GROUP argument specifies the group of report. The grouplist is the
list of data source fields separated by the “,” character. You can identify a
field using the name or index number of field, but not simultaneously. In
one report, there may be up to 10 groups. The first GROUP is group one,
- 46 -
the second is group two...... Notes: the order of groups should be in
accordance with the order of ORDER BY clause in the SQL statement.
The GROUPRANGE argument follows the GROUP argument, and
specifies the range of group in the worksheet. For example, the
grouprange of level 1 must follow the group of level 1, and the grouprange
of level 2 must follow the group of level 2. XLReportGen will repeat the
group range for each group. The range of group should contain the range
of details and the area that includes all cells for this group. You reference a
group range like “2:4” or “B2:D5”. For example, there are two groups, the
range of group one contains all cells for the group one and the range of
group two, and the range of group two contains all cells for the group two
and the range of details. The default range is the area that includes all cells
for this group and the range or group range for the lower level group.
The IMAGE argument specifies the fields are picture files. The fieldlist is
the list of data source fields separated by the “,” character. You can identify
a field using the name of field or the index number of field, but not
simultaneously. In data source, you stored the path and file name of
picture, not the picture. The file path can be a relative path, an absolute
path or a URL. If it is a relative path, the base path is the path of report
template file.
The RANGECOUNT argument specifies the number of blank range which
you defined in the report template. It is valid when the type is “var”.
Possible values are 1 or 2. One means one blank range you defined, and
two means two ranges. If you hope that the format of the last row/column
border can be different from the others, you can define two blank ranges.
Default is 1.
The PAGEBREAK argument specifies the page breaks. The unit of page
length is r or g. "r" means record, "g1" means group one, "g2" means group
- 47 -
two...... For example, “6r” or “6” means that XLReportGen will insert a page
break per 6 records, “1g1” or “1g” means a page break per group one, and
“1g1,6r” means a page break per group one or 6 records. Default is no
page break.
The NODATA argument specifies an option when no data are returned
from data source. It is valid when the type is “var”. If the value is "delrange",
XLReportGen will delete the range when no data are returned. If the value
is "delsheet", XLReportGen will delete the sheet when no data are
returned. Default is to do nothing.
The CONNECT argument specifies the connection to a data source. The
CONNECT can takes a string that expresses a data source name or a
number that expresses a data source index. The index number of data
source is the sequential number defined in the XRF file, and starts at 1.
The default implies the first data source.
The sqlstatement is a SQL statement such as a SELECT statement.
Example 1, Fixed Table Report
The following function makes the Excel report: Top 5 Employees for Sales.
@F1=REPORT(sheet="Report6" type=fix cell=B7)
SELECT TOP 5 e.FirstName + ' ' + e.LastName
, SUM(d.Quantity)
, Sum(d.UnitPrice * d.Quantity * (1-d.Discount)) AS SalesAmount
FROM Orders o
,OrderDetails d
,Products p
,Employees e
WHERE o.OrderID = d.OrderID
AND d.ProductID = p.ProductID
- 48 -
AND o.EmployeeID = e.EmployeeID
AND YEAR(o.OrderDate) = 1996
AND MONTH(o.OrderDate) = 04
GROUP BY e.FirstName, e.LastName
ORDER BY 3 DESC
;
Result
The fixed table report defined in the report template:
The fixed table report generated in the report:
Remarks
1. The SQL statement will get the information of top 5 employees for sales,
including employee name, quantity of products, and sales amount.
2. type=“fix”. It is a fixed table report.
3. sheet = “Report6”. XLReportGen will put data into the worksheet “Report6”
in the report file.
4. cell=B7. The cells corresponding to the first record are “B7,C7,D7”.
5. The default range is “B7:D7”.
6. XLReportGen executes the SQL statement, and gets data from data source.
It puts the data into the report by records.
- 49 -
Example 2, Variable Table Report
The following function will makes the Excel report: Mail Label.
@F1=Report(sheet="Mail Label" type=var cell=B7,B8,B9,B10 copyrange=1:11
pagebreak = 4r)
SELECT CompanyName
,Address
,CityName & ', ' & CountryName
,PostalCode
FROM Customers, Cities, Countries
WHERE Customers.CityCode = Cities.CityCode
AND Customers.CountryCode = Cities.CountryCode
AND Customers.CountryCode = Countries.CountryCode
ORDER BY CompanyName
;
Result
The variable table report defined in the report template:
The variable table report generated in the report:
- 50 -
Remarks
1. The SQL statement will get the information of customers including company
name, address, city name, country name, and postal code.
2. type=“var”. It is a variable table report.
3. sheet="Mail Label". XLReportGen will put data into the worksheet “Mail
Label” in the Excel report file.
4. cell=B7,B8,B9,B10. These cells correspond to the first record.
5. copyrange=1:11. Because the default range is “B7:B9”, you must specify a
range explicitly. XLReportGen will copy the range for each record.
6. pagebreak = 4r. XLReportGen will add a page break per 4 records.
7. XLReportGen executes the SQL statement, and gets data from data source.
First, it inserts some ranges according to the number of records. Second, it
copies the source range into the all added ranges. And then it puts the data
into the report by records. Finally, it adds page breaks per 4 records.
- 51 -
Example 3, Variable Table Report with Group
The following function will makes the Excel report: Customer Profile.
@F1=Report(sheet="Customer Profile" cell=A6,B7,C7,D7,D8,E7,E8,E9
copyrange=6:9 group=1 pagebreak = 6r)
SELECT LEFT(CompanyName,1)
,CompanyName
,ContactName
,'Phone: ' & Phone
,'Fax: ' & Fax
,Address
,CityName & ', ' & CountryName
,PostalCode
FROM Customers, Cities, Countries
WHERE Customers.CityCode = Cities.CityCode
AND Customers.CountryCode = Cities.CountryCode
AND Customers.CountryCode = Countries.CountryCode
ORDER BY CompanyName
;
Result
The variable table report defined in the report template:
The variable table report generated in the report:
- 52 -
Remarks
1. The SQL statement will get the information of customers including company
name, contact name, phone, fax, address, city name, country name, and
postal code.
2. The default type is “var”. It is a variable table report.
3. sheet=" Customer Profile". XLReportGen will put data into the worksheet
“Customer Profile” in the report file.
4. group=1. XLReportGen will group data by the first letter of company name.
5. cell= A6,B7,C7,D7,D8,E7,E8,E9. These cells correspond to the first record.
6. copyrange=6:9. Because the default range is “B7:E9”, you must specify a
range explicitly. XLReportGen will copy the range for each record.
7. There is no grouprange. XLReportGen will give a default value. The default
grouprange is “6:9”.
8. pagebreak = 6r. XLReportGen will add a page break per 6 records.
9. XLReportGen executes the SQL statement, and gets data from data source.
First, it groups the data. Second, it inserts some ranges according to the
number of records. Next, it copies the source range into the all added ranges.
And then it puts the data into the report by records. Finally, it adds page breaks
per 6 records.
- 53 -
6.2 Name Function
The Name function executes a SQL statement, and assigns the values to the
names defined in the Excel workbook. XLReportGen will just fetch the first
record, no matter how many records are returned from data source.
Syntax
Name(…)
sqlstatement
Arguments
NAME= namelist
CONNECT= datasource
The NAME argument specifies the names you want assign values to. The
namelist is the list of names separated by the “,” character. For example,
“BeginDate, EndDate” means two names: BeginDate and EndDate that
should be defined in the report template. The names in the namelist should
correspond to the fields in the SQL statement. The value of the first field is
put into the first name, and the value of the second field is put into the
second name …
The CONNECT argument specifies the connection to a data source. The
CONNECT can takes a string that expresses a data source name or a
number that expresses a data source index. The index number of data
source is the sequential number defined in the XRF file, and starts at 1.
The default implies the first data source.
The sqlstatement is a SQL statement such as a SELECT statement.
Example
The following function executes a SQL statement, assigns the values of fields
to names.
@F1=NAME(NAME=BeginDate,EndDate)
- 54 -
SELECT min_date, max_date
FROM tmp0
;
Remarks
XLReportGen executes the SQL statement, and gets data from data source. It
assigns the value of field “min_date” to the name “BeginDate” and the value of
field “max_date” to the name “EndDate”.
You should define the names in the report template first. To define and use a
name, do as follows:
1. Run Microsoft Excel program, and open the report template file.
2. On the Insert menu, click Name, and click Define.
3. In the Name box, enter a name such as BeginDate. In the Reference box,
enter “=1”.
4. In a cell such as C4, enter “=BeginDate”.
5. On the Format menu, click Cells, and then click the Number tab. Click Date
type, and select format you want to use.
6.3 ExecSQL Function
The EXECSQL function executes a SQL statement, but does not return result
to report.
Syntax
ExecSQL(…)
sqlstatement
Arguments
CONNECT= datasource
The CONNECT argument specifies the connection to a data source. The
CONNECT can takes a string that expresses a data source name or a
number that expresses a data source index. The index number of data
- 55 -
source is the sequential number defined in the XRF file, and starts at 1.
The default implies the first data source.
The sqlstatement is a SQL statement that can be DDL (Data Definition
Language), DML (Data Manipulation Language) and even DCL (Data
Control Language).
Using EXECSQL function, you can open a database, create a temporary table,
insert data into a temporary table, update data, execute a stored procedure,
and drop a table. It is very useful to create a temporary table, and prepare data
for REPORT function.
Example
The following functions will create a table tmp0, and add some records into
table. No result is returned to the report file.
@F1=EXECSQL()
CREATE TABLE tmp0 (
min_date DATE,
max_date DATE)
;
@F2=EXECSQL()
INSERT INTO tmp0
SELECT …
;
- 56 -
Chapter 7 Menus, Toolbar and Shortcut Keys
7.1 File Menu
The File menu offers the following commands:
New
Open
Close
Save
Save As
Open Report
Template
Open Report File
Open Log File
Recent Files
Exit
Creates a new XRF file.
Opens an existing XRF file.
Closes an opened XRF file.
Saves an opened XRF file using the same filename.
Saves an opened XRF file to a specified file name.
Opens an existing report template file.
Opens an existing report file.
Opens an existing log file.
Opens last XRF files you closed.
Exits XLReportGen.
7.2 Edit Menu
The Edit menu offers the following commands:
Undo
Redo
Cut
Copy
Paste
Delete
Select All
Find
Find Next
Replace
Go to
Undo previous editing operation.
Redo an editing operation that you undid.
Deletes text from the document and moves it to the
clipboard.
Copies text from the document to the clipboard.
Pastes text from the clipboard into the document.
Deletes the selection.
Selects the entire text.
Finds the specified text.
Finds the next matching text.
Replaces specific text with different text.
Goes to specified line or function in the document.
7.3 View Menu
The View menu offers the following commands:
Toolbar
Show or hide the toolbar.
- 57 -
Status Bar
Show or hide the status bar.
7.4 Report Menu
The Report menu offers the following commands:
Configuration
Run
Configures the file names, data sources and
parameters.
Runs the XRF file to generate a report.
7.5 Tools Menu
The Tools menu offers the following commands:
Option
Sets options.
7.6 Help Menu
The Help menu offers the following commands:
Help Context
Tutorial
Tip of the Day
Hints and Tips
Shortcut Keys
Home Page
Support
Buy Now
About
Starts the online help system.
Starts a brief step-by-step tutorial.
Displays a dialog containing a useful tip about
XLReportGen.
Displays miscellaneous hints and tips on how to use
XLReportGen productively.
Shows the keyboard map.
Takes you to the home page of XLReportGen web
site.
Takes you to the support page of XLReportGen web
site.
Buy XLReportGen immediately.
Displays the version number of XLReportGen.
7.7 Toolbar
The toolbar provides quick access to many features. The buttons on the
toolbar perform the following commands:
Buttons Commands
- 58 -
Creates a new XRF file.
Opens an existing XRF file.
Saves an opened XRF file using the same filename.
Open the report template file.
Open the report file.
Deletes text from the document and moves it to the
clipboard.
Copies text from the document to the clipboard.
Pastes text from the clipboard into the document.
Undo previous editing operation.
Redo an editing operation that you undid.
Finds the specified text.
Goes to specified line or function in the document.
Configures the file names, data sources and parameters.
Runs the XRF file to generate a report.
Starts the online help system.
Buy XLReportGen immediately.
7.8 Shortcut Keys
Shortcut Keys
Commands
Ctrl+N
Creates a new XRF file.
Ctrl+O
Opens an existing XRF file.
Ctrl+S
Saves an opened XRF file using the same filename.
Ctrl+Z
Undo previous editing operation.
Ctrl+Y
Redo an editing operation that you undid.
Ctrl+X
Deletes text from the document and moves it to the
clipboard.
Ctrl+C
Copies text from the document to the clipboard.
- 59 -
Ctrl+V
Pastes text from the clipboard into the document.
Delete
Deletes the selection.
Ctrl+A
Selects the entire text.
Ctrl+F
Finds the specified text.
F3
Finds the next matching text.
Ctrl+H
Replaces specific text with different text.
Ctrl+G
Goes to specified line or function in the document.
F2
Configures the file names, data sources and parameters.
F5
Runs the XRF file to generate a report.
F1
Starts the online help system.
- 60 -
Chapter 8 Hints and Tips
You can run XLReportGen from the command line. The format is:
excelreport <xrf file name> [-c] [-d] [-u1 user1] [-p1 pwd1] … [pa1 pa2 …]
For example:
excelreport c:\excelreport\monthlysales.xrf -c 199605
XLReportGen can be scheduled with Windows Scheduled Tasks or other tools.
The process of generating reports can be fully automated, periodically or on
events.
XLReportGen comes with a sample database Sample.mdb and some sample
reports. You can use them when learning the program. To use the sample
reports, you must add a data source named “Report Sample” to specify the
sample database.
To make a report template directly, you can use some sample data. It is very
useful especially for formatting. After you have finished the formatting, delete
the sample data.
To create a chart in the report template file, you can use some sample data.
Using sample data, you can set the various chart options. After you have
finished the chart setting, delete the sample data.
You can use formulas to perform calculations in a report template file.
You can protect the generated report so that it cannot be modified. To protect
the report, select the Protect Report check box in the Configuration dialog
- 61 -
box.
You can edit an XRF file (.xrf) with a text editor such as Notepad.
If you associate XLReportGen with the file extension “.xrf”, an XRF file with the
extension “.xrf” will open in XLReportGen when you double-click the file. The
information:
File Extension: .xrf
Action: open
Application: "C:\Program Files\LJZsoft\ExcelReport.exe" “%1”
For the report template file, report file and log file, it is possible to give a
relative path. If it is a relative path, the base path is the path of XRF file.
In the SQL statements, you can use parameters. To use parameters, you must
define them first.
In the paths and names of report file, template file and log file, you can use
parameters. To use parameters, you must define them first.
You should be careful to define a unique name for each parameter, because
XLReportGen will replace all strings that are the same as the names of
parameters. It is a good choice a name begins with the “$” character such as
“$ReportDate”.
In the text editor window, you can use comments. A comment is the “/*”
characters, followed by any sequence of characters (including new lines),
followed by the “*/” characters. You cannot nest comments.
- 62 -
You can use hints in the SQL statement for Oracle database.
To add totals or subtotals, you can use the functions of Microsoft Excel or
aggregate functions in SQL statement.
To group data in a report, you should use GROUP argument in the report
function.
In REPORT function, the order of groups should be in accordance with the
order of ORDER BY clause in the SQL statement.
You can create reports with pictures using XLReportGen. You should store the
path and name of graphics file in the database, identify the image fields in the
report function, and specify the positioning option and size in the report
template file.
To convert from pixels to points, it is depend on the screen resolution (DPI). If
you have a 96 dpi screen (Windows PC), 4 pixels are equal to 3 points.
It is very useful to create a temporary table. You can prepare data using
INSERT/UPDATE/DELETE/INSERT SELECT, and then make a report using
REPORT function.
You can write a program to make an XRF file using C, perl or DOS shell, and
then run XLReportGen to generate the report. The two steps can be written
into a batch file.
- 63 -
If the ranges of groups are different from the range of details, it may be slow to
generate the report.
- 64 -
Chapter 9 XRF File Reference
9.1 XRF File Format
The layout of an XRF file is as the following:
ExcelReport Version 2.0
[Data Source]
……
[File]
……
[Parameter]
……
[SQL]
……
“ExcelReport” is the flag of XRF file. “Version 2.0” is the version of XRF file.
An XRF file contains several sections. The sections of [Data Source], [File],
and [Parameter] consist of a group of related settings. The sections and
settings are listed in the XRF file in the following format:
[section name]
keyname=value
In this example, [section name] is the name of a section. The enclosing
brackets ([]) are required, and the left bracket must be in the leftmost column
on the screen.
The keyname=value statement defines the value of each setting. A keyname is
the name of a setting. It can consist of any combination of letters and digits,
and must be followed immediately by an equal sign (=). The value can be an
integer, a string, or a quoted string, depending on the setting.
You can include comments in these sections. You must begin each line of a
- 65 -
comment with a semicolon (;).
The [SQL] section consists of functions. Each function is begin with the “@”
character. Syntax:
@functionno=functionname(arguments)
sqlstatement
The functionno is the label of function.
The functionname represents a function.
The arguments define various properties for the function. An argument takes
the form Name="Value". The argument value can be delimited by single or
double quotes.
The sqlstatement is a SQL statement.
You can use comments in [SQL] section. A comment is the “/*” characters,
followed by any sequence of characters (including new lines), followed by the
“*/” characters. You cannot nest comments.
9.2 [Data Source] Section
The [Data Source] section contains information how to connect to data
sources.
Name1=<name1>
Name2=<name2>
……
Name10=<name10>
These settings specify the names of data sources you want to connect to.
Name1 specifies the name of the first data source. Name2 specifies the name
of the second data source…… You can define up to 10 data sources in one
XRF file. You can make a connection to a data source using an ODBC data
source name or a connection string. Even if you use a connection string to
- 66 -
make a connection, you should define a name that you can reference in
functions.
User1=<username1>
User2=<username2>
……
User10=<username10>
These settings specify the user names. If you use an ODBC data source name
to make a connection, you should define user name and password. If you use
a connection string to make a connection, XLReportGen will ignore the setting.
User1 specifies the user name of the first data source. User2 specifies the user
name of the second data source…… They are optional settings. If defined
default user and password in ODBC data source, you may not define them.
Password1=<password1>
Password2=<password2>
……
Password10=<password10>
These settings specify the user passwords. If you use an ODBC data source
name to make a connection, you should define user name and password. If
you use a connection string to make a connection, XLReportGen will ignore
the setting. Password1 specifies the password of the first data source.
Password2 specifies the password of the second data source…… They are
optional settings. If defined default user and password in ODBC data source,
you may not define them.
ConnectionString1=<connectionstring1>
ConnectionString2=<connectionstring2>
- 67 -
……
ConnectionString10=<connectionstring10>
These settings specify the connection strings. If you defined a connection
string, XLReportGen will make a connection to the data source using the
connection string, and ignore the settings of name, user and password. But
you must define a name that you can reference in functions.
ConnectionString1 specifies the connection string of the first data source.
ConnectionString2 specifies the connection string of the second data
source…… They are optional settings. If no connection string, XLReportGen
will make a connection to data source using the ODBC data source name.
EncryptPassword =Y/N
This setting specifies how to save the passwords of data sources. If the value
is Y, the passwords will be saved in an encrypted format. If the value is N, the
passwords will be saved in plain text.
9.3 [FILE] Section
[FILE] section contains information about files.
ReportTemplateFileName=<templatefilename>
This setting specifies the name of report template file. <templatefilename>
value is the name and path of report template file. The file path can be a
relative path or an absolute path. If it is a relative path, the base path is the
path of XRF file.
ReportFileName=<reportfilename>
This setting specifies the name of report file. <reportfilename> value is the
name and path of report file. The file path can be a relative path or an absolute
- 68 -
path. If it is a relative path, the base path is the path of XRF file. In
<reportfilename>, you can use parameters.
ProtectReport=Y/N
This setting specifies whether the report generated is protected. If the value is
Y, the report is protected, and cannot be modified. If the value is N, the report
is not protected. Default is N.
ProtectionPassword=<protectionpassword>
This setting specifies the password that is used to protect the report.
<protectionpassword> value is the password. This setting is valid when
ProtectReport is Y.
LogFileName=<logfilename>
This setting specifies the name of log file. <logfilename> value is the name and
path of log file. The file path can be a relative path or an absolute path. If it is a
relative path, the base path is the path of XRF file. In <logfilename>, you can
use parameters.
9.4 [PARAMETER] Section
[PARAMETER] section contains information about parameters.
Name1=<name1>
Name2=<name2>
……
Name10=<name10>
These settings specify the names of parameters. Name1 specify the name of
- 69 -
the first parameter, Name2 specifies the name of the second parameter.…..
You can define up to 10 parameters in one XRF file.
Title1=<title1>
Title2=<title2>
……
Title10=<title10>
These settings specify the titles of parameters. Title1 specifies the title of the
first parameter. Title2 specifies the title of the second parameter……
Default1=<default1>
Default2=<default2>
……
Default10=<default10>
These settings specify the default values of parameters. Default1 specifies the
default value of the first parameter. Default2 specifies the default value of the
second parameter.…..
- 70 -
Chapter 10 License and Support
10.1 License
Your Agreement to This License
You should carefully read the following terms and conditions before using,
installing, copying, or distributing this software. Your use, installation, copying,
or distribution of XLReportGen indicates your acceptance of this agreement
("License").
NO WARRANTY
XLREPORTGEN IS DISTRIBUTED "AS IS". NO WARRANTY OF ANY KIND
IS EXPRESSED OR IMPLIED. THE AUTHOR WILL NOT BE LIABLE FOR
DATA LOSS, DAMAGES, LOSS OF PROFITS OR ANY OTHER KIND OF
LOSS WHILE USING OR MISUSING THIS SOFTWARE.
Evaluation
XLReportGen is not free software. You may use this software for evaluation
purposes without charge for a period of 30 days. If you use this software after
the 30 day evaluation period, you must purchase it.
Use
Each Licensed Copy of this Software may either be used by a user who uses
the software personally on one or more computers, or installed on a single
computer used nonsimultaneously by multiple people, but not both. This is not
a concurrent use license. If you install the Software onto a multi-user platform,
server or network, each and every individual user of the Software must be
licensed separately.
- 71 -
Distribution
You may copy the evaluation version of this software and documentation as
you wish, and give exact copies of the original evaluation version to anyone,
and distribute the evaluation version of the software and documentation in its
unmodified form via electronic means. You are specifically prohibited from
charging, or requesting donations without permission from the author.
You may not modify, copy, share, distribute, re-sell, transfer or sub-license the
full version of this software except that you may make copies for archive
purposes only. Any such unauthorized use shall result in immediate and
automatic termination of this license.
Edition
There are 2 types of editions issued for XLReportGen.
1) XLReportGen Standard Edition
User can execute no more than 50 SQL statements in one report processing.
2) XLReportGen Professional Edition
User can execute SQL statements unlimitedly in one report processing.
10.2 Technical Support
If you encounter any problems in usage of XLReportGen, and need the
technical support:
Go to our support web site at:
http://www.ljzsoft.com/support.htm
Send email to [email protected]
- 72 -