1
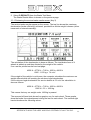
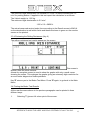
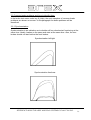
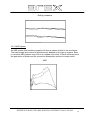
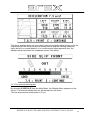
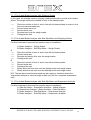
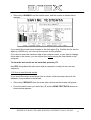
3.3.1.1 The maximum brake force for each individual wheel
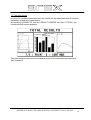
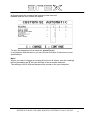
The colours correspond to the graphs as follows:
left front
right front
left rear
right rear
blue
purple
orange
yellow
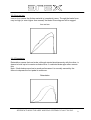
3.3.1.2 The difference between left and right per axle.
This is expressed as a percentage of the higher of the two on that particular axle. In
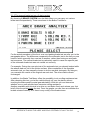
the example shown the front the difference is 35%. The rear axle difference is 11%.
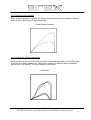
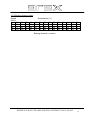
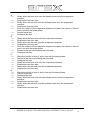
3.3.1.3 The brake force ratio front to rear.
In the example shown 84% of the total brake force was measured on the front axle
and 16% of the total brake force on the rear axle.
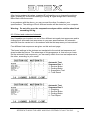
N.B. On a 2-plate version, the results of front and rear axle are shown in one screen.
Note that the two axles were not tested at the same time and therefore:
-
The graphs should not be compared to each other (especially not with
regard to synchronisation problems)
The brake force ratio front to rear may not be correct because of the possible
difference in pedal force applied.
3.3.1.4 The weight
The weight (if measured or entered manually), in this example is 1125 kg.
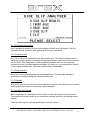
3.3.1.5 The front axle side slip
The side slip on the front axle in the example shown is 8 m/km.
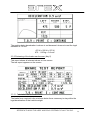
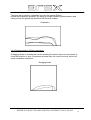
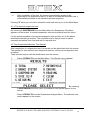
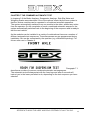
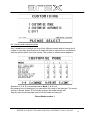
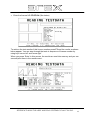
3.3.2 Reviewing the parking brake result screen (Key 4)
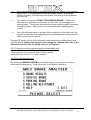
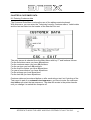
This screen shows the parking brakes maximum deceleration (brake efficiency)
achieved, provided the weight is known (either measured or entered manually). The
left hand side shows the graphs, the right hand side the values.
REFERENCE BOOK FOR AREX MODULAR SYSTEMS GC1400/1700/2002
23