1
Red Hat Enterprise Linux 6 Developer Guide An introduction to application development tools in Red Hat Enterprise Linux 6 Red Hat Enterprise Linux 6 Developer Guide An introduction to application development tools in Red Hat Enterprise Linux 6 Edited by Jacquelynn East Red Hat Custo mer Co ntent Services [email protected] m Do n Do mingo Red Hat Custo mer Co ntent Services ddo mingo @redhat.co m Ro bert Krátký Red Hat Custo mer Co ntent Services [email protected] m Legal Notice Co pyright © 20 12 Red Hat, Inc. and o thers. This do cument is licensed by Red Hat under the Creative Co mmo ns Attributio n-ShareAlike 3.0 Unpo rted License. If yo u distribute this do cument, o r a mo dified versio n o f it, yo u must pro vide attributio n to Red Hat, Inc. and pro vide a link to the o riginal. If the do cument is mo dified, all Red Hat trademarks must be remo ved. Red Hat, as the licenso r o f this do cument, waives the right to enfo rce, and agrees no t to assert, Sectio n 4 d o f CC-BY-SA to the fullest extent permitted by applicable law. Red Hat, Red Hat Enterprise Linux, the Shado wman lo go , JBo ss, MetaMatrix, Fedo ra, the Infinity Lo go , and RHCE are trademarks o f Red Hat, Inc., registered in the United States and o ther co untries. Linux ® is the registered trademark o f Linus To rvalds in the United States and o ther co untries. Java ® is a registered trademark o f Oracle and/o r its affiliates. XFS ® is a trademark o f Silico n Graphics Internatio nal Co rp. o r its subsidiaries in the United States and/o r o ther co untries. MySQL ® is a registered trademark o f MySQL AB in the United States, the Euro pean Unio n and o ther co untries. No de.js ® is an o fficial trademark o f Jo yent. Red Hat So ftware Co llectio ns is no t fo rmally related to o r endo rsed by the o fficial Jo yent No de.js o pen so urce o r co mmercial pro ject. The OpenStack ® Wo rd Mark and OpenStack Lo go are either registered trademarks/service marks o r trademarks/service marks o f the OpenStack Fo undatio n, in the United States and o ther co untries and are used with the OpenStack Fo undatio n's permissio n. We are no t affiliated with, endo rsed o r spo nso red by the OpenStack Fo undatio n, o r the OpenStack co mmunity. All o ther trademarks are the pro perty o f their respective o wners. Abstract This do cument describes the different features and utilities that make Red Hat Enterprise Linux 6 an ideal enterprise platfo rm fo r applicatio n develo pment. It fo cuses o n Eclipse as an end-to end integrated develo pment enviro nment (IDE), but also includes co mmand line to o ls and o ther utilities o utside Eclipse. T able of Cont ent s T able of Contents .Preface . . . . . . . . . . . . . . . . . . . . . . . . . . . . . . . . . . . . . . . . . . . . . . . . . . . . . . . . . . . . . . . . . . . . . . . . . . . . . . . . . . . . 3. . . . . . . . . . 1. G etting Help and G iving Feed b ac k 3 . .hapt C . . . .er . .1. .. Eclipse . . . . . . .Development . . . . . . . . . . . . Environment . . . . . . . . . . . . . . . . . . . . . . . . . . . . . . . . . . . . . . . . . . . . . . . . . . . . . . . . 4. . . . . . . . . . 1.1. Starting an Ec lip s e p ro jec t 4 1.2. Ec lip s e Us er Interfac e 7 1.3. Ed iting C/C+ + So urc e Co d e in Ec lip s e 18 1.4. Ed iting Java So urc e Co d e in Ec lip s e 22 1.5. Ec lip s e RPM Build ing 23 1.6 . Ec lip s e Do c umentatio n 24 . .hapt C . . . .er . .2. .. Collaborat . . . . . . . . . ing . . . . . . . . . . . . . . . . . . . . . . . . . . . . . . . . . . . . . . . . . . . . . . . . . . . . . . . . . . . . . . . . .2. 7. . . . . . . . . . 2 .1. Co nc urrent Vers io ns Sys tem (CVS) 27 2 .2. Ap ac he Sub vers io n (SVN) 29 2 .3. G it 35 . .hapt C . . . .er . .3. . .Libraries . . . . . . . .and . . . .Runt . . . . ime . . . .Support . . . . . . . . . . . . . . . . . . . . . . . . . . . . . . . . . . . . . . . . . . . . . . . . . . . . . .4. 1. . . . . . . . . . 3 .1. Vers io n Info rmatio n 41 3 .2. Co mp atib ility 3 .3. Lib rary and Runtime Details 42 43 . .hapt C . . . .er . .4. .. .Compiling . . . . . . . . .and . . . .Building . . . . . . . . . . . . . . . . . . . . . . . . . . . . . . . . . . . . . . . . . . . . . . . . . . . . . . . . . . . .6. 2. . . . . . . . . . 4 .1. G NU Co mp iler Co llec tio n (G CC) 4 .2. Dis trib uted Co mp iling 62 73 4 .3. Auto to o ls 4 .4. Ec lip s e Built-in Sp ec file Ed ito r 4 .5. CDT in Ec lip s e 73 75 75 4 .6 . b uild -id Uniq ue Id entific atio n o f Binaries 4 .7. So ftware Co llec tio ns and s c l-utils 77 77 . .hapt C . . . .er . .5. . .Debugging . . . . . . . . . . . . . . . . . . . . . . . . . . . . . . . . . . . . . . . . . . . . . . . . . . . . . . . . . . . . . . . . . . . . . . . . . .7. 9. . . . . . . . . . 5 .1. ELF Exec utab le Binaries 5 .2. Ins talling Deb ug info Pac kag es 5 .3. G DB 5 .4. Variab le Trac king at As s ig nments 5 .5. Pytho n Pretty-Printers 79 80 83 95 95 5 .6 . Deb ug g ing C/C+ + Ap p lic atio ns with Ec lip s e 98 . .hapt C . . . .er . .6. .. Profiling . . . . . . . . . . . . . . . . . . . . . . . . . . . . . . . . . . . . . . . . . . . . . . . . . . . . . . . . . . . . . . . . . . . . . . . . .1.0. 0. . . . . . . . . . 6 .1. Valg rind 10 0 6 .2. O Pro file 10 3 6 .3. Sys temTap 10 7 6 .4. Perfo rmanc e Co unters fo r Linux (PCL) To o ls and p erf 6 .5. ftrac e 111 114 . .hapt C . . . .er . .7. .. Red . . . . Hat . . . .Developer . . . . . . . . . T. oolset . . . . . . . . . . . . . . . . . . . . . . . . . . . . . . . . . . . . . . . . . . . . . . . . . . . . . . .1.1. 6. . . . . . . . . . 7 .1. What is Red Hat Develo p er To o ls et? 116 7 .2. What Do es Red Hat Develo p er To o ls et O ffer? 116 7 .3. Platfo rm Co mp atib ility 117 7 .4. Ad d itio nal Res o urc es 117 . .hapt C . . . .er . .8. .. Red . . . . Hat . . . .Soft . . . .ware . . . . Collect . . . . . . ions . . . . . . . . . . . . . . . . . . . . . . . . . . . . . . . . . . . . . . . . . . . . . . . . . . .1.1. 9. . . . . . . . . . 8 .1. What is Red Hat So ftware Co llec tio ns ? 119 8 .2. What Do es Red Hat So ftware Co llec tio ns O ffer? 119 1 Red Hat Ent erprise Linux 6 Developer G uide 8 .3. Whic h Platfo rms Are Sup p o rted ? 122 8 .4. Ho w to Us e Red Hat So ftware Co llec tio ns ? 8 .5. Ho w to Dep lo y Ap p lic atio ns That Us e Red Hat So ftware Co llec tio ns ? 8 .6 . Ad d itio nal Res o urc es 122 123 123 . .hapt C . . . .er . .9. .. Document . . . . . . . . . at . . ion ...T . .ools . . . . . . . . . . . . . . . . . . . . . . . . . . . . . . . . . . . . . . . . . . . . . . . . . . . . . . . . .1.2. 4. . . . . . . . . . 9 .1. Pub lic an 124 9 .2. Do xyg en 129 .Appendix . . . . . . . . . . . . . . . . . . . . . . . . . . . . . . . . . . . . . . . . . . . . . . . . . . . . . . . . . . . . . . . . . . . . . . . . . . . . . . . . . .1. 37 ........... A .1. mallo p t 137 . . . . . . . .rim malloc_t . . . . . . . . . . . . . . . . . . . . . . . . . . . . . . . . . . . . . . . . . . . . . . . . . . . . . . . . . . . . . . . . . . . . . . . . . . .1. 37 ........... . . . . . . . . .at malloc_st . .s. . . . . . . . . . . . . . . . . . . . . . . . . . . . . . . . . . . . . . . . . . . . . . . . . . . . . . . . . . . . . . . . . . . . . . . .1. 38 ........... . . . . her Furt . . . Informat . . . . . . . .ion . . . . . . . . . . . . . . . . . . . . . . . . . . . . . . . . . . . . . . . . . . . . . . . . . . . . . . . . . . . . . . . . . . . .1. 38 ........... . . . . . . . . .Hist Revision . . . ory . . . . . . . . . . . . . . . . . . . . . . . . . . . . . . . . . . . . . . . . . . . . . . . . . . . . . . . . . . . . . . . . . . . . . . .1. 39 ........... I.ndex . . . . . . . . . . . . . . . . . . . . . . . . . . . . . . . . . . . . . . . . . . . . . . . . . . . . . . . . . . . . . . . . . . . . . . . . . . . . . . . . . .1. 39 ........... 2 Preface Preface This book describes the some of the more commonly-used programming resources in Red Hat Enterprise Linux 6. Each phase of the application development process is described as a separate chapter, enumerating tools that accomplish different tasks for that particular phase. Note that this is not a comprehensive listing of all available development tools in Red Hat Enterprise Linux 6. In addition, each section herein does not contain detailed documentation of each tool. Rather, this book provides a brief overview of each tool, with a short description of updates to the tool in Red Hat Enterprise Linux 6 and (more importantly) with references to more detailed information. 1. Get t ing Help and Giving Feedback 1.1. Do You Need Help? If you experience difficulty with a procedure described in this documentation, visit the Red Hat Customer Portal at http://access.redhat.com. Through the customer portal, you can: search or browse through a knowledgebase of technical support articles about Red Hat products. submit a support case to Red Hat Global Support Services (GSS). access other product documentation. Red Hat also hosts a large number of electronic mailing lists for discussion of Red Hat software and technology. You can find a list of publicly available mailing lists at https://www.redhat.com/mailman/listinfo. Click on the name of any mailing list to subscribe to that list or to access the list archives. 1.2. We Need Feedback! If you find a typographical error in this manual, or if you have thought of a way to make this manual better, we would love to hear from you! Please submit a report in Bugzilla: http://bugzilla.redhat.com/ against the product R ed _H at _En t erp rise_Lin u x. When submitting a bug report, be sure to mention the manual's identifier: doc-Developer_Guide If you have a suggestion for improving the documentation, try to be as specific as possible when describing it. If you have found an error, please include the section number and some of the surrounding text so we can find it easily. 3 Red Hat Ent erprise Linux 6 Developer G uide Chapter 1. Eclipse Development Environment Eclipse is a powerful development environment that provides tools for each phase of the development process. It is integrated into a single, fully configurable user interface for ease of use, featuring a pluggable architecture which allows for extension in a variety of ways. Eclipse integrates a variety of disparate tools into a unified environment to create a rich development experience. The Valgrind plug-in, for example, allows programmers to perform memory profiling (normally done through the command line) through the Eclipse user interface. This functionality is not exclusive only to Eclipse. Being a graphical application, Eclipse is a welcome alternative to developers who find the command line interface intimidating or difficult. In addition, Eclipse's built-in H elp system provides extensive documentation for each integrated feature and tool. This greatly decreases the initial time investment required for new developers to become fluent in its use. The traditional (that is, mostly command line based) Linux tools suite (g cc, g d b, etc) and Eclipse offer two distinct approaches to programming. Most traditional Linux tools are far more flexible, subtle, and (in aggregate) more powerful than their Eclipse-based counterparts. These traditional Linux tools, on the other hand, are more difficult to master, and offer more capabilities than are required by most programmers or projects. Eclipse, by contrast, sacrifices some of these benefits in favor of an integrated environment, which in turn is suitable for users who prefer their tools accessible in a single, graphical interface. 1.1. St art ing an Eclipse project Install eclipse with the following command: # yum i nstal l ecl i pse Once installed, Eclipse can be started either by manually executing /usr/bi n/ecl i pse or by using the system menu created. Eclipse stores all project and user files in a designated workspace. You can have multiple workspaces and can switch between each one on the fly. However, Eclipse will only be able to load projects from the current active workspace. To switch between active workspaces, navigate to File > Swit ch Wo rksp ace > /path/to/workspace. You can also add a new workspace through the Wo rksp ace Lau n ch er wizard; to open this wizard, navigate to File > Swit ch Wo rksp ace > O t h er. 4 Chapt er 1 . Eclipse Development Environment Fig u re 1.1. Wo rksp ace Lau n ch er For information about configuring workspaces, see Reference > Preferences > Workspace in the Workbench User Guide (H elp C o n t en t s). A project can be imported directly into Eclipse if it contains the necessary Eclipse metafiles. Eclipse uses these files to determine what kind of perspectives, tools, and other user interface configurations to implement. As such, when attempting to import a project that has never been used on Eclipse, it may be necessary to do so through the N ew Pro ject wizard instead of the Imp o rt wizard. D oing so will create the necessary Eclipse metafiles for the project, which you can also include when you commit the project. 5 Red Hat Ent erprise Linux 6 Developer G uide Fig u re 1.2. N ew Pro ject Wiz ard The Imp o rt wizard is suitable mostly for projects that were created or previously edited in Eclipse, that is, projects that contain the necessary Eclipse metafiles. 6 Chapt er 1 . Eclipse Development Environment Fig u re 1.3. Imp o rt Wiz ard 1.2. Eclipse User Int erface The entire user interface in Figure 1.4, “ Eclipse User Interface (default)” is referred to as the Eclipse workbench. It is generally composed of a code Ed it o r, Pro ject Exp lo rer window, and several views. All elements in the Eclipse workbench are configurable, and fully documented in the Workbench User Guide (H elp C o n t en t s). See Section 1.2.3, “ Customize Perspective” for a brief overview on customizing the user interface. Eclipse features different perspectives. A perspective is a set of views and editors most useful to a specific type of task or project; the Eclipse workbench can contain one or more perspectives. Figure 1.4, “ Eclipse User Interface (default)” features the default perspective for C/C++. Eclipse also divides many functions into several classes, housed inside distinct menu items. For example, the Pro ject menu houses functions relating to compiling/building a project. The Win d o w menu contains options for creating and customizing perspectives, menu items, and other user interface elements. For a brief overview of each main menu item, see R ef eren ce> → C /C + + Men u b ar in the C/C++ Development User Guide or R ef eren ce → Men u s an d Act io n s in the Java Development User Guide. These are found in the Eclipse help. 7 Red Hat Ent erprise Linux 6 Developer G uide The following sections provide a high-level overview of the different elements visible in the default user interface of the Eclipse integrated development environment (ID E). The Eclipse workbench provides a user interface for many features and tools essential for every phase of the development process. This section provides an overview of Eclipse's primary user interface. Fig u re 1.4 . Eclip se U ser In t erf ace ( d ef au lt ) Figure 1.4, “ Eclipse User Interface (default)” displays the default workbench for C/C++ projects. To switch between available perspectives in a workbench, press C trl +F8. For some hints on perspective customization, see Section 1.2.3, “ Customize Perspective” . The figures that follow describe each basic element visible in the default C/C++ perspective. 8 Chapt er 1 . Eclipse Development Environment Fig u re 1.5. Eclip se Ed it o r The Ed it o r is used to write and edit source files. Eclipse can auto-detect and load an appropriate language editor (for example, C Editor for files ending in . c) for most types of source files. To configure the settings for the Ed i to r, navigate to Win d o w > Pref eren ces > language (for example, Java, C++) > C o d e St yle. Fig u re 1.6 . Pro ject Exp lo rer The Pro ject Exp lo rer View provides a hierarchical view of all project resources (binaries, source files, etc.). You can open, delete, or otherwise edit any files from this view. The Vi ew Menu button in the Pro ject Exp lo rer View allows you to configure whether projects or working sets are the top-level items in the Pro ject Exp lo rer View. A working set is a group of 9 Red Hat Ent erprise Linux 6 Developer G uide projects arbitrarily classified as a single set; working sets are handy in organizing related or linked projects. Fig u re 1.7. O u t lin e Win d o w The O u t lin e window provides a condensed view of the code in a source file. It details different variables, functions, libraries, and other structural elements from the selected file in the Ed it o r, all of which are editor-specific. Fig u re 1.8. C o n so le View Some functions and plugged-in programs in Eclipse send their output to the C o n so le view. This view's D i spl ay Sel ected C o nso l e button allows you to switch between different consoles. 10 Chapt er 1 . Eclipse Development Environment Fig u re 1.9 . T asks View The T asks view allows you to track specially-marked reminder comments in the code. This view shows the location of each task comment and allows you to sort them in several ways. Fig u re 1.10. Samp le o f T racked C o mmen t Most Eclipse editors track comments marked with //FIXME or //T O D O tags. Tracked comments— that is, task tags—are different for source files written in other languages. To add or configure task tags, navigate to Win d o w > Pref eren ces and use the keyword task tag s to display the task tag configuration menus for specific editors/languages. 11 Red Hat Ent erprise Linux 6 Developer G uide Fig u re 1.11. T ask Pro p ert ies Alternatively, you can also use Ed it > Ad d T ask to open the task Pro p ert ies menu (Figure 1.11, “ Task Properties” ). This will allow you to add a task to a specific location in a source file without using a task tag. Fig u re 1.12. Pro b lems View The Pro b lems view displays any errors or warnings that occurred during the execution of specific actions such as builds, cleans, or profile runs. To display a suggested " quick fix" to a specific problem, select it and press C trl +1. 1.2.1. T he Quick Access Menu 12 Chapt er 1 . Eclipse Development Environment One of the most useful Eclipse tips is to use the q u ick access menu. Typing a word in the q u ick access menu will present a list of Views, Commands, Help files and other actions related to that word. To open this menu, press C trl +3. Fig u re 1.13. Q u ick Access Men u In Figure 1.13, “ Quick Access Menu” , clicking Views > Pro ject Exp lo rer will select the Pro ject Exp lo rer window. Click any item from the C o mman d s, Men u s, N ew, or Pref eren ces categories to run the selected item. This is similar to navigating to or clicking the respective menu options or taskbar icons. You can also navigate through the q u ick access menu using the arrow keys. 1.2.2. Keyboard Short cut s It is also possible to view a complete list of all keyboard shortcut commands; to do so, press Shi ft+C trl +L. 13 Red Hat Ent erprise Linux 6 Developer G uide Fig u re 1.14 . K eyb o ard Sh o rt cu t s To configure Eclipse keyboard shortcuts, press Shi ft+C trl +L again while the K eyb o ard Sh o rt cu t s list is open. 14 Chapt er 1 . Eclipse Development Environment Fig u re 1.15. C o n f ig u rin g K eyb o ard Sh o rt cu t s 1.2.3. Cust omiz e Perspect ive To customize the current perspective, navigate to Win d o w > C u st o miz e Persp ect ive. This opens the C u st o miz e Persp ect ive menu, allowing the visible tool bars, main menu items, command groups, and shortcuts to be configured. The location of each view within the workbench can be customized by clicking on a view's title and dragging it to a desired location. Fig u re 1.16 . C u st o miz e Persp ect ive Men u Figure 1.16, “ Customize Perspective Menu” displays the T o o l B ar Visib ilit y tab. As the name suggests, this tab allows you to toggle the visibility of the tool bars (Figure 1.17, “ Toolbar” ). 15 Red Hat Ent erprise Linux 6 Developer G uide Fig u re 1.17. T o o lb ar The following figures display the other tabs in the C u st o miz e Persp ect ive Men u : Fig u re 1.18. Men u Visib ilit y T ab The Men u Visib ilit y tab configures what functions are visible in each main menu item. For a brief overview of each main menu item, see Reference > C/C++ Menubar in the C/C++ Development User Guide or Reference > Menus and Actions in the Java Development User Guide. 16 Chapt er 1 . Eclipse Development Environment Fig u re 1.19 . C o mman d G ro u p Availab ilit y T ab Command groups add functions or options to the main menu or tool bar area. Use the C o mman d G ro u p Availab ilit y tab to add or remove a Command group. The Men u b ar d et ails and T o o lb ar d et ails fields display the functions or options added by the Command group to either Main Menu or Toolbar Area, respectively. 17 Red Hat Ent erprise Linux 6 Developer G uide Fig u re 1.20. Sh o rt cu t s T ab The Sh o rt cu t s tab configures what menu items are available under the following submenus: File > N ew Win d o w > O p en Persp ect ive Win d o w > Sh o w View 1.3. Edit ing C/C++ Source Code in Eclipse Red Hat Enterprise Linux 6 provides Eclipse plug-ins for C/C++ development with the CD T. Specialized editors for C/C++ source code, makefiles, and GNU Autotools files are included. Functionality is also available for running and debugging programs. The Eclipse text editor supports most of the features expected in a text editor, such as cut, copy, paste, and block selection (C trl +Shi ft+A). It also has some relatively unique features, such as the ability to move a selection (Al t+Up/D o wn Arro w). Of particular interest to C/C++ programmers is the Content Assist feature. This feature presents a popup window with possible functions, variables, and templates for the current file/location. It is invoked by pressing C trl +Space while the cursor is at the desired location. See Section 1.3.1, “ l i bho ver Plug-in” for more information on completion of function calls from libraries. The Eclipse C/C++ code editor also has error highlighting and refactoring. 18 Chapt er 1 . Eclipse Development Environment Code errors and warnings are annotated with colored wavy underlines. These errors and warnings may be present as code is entered into the editor, or they may be present only after a build has occurred and the compiler output has been transformed into these markers. The provided refactoring tools include the ability to rename code elements. This change can then be reflected in both uses and declarations of the function. See Section 5.6, “ D ebugging C/C++ Applications with Eclipse” , or Section 4.3.1, “ Autotools Plug-in for Eclipse” for more information, or see C o n cep t s → C o d in g aid s, C o n cep t s → Ed it in g C /C + + Files, and T asks → Writ e co d e in the C/C++ Development User Guide, found in the Help Contents. 1.3.1. l i bho ver Plug-in The l i bho ver plug-in for Eclipse provides plug-and-play hover help support for the GNU C Library and GNU C++ Standard Library. This allows developers to see existing documentation on g l i bc and l i bstd c+ + libraries within the Eclipse ID E in a more seamless and convenient manner via hover help and code completion. C + + Lan g u ag e D ocumentation for method completion is not supported for C++; only the prototypes from header files are supplied. In addition, the ability to add header files to the source file is not supported for C++ methods. For C++ library resources, l i bho ver has to index the file using the CD T indexer. Indexing parses the given file in context of a build; the build context determines where header files come from and how types, macros, and similar items are resolved. To be able to index a C++ source file, l i bho ver usually requires an actual build to be performed first, although in some cases it may already know where the header files are located. A C++ member function name is not enough information to look up its documentation so the l i bho ver plug-in may require indexing for C++ sources. C++ allows different classes to have members of the same name, and even within a class, members may have the same name but with different method signatures. This requires the class name and parameter signature of the function to be provided to determine exactly which member is being referenced. In addition, C++ also has type definitions and templated classes. Such information requires parsing an entire file and its associated i ncl ud e files; l i bho ver can only do this via indexing. C Lan g u ag e For C functions, performing a completion (C trl +Space) will provide the list of C functions added to the potential sources (for example, typing prin and then hitting C trl +Space will list pri ntf as one of the possible completions) and the documentation is viewed in an additional window, for determining exactly what C function is required. 19 Red Hat Ent erprise Linux 6 Developer G uide Fig u re 1.21. U sin g C o d e C o mp let io n C functions can be referenced in their documentation by name alone. As such, l i bho ver does not have to index C source files in order to provide hover help or code completion. The appropriate header file include statement for a C library function can be automatically added if it is not already present. Select the C function in the file and use right-click > So u rce > Ad d In clu d e to automatically add the required header files to the source. This can also be done using Shi ft+C trl +N. 1 .3.1 .1 . Se t up and Usage Hover help for all installed l i bho ver libraries is enabled by default, and it can be disabled per project. To disable or enable hover help for a particular project, right-click the project name and click Pro p ert ies. On the menu that appears, navigate to C /C + + G en eral > D o cu men t at io n . Check or uncheck a library in the H elp b o o ks section to enable or disable hover help for that particular library. 20 Chapt er 1 . Eclipse Development Environment Fig u re 1.22. En ab lin g /D isab lin g H o ver H elp D isabling hover help from a particular library may be preferable, particularly if multiple l i bho ver libraries overlap in functionality. For example, if a l i bho ver plug-in for a C library were manually installed, such as the newl i b C library (note that newl i b C library plug-in is not provided in Red Hat Enterprise Linux 6). The hover help would contain C functions whos names overlap with those in the GNU C library (provided by default). A user would not want both of these hover helps active at once, so disabling one would be practical. When multiple l i bho ver libraries are enabled and there exists a functional overlap between libraries, the Help content for the function from the first listed library in the H elp b o o ks section will appear in hover help (that is, in Figure 1.22, “ Enabling/D isabling Hover Help” , g l i bc). For code completion, l i bho ver will offer all possible alternatives from all enabled l i bho ver libraries. To use hover help, hover the mouse over a function name or member function name in the C /C + + Ed it o r. After a short time, no more than a few seconds, l i bho ver will display library documentation on the selected C function or C++ member function. 21 Red Hat Ent erprise Linux 6 Developer G uide Fig u re 1.23. U sin g H o ver H elp 1.4 . Edit ing Java Source Code in Eclipse Red Hat Enterprise Linux 6 provides Eclipse plug-ins for Java (Java SE) development with the JD T. Specialized editors for Java source code as well as for ant bui l d . xml files are included. Functionality is also available for running and debugging programs. Eclipse provides a fully-featured interactive development environment for Java developers. N ew Pro ject Wiz ard Eclipse's N ew Pro ject Wiz ard performs most of the boilerplate setup required to start a Java project. This allows the user to select and customize various options, such as which Java Runtime Environment to use, or the preferred project file tree layout. Follow the same procedure to export an existing project, and when prompted for a location, enter the existing project's location instead. For more information regarding setting up a new Java project, see H elp > H elp C o n t en t s > Java D evelo p men t > G et t in g St art ed > B asic T u t o rial > C reat in g Yo u r First Java Pro ject . C o n t en t Assist an ce The Eclipse Java D evelopment Environment (JD T) increases productivity and reduces errors by providing a rich set of content assistance features, usually invoked by pressing C trl + Space. This includes completion for method names in your code or in libraries, inserting parameter names in Javadoc, and filling in parameters when calling a method. This is fully customizable, allowing the options of suppressing certain suggestions or adding custom code templates to be filled in while writing code. For an overview of these features, see H elp > H elp C o n t en t s > Java D evelo p men t U ser G u id e > T ip s an d T ricks. 22 Chapt er 1 . Eclipse Development Environment C o d e Fo rmat t in g Code formatting, accessed by pressing C trl + Shi ft + F, is another useful feature present in the JD T. The formatting settings can be changed by navigating to Win d o w > Pref eren ces > Java > C o d e St yler > Fo rmat t er where there is the option of using a set of installed formatting profiles, or creating a new one to fit the style of the project. D eb u g g in g Feat u res The JD T also comes with several debugging features. Create breakpoints by double-clicking on the left hand margin at the desired line of code. When the debugger is run, the program will stop at that line of code which is useful in detecting the location of errors. The D ebug Perspective, configured the first time the debugger is run, is a different layout that makes views related to debugging more prominent. For example, the Exp ressio n s view allows evaluation of Java expressions in the context of the current frame. The views that make up the D ebug Perspective, like all views, are accessed through Win d o w > Sh o w View and you do not have to be debugging to access these views. While debugging, hover over variables to view their values or use the Variab les view. Using the D ebug view, it is possible to control the execution of programs and explore the various frames on the stack. For more information on debugging in the JD T, see H elp > H elp C o n t en t s > Java D evelo p men t > G et t in g St art ed > B asic T u t o rial > D eb u g g in g Yo u r Pro g rams. JD T Feat u res The JD T is highly customizable and comes with an extensive feature list which can be viewed through the settings in Win d o w > Pref eren ces > Java, and through the Java settings in Pro ject > Pro p ert ies. For detailed documentation of the JD T and its features, see the Java Development User Guide found in H elp > H elp C o n t en t s > Java D evelo p men t U ser G u id e. 1.5. Eclipse RPM Building The Specfile Editor Plug-in for Eclipse provides useful features to help developers manage . spec files. This plug-in allows users to leverage several Eclipse GUI features in editing . spec files, such as auto-completion, highlighting, file hyperlinks, and folding. In addition, the Specfile Editor Plug-in also integrates the rpml i nt tool into the Eclipse interface. rpml i nt is a command line tool that helps developers detect common RPM package errors. The richer visualization offered by the Eclipse interface helps developers quickly detect, view, and correct mistakes reported by rpml i nt. The Eclipse . spec file editor plug-in also supports building RPM files from RPM projects. This feature can be used by employing an export wizard (Imp o rt → R PM → So u rce/B in ary R PM) allowing the selection of whether a source RPM (src. rpm), binary RPM, or both, are required. Build output is in the Eclipse Console view. For a limited number of build failures, there is hyperlinking support. That is, certain parts of the build failure are changed to be a hyperlink (C trl +Click) in the Eclipse Console view, which then points the user to the actual line in the . spec file that is causing the problem. 23 Red Hat Ent erprise Linux 6 Developer G uide Also of note is the wizard for importing source RPM (. src. rpm) files, found in Imp o rt → R PM → So u rce R PM). This allows the user to easily start with no configuration required, in case a source RPM has already been created. This project is then ready for editing the spec file and building (exporting) to source/binary RPMs. For further details, see the Sp ecf ile Ed it o r U ser G u id e → Imp o rt src.rp m an d exp o rt rp m an d src.rp m section in the Specfile Editor User Guide in Help Contents. 1.6. Eclipse Document at ion Eclipse features a comprehensive internal help library that covers nearly every facet of the Integrated D evelopment Environment (ID E). Every Eclipse documentation plug-in installs its content to this library, where it is indexed. To access this library, use the H elp menu. Fig u re 1.24 . H elp To open the main H elp menu, navigate to H elp > H elp C o n t en t s. The H elp menu displays all the available content provided by installed documentation plug-ins in the C o n t en t s field. 24 Chapt er 1 . Eclipse Development Environment Fig u re 1.25. H elp Men u The tabs at the bottom of the C o n t en t s field provides different options for accessing Eclipse documentation. You can navigate through each " book" by section/header or by searching via the Search field. You can also bookmark sections in each book and access them through the B o o kmarks tab. The Workbench User Guide documents all facets of the Eclipse user interface extensively. It contains very low-level information on the Eclipse workbench, perspectives, and different concepts useful in understanding how Eclipse works. The Workbench User Guide is an ideal resource for users with little to intermediate experience with Eclipse or ID Es in general. This documentation plug-in is installed by default. The Eclipse help system also includes a dynamic help feature. This feature opens a new window in the workbench that displays documentation relating to a selected interface element. To activate dynamic help, navigate to H elp > D yn amic H elp . 25 Red Hat Ent erprise Linux 6 Developer G uide Fig u re 1.26 . D yn amic H elp The rightmost window in Figure 1.26, “ D ynamic Help” displays help topics related to the O u t lin e view, which is the selected user interface element. 26 Chapt er 2 . Collaborat ing Chapter 2. Collaborating Effective revision control is essential to all multi-developer projects. It allows all developers in a team to create, review, revise, and document code in a systematic and orderly manner. Red Hat Enterprise Linux 6 supports three of the most popular open source revision control systems: CVS, SVN, and Git. The tools for these revision control systems provide access to a wide range of publicly available open source code, as well as the capability to set up individual internal code repositories. The following section provides a brief overview and references to relevant documentation for each tool. 2.1. Concurrent Versions Syst em (CVS) Concurrent Versions System (CVS) is a centralized version control system based on RCS format with a client-server architecture. It was the first version control system and the predecessor for Subversion (SVN). 2.1.1. CVS Overview This section discusses the various elements of CVS, both the good and the bad. CVS was developed when network connectivity was unreliable and would often drop out. This meant that if several files were committed at once and the network dropped out, the commit would fail. This can still occur now if a network is unreliable but is less common with modern networking infrastructure. If it happens, the CVS administrator has two options to resolve the problem. The first is to use the ad mi n command to remove stall locked files and back out the changed files. The second option is to reissue the commit command. CVS uses one central location for making back-ups, which is useful for an unstable network. It allows the enforcement of a commit policy through manually prepared triggers (automated tests, builds, Access Control Lists (ACLs), integration with a bug tracking system) due to centralized architecture. To create more detailed commits to the backup, CVS can also expand keywords that are marked by the at-sign (@) to record commit details (committer name, commit message, commit time, for example) into a committed file. In order to keep track of these commits, CVS uses a server to track the changes for each file separately and in reverse time order. By doing so, the latest version is stored directly and can be retrieved quickly, where older versions must be recomputed by the server. Each changed, committed file is tracked separately with an independent revision identifier. This can make it difficult to discover which files have been changed by the commit when multiple changed files are committed. To counter this, users should tag the repository state to refer back and view the changes when required. The CVS repository can be accessed by two methods. If the repository is on the same machine as the client (: l o cal : access method) then the client spawns the server on its behalf. If the repository is on a remote machine, the server can be started with rsh/SSH (C VS_R HS environment variable) by a client or by an inet daemon (/etc/xi netd . d /cvs) and different authentication methods (: g server: access method integrates Kerberos authentication, for example) can be used. Finally, for security a client-server approach is used with CVS. This means that the client is dependent on connectivity to the server and cannot perform any operation (committing, or reading the commit log) without permission to access the server. 2.1.2. T ypical Scenario 27 Red Hat Ent erprise Linux 6 Developer G uide This is a sequence of commands demonstrating CVS repository creation in the $C VSR O O T directory (using an absolute path to signal : l o cal : access method), importing sources from $SO UR C ES, checking them out from the repository into $WO R KD IR , modifying some files, and committing the changes. Pro ced u re 2.1. U sin g C VS 1. Initialize CVS storage. $ mkdir "$CVSROOT" $ cvs -d "$CVSROOT" init This creates the C VSR O O T subdirectory under $C VSR O O T with repositories configuration. 2. Import code from $SO UR C ES directory into CVS as $R EP O SIT O R Y , tagged with $VEND O R _T AG and $R ELEASE_T AG with a commit $MESSAG E. $ cd "$SOURCES" $ cvs -d "$CVSROOT" import -m "$MESSAGE" "$REPOSITORY" \ "$VENDOR_TAG" "$RELEASE_TAG" The $SO UR C ES content should be imported into CVS under $C VSR O O T /$R EP O SIT O R Y . It is possible to have more repositories in one CVS storage, though this example just uses the one. The $VEND O R _T AG and $R ELEASE_T AG are tags for implicit repository branches. 3. D ifferent developers can now check the code out into $WO R KD IR . $ cd "$WORKDIR" $ cvs -d "$CVSROOT" checkout "$REPOSITORY" Warning D o not check out into the original $SO UR C ES. This could cause data corruption on the client side and CVS will print errors on various CVS invocations. 4. The latest version of the CVS repository has been transferred into the $R EP O SIT O R Y subdirectory. The developer can also check out multiple repositories from one server. $ cd $REPOSITORY 5. To schedule adding a new $FILE use: $ vi "$FILE" $ cvs add "$FILE" 6. The developer can modify an $EXIST ING _FILE. $ vi "$EXISTING_FILE" 7. Finally, the developer can commit these changes with a $C O MMIT _MESSAG E. $ cvs commit -m "$COMMIT_MESSAGE" 28 Chapt er 2 . Collaborat ing It is possible to export the $C VSR O O T value as a C VSR O O T environment variable and the cvs tool will respect it. This can free the developer from repetitively supplying the -d "$C VSR O O T " option. The value is stored in the CVS helper subdirectory at initial check-out, and the CVS tool takes the value from there automatically. 2.1.3. CVS Document at ion The CVS manual page can be accessed with man cvs. There is also a local FAQ page located in /usr/share/d o c/cvs-version/FAQ . The CVS home page is located at http://www.nongnu.org/cvs/. 2.2. Apache Subversion (SVN) Subversion is a version control system that manages files and directories, the changes made to them, and can recover and examine them in case of a fault. It was created to match CVS's features and preserve the same development model, and to address any problems often encountered with CVS. This allowed CVS users to convert to SVN with minimal effort. This section will cover the installation of SVN and provide details on the everyday uses of SVN. 2.2.1. Inst allat ion SVN can be installed with a binary package, directly from source code, or from the console. The easiest way to install SVN would be through the console with the command yum i nstal l subversi o n. Selecting this option ensures that only Red Hat certified packages are used and removes the requirement to manually update them. Finally, SVN can be installed from source code, though this can be quite complex. From the SVN website, download the latest released source code and follow the instructions in the i nstal l file. 2.2.2. SVN Reposit ory In order to begin using SVN, first create a new repository. SVN has no way to determine the difference between projects; it is up to the user to administer the file tree and place the project in separate directories as they prefer. Use the following commands to create the repository: # mkdir /var/svn # svnadmin create /var/svn/repos # ls /var/svn/repos/ conf db format hooks locks README.txt This command will create the new directory /var/svn/repo s with the required database files. The SVN repository is accessed with a URL. Usually these use the standard syntax of http:// but it is not limited by this. It also accepts the following URL forms: f ile:/// D irect repository access (on local disk) h t t p :// 29 Red Hat Ent erprise Linux 6 Developer G uide Access with WebD AV protocol to Subversion-aware Apache server h t t p s:// Same as http:// but with SSL encryption svn :// Access via custom protocol to an svnserver server svn + ssh :// Same as svn:// but through an SSH tunnel. Important If the URL contains spaces place quotation marks around it to ensure the shell treats it as a single argument. Otherwise the URL will be invalid. 2.2.3. Import ing Dat a Assuming that a project consisting of multiple files has already been created, organize them so that they are all in one directory. It is recommended that you use three top-level directories named branches, tag s, and trunk. This is not required by SVN but it is a popular convention. The trunk directory should contain the projects files, and the branches and tag s directories should remain empty. For example: myproject/branches/ myproject/tags/ myproject/trunk foo.c bar.c Makefile Once the information has been organized appropriately it is time to import it into the SVN repository. This is done with the svn i mpo rt command. For example: $ svn import /path/to/mytree \ http://host.example.com/svn/repo/myproject -m "Initial import" Adding myproject/foo.c Adding myproject/bar.c Adding myproject/subdir Adding myproject/subdir/quux.h \ Committed revision 1. $ SVN creates the required directories based on how the file tree is set up. It can now be viewed at the URL created, or by the command: $ svn list http://host.example.com/svn/repo/myproject 30 Chapt er 2 . Collaborat ing 2.2.4 . Working Copies Now that the first revision of the project has been checked into the repository, it can be edited and worked on. To do this, create a working copy. This is done with the svn checko ut command. For example: $ svn checkout http://host.example.com/svn/repo/trunk A trunk/README A trunk/INSTALL A trunk/src/main.c A trunk/src/header.h ... Checked out revision 8810. $ A directory with a working copy of the project is now created on the local machine. It is also possible to specify where the local directory a project is checked out to with the following command: $ svn checkout http://host.example.com/svn/repo/trunk my-working-copy If the local directory specified does not exist, SVN will create it. Warning Every directory in the working copy contains a subdirectory called . svn. Being an administrative directory, it will not usually appear with a list command. This is an important file and should not be deleted or changed. Subversion uses this directory to manage the working copy and tampering with it will cause errors and instability. If the directory is accidentally deleted the best way to fix it is to delete the entire containing directory (a normal system delete, not svn d el ete) and run svn upd ate from a parent directory. The deleted directory will be recreated, including the missing or changed . svn directory. This can cause a loss of data. Although the working copy is now ready to edit, keep in mind that whenever the file tree changes, these changes must be sent to the repository as well. This is done with a variety of commands. svn ad d filename Newly created files or directories, including the files they contain, are flagged to be added to the repository. The next commit will add them to the repository where they can be accessed and viewed by all. svn d el ete filename Files or directories, including the files they contain, are flagged to be deleted from the repository. The next commit will remove them. However, the deleted files can still be accessed in previous revisions through SVN. svn co py filename1 filename2 Creates a new file, filename2, which is an exact copy of filename1. It then schedules filename2 for addition on the next commit. Note that svn co py does not create intermediate directories unless the --parents option is passed. svn mo ve filename1 filename2 31 Red Hat Ent erprise Linux 6 Developer G uide This is the same as svn co py filename1 filename2 followed by svn d el ete filename1. A copy is made, and then filename1 is scheduled to be deleted on the next commit. Note that svn mo ve does not create intermediate directories unless the --parents option is passed. svn mkd i r directory This command both creates the specified directory and then schedules it to be added to the repository on the next commit. Sometimes it is impractical to check out an entire working copy in order to do some simple changes. In these circumstances it is possible to perform svn mkd i r, svn co py, svn mo ve, and svn d el ete directly on the repository URL. Important Be careful when using these commands as there is no way to check the results with a working copy first. 2.2.5. Commit t ing Changes Once the edits are complete and have been verified to work correctly, it is time to publish them so others can view the changes. For each file in the working copy, SVN records two pieces of information: The file's working revision that the current working file is based on. A timestamp recording when the local copy was last updated by the repository. Using this information, SVN sorts the working copy on the local system into four categories: U n ch an g ed ; cu rren t The file in the working directory is unchanged and matches the copy in the repository, meaning no changes have been committed since the initial check out. Both svn co mmi t and svn upd ate will do nothing. Lo cally ch an g ed ; cu rren t The file in the working directory has been edited but has not yet been committed to the repository, and the repository version has not been changed since the initial checkout. Running svn co mmi t will update the repository with the changes in the working directory; running svn upd ate will do nothing. U n ch an g ed ; o u t o f d at e The file in the working directory has not been edited, but the version in the repository has, meaning that the working copy is now out of date. Running svn co mmi t will do nothing; running svn upd ate will merge the changes in the repository with the local working copy. Lo cally ch an g ed ; o u t o f d at e The file in both the working directory and the repository has been changed. If svn co mmi t is run first, an 'out-of-date' error will occur. Update the file first. Running svn upd ate will attempt to merge the changes in the repository with those on the working copy. If there are conflicts SVN will provide options for the user to decide on the best course of action to 32 Chapt er 2 . Collaborat ing resolve them. Running svn status will display all of the files in the working tree that do not match the current version in the repository, coded by a letter. ? it em The file is not recognized by SVN; that is it is in the working copy, but has not yet been added to the repository, or been scheduled for any action. A it em The file is scheduled for addition to the repository and will be added on the next commit. C it em The file is in conflict with a change made on the repository. This means that someone has edited and committed a change to the same section of the file currently changed in the working copy, and SVN does not know which is 'correct'. This conflict must be resolved before the changes are committed. D it em The file is scheduled for deletion on the next commit. M it em The file has been modified and the changes will be updated on the next commit. If the --verbo se (-v) is passed with svn status, the status of every item in the working copy will be displayed, even those that have not been changed. For example: $ svn status -v M 44 23 sally README 44 30 sally INSTALL M 44 20 harry bar.c 44 18 ira stuff 44 35 harry stuff/trout.c D 44 19 ira stuff/fish.c 44 21 sally stuff/things A 0 ? ? stuff/things/bloo.h 44 36 harry stuff/things/gloo.c Along with the letter codes, this shows the working revision, the revision in which the item was last changed, who changed it, and the item changed respectively. It can also be useful to see which items have been modified in the repository since the last time a checkout was performed. This is done by passing the --sho w-upd ates (-u) with svn status. An asterisk (*) will be displayed between the letter status and the working revision number on any files that will be updated when performing an svn co mmi t. Another way to view changes made is with the svn d i ff command. This displays changes in a unified diff format, describing changes as 'snippets' of a file's content where each line is prefixed with a character: a space for no change, a minus sign (-) for a line removed, and a plus sign (+) for an added line. Occasionally a conflict will occur. SVN provides the three most common responses (postpone, difffull, and edit) and a fourth option to list all the options and what they each do. The options available are: 33 Red Hat Ent erprise Linux 6 Developer G uide ( p ) p o st p o n e Mark the conflict to be resolved later. ( d f ) d if f - f u ll D isplay the differences between the base revision and the conflicted file in unified diff format. ( e) ed it Change merged file in an editor. ( r) reso lved Accept the merged version of the file. ( mf ) min e- f u ll Accept my version of the entire file, ignoring the most recent changes in the repository. ( t f ) t h eirs- f u ll Accept their version of the entire file, ignoring the most recent changes in the local working copy. ( l) lau n ch Launch an external tool to resolve conflict (this requires set up of the chosen external tool beforehand). ( h ) h elp D isplays the list of options as detailed here. Finally, provided the project has been changed locally and any conflicts have been resolved, the changes can be successfully committed with the svn co mmi t command, appending the option -m: $ svn commit filename -m"Fixed a typo in filename" Sending filename Transmitting file data . Committed revision 57. $ As can be seen above, the -m option allows a commit message to be recorded. This is most useful when the message is meaninful, which in turn makes referring back over commits straightforward. The most updated version is now available for anyone with access to the repository to update their versions to the newest copy. 2.2.6. SVN Document at ion The command svn --hel p provides information on the available commands to be used in conjunction with SVN and svn subcommand --hel p provides more detailed information on the specified subcommand. The official SVN book is available online at http://svnbook.red-bean.com/ The official SVN website is located at http://subversion.apache.org/ 34 Chapt er 2 . Collaborat ing 2.3. Git G it is a distributed revision control system with a peer-to-peer architecture. As opposed to centralized version control systems with a client-server model, G it ensures that each working copy of a G it repository is its exact copy with complete revision history. This not only allows you to work on and contribute to projects without the need to have permission to push your changes to their official repositories, but also makes it possible for you to work with no network connection. 2.3.1. Inst alling and Configuring Git 2 .3.1 .1 . Inst alling Git To install the G it revision control system, type the following at a shell prompt as ro o t: ~]# yum i nstal l g i t 2 .3.1 .2 . Co nfiguring t he De fault T e xt Edit o r Certain G it commands, such as g i t co mmi t, require the user to write a short message or make some changes in an external text editor. To determine which text editor to start, G it attempts to read the value of the G IT _ED IT O R environment variable, the co re. ed i to r configuration option, the VISUAL environment variable, and finally the ED IT O R environment variable in this particular order. If none of these options and variables are specified, the g i t command starts vi as a reasonable default option. To change the value of the co re. ed i to r configuration option in order to specify a different text editor, type the following at a shell prompt: g i t co nfi g --g l o bal co re. ed i to r command Replace command with the command to be used to start the selected text editor. Examp le 2.1. C o n f ig u rin g t h e D ef au lt T ext Ed it o r To configure G it to use vi m as the default text editor, type the following at a shell prompt: ~]$ g i t co nfi g --g l o bal co re. ed i to r vi m 2 .3.1 .3. Se t t ing Up Use r Info rm at io n In G it , each commit (or revision) is associated with the full name and email of the person responsible for it. By default, G it uses an identity based on the user name and the host name. To change the full name associated with your G it commits, type the following at a shell prompt: g i t co nfi g --g l o bal user. name "full name" To change the email address associated with your G it commits, type: g i t co nfi g --g l o bal user. emai l "email_address" 35 Red Hat Ent erprise Linux 6 Developer G uide Examp le 2.2. Set t in g U p U ser In f o rmat io n To configure G it to use Jo hn D o e as your full name and jo hn@ exampl e. co m as your email address, type the following at a shell prompt: ~]$ g i t co nfi g --g l o bal user. name "Jo hn D o e" ~]$ g i t co nfi g --g l o bal user. emai l "jo hn@ exampl e. co m" 2.3.2. Using Git 2 .3.2 .1 . Cre at ing a Ne w Re po sit o ry A repository is a place where G it stores all files that are under revision control, as well as additional data related to these files, such as the complete history of changes or information about who made those changes and when. Unlike in centralized revision control systems like Subversion or CVS, a G it repository and a working directory are usually the same. A typical G it repository also only stores a single project and when publicly accessible, it allows anyone to create its clone with a complete revision history. Init ializing an Em pt y Re po sit o ry To create a new, empty G it repository, change to the directory in which you want to keep the repository and type the following at a shell prompt: g i t i ni t This creates a hidden directory named . g i t in which all repository information is stored. Im po rt ing Dat a t o a Re po sit o ry To put an existing project under revision control, create a G it repository in the directory with the project and run the following command: g i t ad d . This marks all files and directories in the current working directory as ready to be added to the G it repository. To proceed and actually add this content to the repository, commit the changes by typing the following at a shell prompt: g i t co mmi t [-m "commit message"] Replace commit message with a short description of your revision. If you omit the -m option, this command allows you to write the commit message in an external text editor. For information on how to configure the default text editor, see Section 2.3.1.2, “ Configuring the D efault Text Editor” . 2 .3.2 .2 . Clo ning an Exist ing Re po sit o ry To clone an existing G it repository, type the following at a shell prompt: g i t cl o ne git_repository [directory] 36 Chapt er 2 . Collaborat ing Replace git_repository with a URL or a path to the G it repository you want to clone, and directory with a path to the directory in which you want to store the clone. 2 .3.2 .3. Adding, Re nam ing, and De le t ing File s Adding File s and Dire ct o rie s To add an existing file to a G it repository and put it under revision control, change to the directory with your local G it repository and type the following at a shell prompt: g i t ad d file. . . Replace file with the file or files you want to add. This command marks the selected file or files as ready to be added to the G it repository. Similarly, to add all files that are stored in a certain directory to a G it repository, type: g i t ad d directory. . . Replace directory with the directory or directories you want to add. This command marks all files in the selected directory or directories as ready to be added to the G it repository. To proceed and actually add this content to the repository, commit the changes as described in Section 2.3.2.5, “ Committing Changes” . Re nam ing File s and Dire ct o rie s To rename an existing file or directory in a G it repository, change to the directory with your local G it repository and type the following at a shell prompt: g i t mv old_name new_name Replace old_name with the current name of the file or directory and new_name with the new name. This command renames the selected file or directory and marks it as ready to be renamed in the G it repository. To proceed and actually rename the content in the repository, commit the changes as described in Section 2.3.2.5, “ Committing Changes” . De le t ing File s and Dire ct o rie s To delete an existing file from a G it repository, change to the directory with your local G it repository and type the following at a shell prompt: g i t rm file. . . Replace file with the file or files you want to delete. This command deletes all selected files and marks them as ready to be deleted form the G it repository. Similarly, to delete all files that are stored in a certain directory from a G it repository, type: g i t rm -r directory. . . Replace directory with the directory or directories you want to delete. This command deletes all selected directories and marks them as ready to be deleted from the G it repository. 37 Red Hat Ent erprise Linux 6 Developer G uide To proceed and actually delete this content from the repository, commit the changes as described in Section 2.3.2.5, “ Committing Changes” . 2 .3.2 .4 . Vie wing Change s Vie wing t he Curre nt St at us To determine the current status of your local G it repository, change to the directory with the repository and type the following command at a shell prompt: g i t status This command displays information about all uncommitted changes in the repository (new fi l e, renamed , d el eted , or mo d i fi ed ) and tells you which changes will be applied the next time you commit them. For information on how to commit your changes, see Section 2.3.2.5, “ Committing Changes” . Vie wing Diffe re nce s To view all changes in a G it repository, change to the directory with the repository and type the following at a shell prompt: g i t d i ff This command displays changes between the files in the repository and their latest revision. If you are only interested in changes in a particular file, supply its name on the command line as follows: g i t d i ff file. . . Replace file with the file or files you want to view. 2 .3.2 .5 . Co m m it t ing Change s To apply your changes to a G it repository and create a new revision, change to the directory with the repository and type the following command at a shell prompt: g i t co mmi t [-m "commit message"] Replace commit message with a short description of your revision. This command commits all changes in files that are explicitly marked as ready to be committed. To commit changes in all files that are under revision control, add the -a command line option as follows: g i t co mmi t -a [-m "commit message"] Note that if you omit the -m option, the command allows you to write the commit message in an external text editor. For information on how to configure the default text editor, see Section 2.3.1.2, “ Configuring the D efault Text Editor” . 2 .3.2 .6 . Sharing Change s 38 Chapt er 2 . Collaborat ing Unlike in centralized version control systems such as CVS or Subversion, when working with G it , project contributors usually do not make their changes in a single, central repository. Instead, they either create a publicly accessible clone of their local repository, or submit their changes to others over email as patches. Pushing Change s t o a Public Re po sit o ry To push your changes to a publicly accessible G it repository, change to the directory with your local repository and type the following at a shell prompt: g i t push remote_repository Replace remote_repository with the name of the remote repository you want to push your changes to. Note that the repository from which you originally cloned your local copy is automatically named o ri g i n. Cre at ing Pat che s fro m Individual Co m m it s To create patches from your commits, change to the directory with your local G it repository and type the following at a shell prompt: g i t fo rmat-patch remote_repository Replace remote_repository with the name of the remote repository from which you made your local copy. This creates a patch for each commit that is not present in this remote repository. 2 .3.2 .7 . Updat ing a Re po sit o ry To update your local copy of a G it repository and get the latest changes from a remote repository, change to the directory with your local G it repository and type the following at a shell prompt: g i t fetch remote_repository Replace remote_repository with the name of the remote repository. This command fetches information about the current status of the remote repository, allowing you to review these changes before applying them to your local copy. To proceed and merge these changes with what you have in your local G it repository, type: g i t merg e remote_repository Alternatively, you can perform both these steps at the same time by using the following command instead: g i t pul l remote_repository 2.3.3. Addit ional Resources A detailed description of G it and its features is beyond the scope of this book. For more information about this revision control system, see the resources listed below. Inst alle d Do cum e nt at io n 39 Red Hat Ent erprise Linux 6 Developer G uide g it t u t o rial(7) — The manual page named g it t u t o rial provides a brief introduction to G it and its usage. g it t u t o rial- 2(7) — The manual page named g it t u t o rial- 2 provides the second part of a brief introduction to G it and its usage. Git User's Manual — HTML documentation for G it is located at /user/share/d o c/g i t1. 7. 1/user-manual . html . Online Do cum e nt at io n Pro Git — The online version of the Pro Git book provides a detailed description of G it , its concepts and its usage. 40 Chapt er 3. Libraries and Runt ime Support Chapter 3. Libraries and Runtime Support Red Hat Enterprise Linux 6 supports the development of custom applications in a wide variety of programming languages using proven, industrial-strength tools. This chapter describes the runtime support libraries provided in Red Hat Enterprise Linux 6. 3.1. Version Informat ion The following table compares the version information for runtime support packages in supported programming languages between Red Hat Enterprise Linux 6, Red Hat Enterprise Linux 5, and Red Hat Enterprise Linux 4. This is not an exhaustive list. Instead, this is a survey of standard language runtimes, and key dependencies for software developed on Red Hat Enterprise Linux 6. T ab le 3.1. Lan g u ag e an d R u n t ime Lib rary Versio n s Packag e N ame R ed H at En t erp rise 6 R ed H at En t erp rise 5 R ed H at En t erp rise 4 glibc libstdc++ boost java 2.12 4.4 1.41 1.5 (IBM), 1.6 (IBM, OpenJD K, Oracle Java) 2.6 5.3 1.8 2.2 8.4 5.1 3.12 1.0.0 1.3 3.6 4.3 2.18 2.5 4.1 1.33 1.4, 1.5, and 1.6 2.3 3.4 1.32 1.4 2.4 5.1 1.8 2.2 8.1 5.0 3.12 0.9.8e 1.0 3.6 3.5 2.10 2.3 4.3 1.8 2.0 7.4 4.1 3.12 0.9.7a python php ruby httpd postgresql mysql nss openssl libX11 firefox kdebase gtk2 3.6 3.3 2.04 Note The co mpat-g l i bc RPM is included with Red Hat Enterprise Linux 6, but it is not a runtime package and therefore not required for running anything. It is solely a development package, containing header files and dummy libraries for linking. This allows compiling and linking packages to run in older Red Hat Enterprise Linux versions (using co mpat-g cc-* against those headers and libraries). Running rpm -q pi co mpat-g l i bc-* will provide some information on how to use this package. For more information on co mpat-g l i b, see Section 3.3.1, “ co mpat-g l i bc” 41 Red Hat Ent erprise Linux 6 Developer G uide 3.2. Compat ibilit y Compatibility specifies the portability of binary objects and source code across different instances of a computer operating environment. Officially, Red Hat supports current release and two consecutive prior versions. This means that applications built on Red Hat Enterprise Linux 4 and Red Hat Enterprise Linux 5 will continue to run on Red Hat Enterprise Linux 6 as long as they comply with Red Hat guidelines (using the symbols that have been white-listed, for example). Red Hat understands that as an enterprise platform, customers rely on long-term deployment of their applications. For this reason, applications built against C/C++ libraries with the help of compatibility libraries continue to be supported for ten years. There are two types of compatibility: So u rce C o mp at ib ilit y Source compatibility specifies that code will compile and execute in a consistent and predictable way across different instances of the operating environment. This type of compatibility is defined by conformance with specified Application Programming Interfaces (APIs). B in ary C o mp at ib ilit y Binary Compatibility specifies that compiled binaries in the form of executables and Dynamic Shared Objects (D SOs) will run correctly across different instances of the operating environment. This type of compatibility is defined by conformance with specified Application Binary Interfaces (ABIs). For further information regarding this and all levels of compatibility between core and non-core libraries, see Red Hat Enterprise Linux supported releases accessed at https://access.redhat.com/support/policy/updates/errata/ and the general Red Hat Enterprise Linux compatibility policy, accessed at https://access.redhat.com/site/articles/119073. 3.2.1. St at ic Linking Static linking is emphatically discouraged for all Red Hat Enterprise Linux releases. Static linking causes far more problems than it solves, and should be avoided at all costs. The main drawback of static linking is that it is only guaranteed to work on the system on which it was built, and even then only until the next release of glibc or libstdc++ (in the case of C++). There is no forward or backward compatibility with a static build. Furthermore, any security fixes (or generalpurpose fixes) in subsequent updates to the libraries will not be available unless the affected statically linked executables are re-linked. A few more reasons why static linking should be avoided are: Larger memory footprint. Slower application startup time. Reduced glibc features with static linking. Security measures like load address randomization cannot be used. D ynamic loading of shared objects outside of glibc is not supported. For additional reasons to avoid static linking, see: Static Linking Considered Harmful. 42 Chapt er 3. Libraries and Runt ime Support 3.3. Library and Runt ime Det ails 3.3.1. co mpat-g l i bc co mpat-g l i bc provides a subset of the shared static libraries from previous versions of Red Hat Enterprise Linux. For Red Hat Enterprise Linux 6, the following libraries are provided: l i banl l i bci d n l i bcrypt l i bc l i bd l l i bm l i bnsl l i bpthread l i breso l v l i brt l i bthread _d b l i buti l This set of libraries allows developers to create a Red Hat Enterprise Linux 5 application with Red Hat Enterprise Linux 6, provided the application uses only the above libraries. Use the following command to do so: # g cc -fg nu89 -i nl i ne -I /usr/l i b/x86 _6 4 -red hat-l i nux5E/i ncl ud e -B /usr/l i b/x86 _6 4 -red hat-l i nux5E/l i b6 4 / -l c_no nshared 3.3.2. T he GNU C+ + St andard Library The l i bstd c+ + package contains the GNU C++ Standard Library, which is an ongoing project to implement the ISO 14882 Standard C++ library. Installing the l i bstd c+ + package will provide just enough to satisfy link dependencies (that is, only shared library files). To make full use of all available libraries and header files for C++ development, you must install l i bstd c+ + -d evel as well. The l i bstd c+ + -d evel package also contains a GNU-specific implementation of the Standard Template Library (STL). For Red Hat Enterprise Linux 4, 5, and 6, the C++ language and runtime implementation has remained stable and as such no compatibility libraries are required for l i bstd c+ + . However, this is not the case for Red Hat Enterprise Linux 2 and 3. For Red Hat Enterprise Linux 2 co mpatl i bstd c+ + -29 6 is required to be installed. For Red Hat Enterprise Linux 3 co mpat-l i bstd c+ + 33 is required to be installed. Neither of these are installed by default so have to be added separately. 3.3.2 .1 . GNU C++ St andard Library Updat e s 43 Red Hat Ent erprise Linux 6 Developer G uide The Red Hat Enterprise Linux 6 version of the GNU C++ Standard Library features the following improvements over its Red Hat Enterprise Linux 5 version: Added support for elements of ISO C++ TR1, namely: <tr1/array> <tr1/co mpl ex> <tr1/memo ry> <tr1/functi o nal > <tr1/rand o m> <tr1/reg ex> <tr1/tupl e> <tr1/type_trai ts> <tr1/uno rd ered _map> <tr1/uno rd ered _set> <tr1/uti l i ty> <tr1/cmath> Added support for elements of the upcoming ISO C++ standard, C++0x. These elements include: <array> <chro no > <co nd i ti o n_vari abl e> <fo rward _l i st> <functi o nal > <i ni tal i zer_l i st> <mutex> <rand o m> <rati o > <reg ex> <system_erro r> <thread > <tupl e> <type_trai ts> <uno rd ered _map> <uno rd ered _set> 44 Chapt er 3. Libraries and Runt ime Support Added support for the -fvi si bi l i ty command. Added the following extensions: __g nu_cxx: : typel i st __g nu_cxx: : thro w_al l o cato r For more information about updates to l i bstd c+ + in Red Hat Enterprise Linux 6, see the C++ Runtime Library section of the following documents: GCC 4.2 Release Series Changes, New Features, and Fixes: http://gcc.gnu.org/gcc-4.2/changes.html GCC 4.3 Release Series Changes, New Features, and Fixes: http://gcc.gnu.org/gcc-4.3/changes.html GCC 4.4 Release Series Changes, New Features, and Fixes: http://gcc.gnu.org/gcc-4.4/changes.html 3.3.2 .2 . GNU C++ St andard Library Do cum e nt at io n To use the man pages for library components, install the l i bstd c+ + -d o cs package. This will provide man page information for nearly all resources provided by the library; for example, to view information about the vecto r container, use its fully-qualified component name: man std : : vecto r This will display the following information (abbreviated): std::vector(3) std::vector(3) NAME std::vector A standard container which offers fixed time access to individual elements in any order. SYNOPSIS Inherits std::_Vector_base< _Tp, _Alloc >. Public Types typedef _Alloc allocator_type typedef __gnu_cxx::__normal_iterator< const_pointer, vector > const_iterator typedef _Tp_alloc_type::const_pointer const_pointer typedef _Tp_alloc_type::const_reference const_reference typedef std::reverse_iterator< const_iterator > The l i bstd c+ + -d o cs package also provides manuals and reference information in HTML form at the following directory: fi l e: ///usr/share/d o c/l i bstd c+ + -d o cs-version/html /spi ne. html The main site for the development of libstdc++ is hosted on gcc.gnu.org. 3.3.3. Boost The bo o st package contains a large number of free peer-reviewed portable C++ source libraries. These libraries are suitable for tasks such as portable file-systems and time/date abstraction, 45 Red Hat Ent erprise Linux 6 Developer G uide serialization, unit testing, thread creation and multi-process synchronization, parsing, graphing, regular expression manipulation, and many others. Installing the bo o st package will provide just enough libraries to satisfy link dependencies (that is, only shared library files). To make full use of all available libraries and header files for C++ development, you must install bo o st-d evel as well. The bo o st package is actually a meta-package, containing many library sub-packages. These subpackages can also be installed individually to provide finer inter-package dependency tracking. The meta-package includes all of the following sub-packages: bo o st-d ate-ti me bo o st-fi l esystem bo o st-g raph bo o st-i o streams bo o st-math bo o st-pro g ram-o pti o ns bo o st-pytho n bo o st-reg ex bo o st-seri al i zati o n bo o st-si g nal s bo o st-system bo o st-test bo o st-thread bo o st-wave Not included in the meta-package are packages for static linking or packages that depend on the underlying Message Passing Interface (MPI) support. MPI support is provided in two forms: one for the default Open MPI implementation [1] , and another for the alternate MPICH2 implementation. The selection of the underlying MPI library in use is up to the user and depends on specific hardware details and user preferences. Please note that these packages can be installed in parallel, as installed files have unique directory locations. For Open MPI: bo o st-o penmpi bo o st-o penmpi -d evel bo o st-g raph-o penmpi bo o st-o penmpi -pytho n For MPICH2: bo o st-mpi ch2 bo o st-mpi ch2-d evel 46 Chapt er 3. Libraries and Runt ime Support bo o st-g raph-mpi ch2 bo o st-mpi ch2-pytho n If static linkage cannot be avoided, the bo o st-stati c package will install the necessary static libraries. Both thread-enabled and single-threaded libraries are provided. 3.3.3.1 . Bo o st Updat e s The Red Hat Enterprise Linux 6 version of Boost features many packaging improvements and new features. Several aspects of the bo o st package have changed. As noted above, the monolithic bo o st package has been augmented by smaller, more discrete sub-packages. This allows for more control of dependencies by users, and for smaller binary packages when packaging a custom application that uses Boost. In addition, both single-threaded and multi-threaded versions of all libraries are packaged. The multi-threaded versions include the mt suffix, as per the usual Boost convention. Boost also features the following new libraries: Foreach Statechart TR1 Typeof Xpressive Asio Bitmap Circular Buffer Function Types Fusion GIL Interprocess Intrusive Math/Special Functions Math/Statistical D istributions MPI System Accumulators Exception Units 47 Red Hat Ent erprise Linux 6 Developer G uide Unordered Proto Flyweight Scope Exit Swap Signals2 Property Tree Many of the existing libraries have been improved, bug-fixed, and otherwise enhanced. 3.3.3.2 . Bo o st Do cum e nt at io n The bo o st-d o c package provides manuals and reference information in HTML form located in the following directory: fi l e: ///usr/share/d o c/bo o st-d o c-version/i nd ex. html The main site for the development of Boost is hosted on boost.org. 3.3.4 . Qt The q t package provides the Qt (pronounced " cute" ) cross-platform application development framework used in the development of GUI programs. Aside from being a popular " widget toolkit" , Qt is also used for developing non-GUI programs such as console tools and servers. Qt was used in the development of notable projects such as Google Earth, KD E, Opera, OPIE, VoxOx, Skype, VLC media player and VirtualBox. It is produced by Nokia's Qt D evelopment Frameworks division, which came into being after Nokia's acquisition of the Norwegian company Trolltech, the original producer of Qt, on June 17, 2008. Qt uses standard C++ but makes extensive use of a special pre-processor called the Meta Object Compiler (MOC) to enrich the language. Qt can also be used in other programming languages via language bindings. It runs on all major platforms and has extensive internationalization support. Non-GUI Qt features include SQL database access, XML parsing, thread management, network support, and a unified cross-platform API for file handling. D istributed under the terms of the GNU Lesser General Public License (among others), Qt is free and open source software. The Red Hat Enterprise Linux 6 version of Qt supports a wide range of compilers, including the GCC C++ compiler and the Visual Studio suite. 3.3.4 .1 . Qt Updat e s Some of the improvements the Red Hat Enterprise Linux 6 version of Qt include: Advanced user experience Ad van ced G rap h ics Ef f ect s: options for opacity, drop-shadows, blur, colorization, and other similar effects An imat io n an d St at e Mach in e: create simple or complex animations without the hassle of managing complex code Gesture and multi-touch support 48 Chapt er 3. Libraries and Runt ime Support Support for new platforms Windows 7, Mac OSX 10.6, and other desktop platforms are now supported Added support for mobile development; Qt is optimized for the upcoming Maemo 6 platform, and will soon be ported to Maemo 5. In addition, Qt now supports the Symbian platform, with integration for the S60 framework. Added support for Real-Time Operating Systems such as QNX and VxWorks Improved performance, featuring added support for hardware-accelerated rendering (along with other rendering updates) Updated cross-platform ID E For more details on updates to Qt included in Red Hat Enterprise Linux 6, see the following links: http://doc.qt.nokia.com/4.6/qt4-6-intro.html http://doc.qt.nokia.com/4.6/qt4-intro.html 3.3.4 .2 . Qt Cre at o r Q t C reat o r is a cross-platform ID E tailored to the requirements of Qt developers. It includes the following graphical tools: An advanced C++ code editor Integrated GUI layout and forms designer Project and build management tools Integrated, context-sensitive help system Visual debugger Rapid code navigation tools 3.3.4 .3. Qt Library Do cum e nt at io n The q t-d o c package provides HTML manuals and references located in /usr/share/d o c/q t4 /html /. This package also provides the Qt Reference Documentation, which is an excellent starting point for development within the Qt framework. You can also install further demos and examples from q t-d emo s and q t-exampl es. To get an overview of the capabilities of the Qt framework, see /usr/bi n/q td emo -q t4 (provided by q td emo s). 3.3.5. KDE Development Framework The kd el i bs-d evel package provides the KD E libraries, which build on Qt to provide a framework for making application development easier. The KD E development framework also helps provide consistency across the KD E desktop environment. 3.3.5 .1 . KDE4 Archit e ct ure The KD E development framework's architecture in Red Hat Enterprise Linux 6 uses KD E4, which is built on the following technologies: 49 Red Hat Ent erprise Linux 6 Developer G uide Plasma Plasma replaces KD esktop in KD E4. Its implementation is based on the Q t G rap h ics View Framewo rk, which was introduced in Qt 4.2. For more information about Plasma, see http://techbase.kde.org/D evelopment/Architecture/KD E4/Plasma. So n n et So n n et is a multilingual spell-checking application that supports automatic language detection, primary/backup dictionaries, and other useful features. It replaces kspel l 2 in KD E4. K IO The KIO library provides a framework for network-transparent file handling, allowing users to easily access files through network-transparent protocols. It also helps provides standard file dialogs. K JS/K H T ML KJS and KHTML are fully-fledged JavaScript and HTML engines used by different applications native to KD E4 (such as ko n q u ero r). So lid So lid is a hardware and network awareness framework that allows you to develop applications with hardware interaction features. Its comprehensive API provides the necessary abstraction to support cross-platform application development. For more information, see http://techbase.kde.org/D evelopment/Architecture/KD E4/Solid. Ph o n o n Ph o n o n is a multimedia framework that helps you develop applications with multimedia functionalities. It facilitates the usage of media capabilities within KD E. For more information, see http://techbase.kde.org/D evelopment/Architecture/KD E4/Phonon. T elep at h y T elep at h y provides a real-time communication and collaboration framework within KD E4. Its primary function is to tighten integration between different components within KD E. For a brief overview on the project, see http://community.kde.org/RealTime_Communication_and_Collaboration. Ako n ad i Ako n ad i provides a framework for centralizing storage of Parallel Infrastructure Management (PIM) components. For more information, see http://techbase.kde.org/D evelopment/Architecture/KD E4/Akonadi. O n lin e H elp wit h in K D E4 KD E4 also features an easy-to-use Qt-based framework for adding online help capabilities to applications. Such capabilities include tooltips, hover-help information, and kh elp cen t er manuals. For a brief overview on online help within KD E4, see http://techbase.kde.org/D evelopment/Architecture/KD E4/Providing_Online_Help. K XMLG U I 50 Chapt er 3. Libraries and Runt ime Support K XMLG U I is a framework for designing user interfaces using XML. This framework allows you to design UI elements based on " actions" (defined by the developer) without having to revise source code. For more information, see https://techbase.kde.org/D evelopment/Architecture/KD E3/XMLGUI_Technology. St rig i St rig i is a desktop search daemon compatible with many desktop environments and operating systems. It uses its own jst ream system which allows for deep indexing of files. For more information on the development of St rig i, see http://www.vandenoever.info/software/strigi/. K N ewSt u f f 2 K N ewSt u f f 2 is a collaborative data sharing library used by many KD E4 applications. For more information, see http://techbase.kde.org/Projects/KNS2. 3.3.5 .2 . kde libs Do cum e nt at io n The kd el i bs-api d o cs package provides HTML documentation for the KD E development framework in /usr/share/d o c/HT ML/en/kd el i bs4 -api d o cs/. The following links also provide details on KD E-related programming tasks: http://techbase.kde.org/ http://techbase.kde.org/D evelopment/Tutorials http://techbase.kde.org/D evelopment/FAQs http://api.kde.org 3.3.6. GNOME Power Manager The backend program of the GNOME power management infrastructure is g no me-po wer-manag er. It was introduced in Red Hat Enterprise Linux 5 and provides a complete and integrated solution to power management under the GNOME desktop environment. In Red Hat Enterprise Linux 6, the storage-handling parts of hal was replaced by ud i sks, and the l i bg no mepri nt stack was replaced by print support in g tk2. 3.3.6 .1 . GNOME Po we r Manage m e nt Ve rsio n Guide This section will detail what versions of g no me-po wer-manag ement are shipped with the various Red Hat Enterprise Linux versions. In general, however, Red Hat Enterprise Linux 4 ships with GNOME 2.8, Red Hat Enterprise Linux 5 ships with GNOME 2.16, and Red Hat Enterprise Linux 6 ships with GNOME 2.28. T ab le 3.2. D eskt o p C o mp o n en t s C o mp ariso n R ed H at En t erp rise Lin u x Versio n G N O ME Po wer Man ag emen t D eskt o p C o mp o n en t s 4 5 6 hal udisks 0.4.2 N/A 0.5.8 N/A 0.5.14 1.0.1 51 Red Hat Ent erprise Linux 6 Developer G uide R ed H at En t erp rise Lin u x Versio n G N O ME Po wer Man ag emen t D eskt o p C o mp o n en t s 4 5 6 glib2 gtk2 gnome-vfs2 libglade2 libgnomecanvas gnome-desktop gnome-media gnome-python2 libgnome libgnomeui libgnomeprint22 libgnomeprintui22 gnome-session gnome-power-manager gnome-applets gnome-panel 2.4.7 2.4.13 2.8.2 2.4.0 2.8.0 2.8.0 2.8.0 2.6.0 2.8.0 2.8.0 2.8.0 2.8.0 2.8.0 N/A 2.8.0 2.8.1 2.12.3 2.10.4 2.16.2 2.6.0 2.14.0 2.16.0 2.16.1 2.16.0 2.16.0 2.16.0 2.12.1 2.12.1 2.16.0 2.16.0 2.16.0 2.16.1 2.22.5 2.18.9 2.24.2 2.6.4 2.26.0 2.28.2 2.29.91 2.28.0 2.28.0 2.24.1 N/A N/A 2.28.0 2.28.3 2.28.0 2.30.2 3.3.6 .2 . API Change s fo r glib There are a number of API changes for glib between versions. Versio n 2.4 t o Versio n 2.12 Some of the differences in glib between version 2.4 and 2.12 (or between Red Hat Enterprise Linux 4 and Red Hat Enterprise Linux 5) are: GOption (a command line option parser) GKeyFile (a key/ini file parser) GObject toggle references GMappedFile (a map wrapper) GSlice (a fast memory allocator) GBookmarkFile (a bookmark file parser) Base64 encoding support Native atomic ops on s390 Updated Unicode support to 5 Atomic reference counting for GObject Versio n 2.12 t o Versio n 2.22 Some of the differences in glib between version 2.12 and 2.22 (or between Red Hat Enterprise Linux 5 and Red Hat Enterprise Linux 6) are: 52 Chapt er 3. Libraries and Runt ime Support GSequence (a list data structure that is implemented as a balanced tree) GRegex (a PCRE regex wrapper) Support for monotonic clocks XD G user dirs support GIO (a VFS library to replace gnome-vfs) GChecksum (support for hash algorithms such as MD 5 and SHA-256) GTest (a test framework) Support for sockets and network IO in GIO GHashTable performance improvements GMarkup performance improvements D ocumentation for glib, including indexes of new and deprecated APIs, is shipped in the glib2-devel package. 3.3.6 .3. API Change s fo r GTK+ There are a number of API changes for GTK+ between versions. Versio n 2.4 t o Versio n 2.10 Some of the differences in GTK+ between version 2.4 and 2.10 (or between Red Hat Enterprise Linux 4 and Red Hat Enterprise Linux 5) are: GtkIconView GtkAboutD ialog GtkCellView GtkFileChooserButton GtkMenuToolButton GtkAssistant GtkLinkButton GtkRecentChooser GtkCellRendererCombo GtkCellRendererProgress GtkCellRendererAccel GtkCellRendererSpin GtkStatusIcon Printing Support Notebook tab D ND support 53 Red Hat Ent erprise Linux 6 Developer G uide Ellipsisation support in labels, progressbars and treeviews Support rotated text Improved themability Versio n 2.10 t o Versio n 2.18 Some of the differences in GTK+ between version 2.10 and 2.18 (or between Red Hat Enterprise Linux 4 and Red Hat Enterprise Linux 5) are: GtkScaleButton GtkVolumeButton GtkInfoBar GtkBuilder to replace libglade New tooltips API GtkMountOperation gtk_show_uri Scale marks Links in labels Support runtime font configuration changes Use GIO D ocumentation for GTK+, including indexes of new and deprecated APIs, is shipped in the gtk2-devel package. 3.3.7. NSS Shared Dat abases The NSS shared database format, introduced on NSS 3.12, is now available in Red Hat Enterprise 6. This encompasses a number of new features and components to improve access and usability. Included, is the NSS certificate and key database which are now sqlite-based and allow for concurrent access. The legacy key3. d b and cert8. d b are also replaced with new SQL databases called key4 . d b and cert9 . d b. These new databases will store PKCS #11 token objects, which are the same as what is currently stored in cert8. d b and key3. d b. Having support for shared databases enables a system-wide NSS database. It resides in /etc/pki /nssd b where globally trusted CA certificates become accessible to all applications. The command rv = NSS_Ini tR ead Wri te("sq l : /etc/pki /nssd b"); initializes NSS for applications. If the application is run with root privileges, then the system-wide database is available on a read and write basis. However, if it is run with normal user privileges it becomes read only. Additionally, a PEM PKCS #11 module for NSS allows applications to load into memory certificates and keys stored in PEM-formatted files (for example, those produced by openssl). 3.3.7 .1 . Backwards Co m pat ibilit y The binary compatibility guarantees made by NSS upstream are preserved in NSS for Red Hat Enterprise Linux 6. This guarantee states that the NSS 3.12 is backwards compatible with all older 54 Chapt er 3. Libraries and Runt ime Support NSS 3.x shared libraries. Therefore, a program linked with an older NSS 3.x shared library will work without recompiling or relinking, and any applications that restrict the use of NSS APIs to the NSS Public Functions remain compatible with future versions of the NSS shared libraries. Red Hat Enterprise Linux 5 and 4 run on the same version of NSS as Red Hat Enterprise Linux 6 so there are no ABI or API changes. However, there are still differences as NSS's internal cryptographic module in Red Hat Enterprise Linux 6 is the one from NSS 3.12, whereas Red Hat Enterprise Linux 5 and 4 still use the older one from NSS 3.15. This means that new functionality that had been introduced with NSS 3.12, such as the shared database, is now available with Red Hat Enterprise Linux 6's version of NSS. 3.3.7 .2 . NSS Share d Dat abase s Do cum e nt at io n Mozilla's wiki page explains the system-wide database rationale in great detail and can be accessed here. 3.3.8. Pyt hon The pytho n package adds support for the Python programming language. This package provides the object and cached bytecode files required to enable runtime support for basic Python programs. It also contains the pytho n interpreter and the pyd o c documentation tool. The pytho n-d evel package contains the libraries and header files required for developing Python extensions. Red Hat Enterprise Linux also ships with numerous pytho n-related packages. By convention, the names of these packages have a pytho n prefix or suffix. Such packages are either library extensions or python bindings to an existing library. For instance, d bus-pytho n is a Python language binding for D -Bus. Note that both cached bytecode (*. pyc/*. pyo files) and compiled extension modules (*. so files) are incompatible between Python 2.4 (used in Red Hat Enterprise Linux 5) and Python 2.6 (used in Red Hat Enterprise Linux 6). As such, you will be required to rebuild any extension modules you use that are not part of Red Hat Enterprise Linux. 3.3.8 .1 . Pyt ho n Updat e s The Red Hat Enterprise Linux 6 version of Python features various language changes. For information about these changes, see the following project resources: What's New in Python 2.5: http://docs.python.org/whatsnew/2.5.html What's New in Python 2.6: http://docs.python.org/whatsnew/2.6.html Both resources also contain advice on porting code developed using previous Python versions. 3.3.8 .2 . Pyt ho n Do cum e nt at io n For more information about Python, see man pytho n. You can also install pytho n-d o cs, which provides HTML manuals and references in the following location: fi l e: ///usr/share/d o c/pytho n-d o cs-version/html /i nd ex. html For details on library and language components, use pyd o c component_name. For example, pyd o c math will display the following information about the math Python module: Help on module math: NAME 55 Red Hat Ent erprise Linux 6 Developer G uide math FILE /usr/lib64/python2.6/lib-dynload/mathmodule.so DESCRIPTION This module is always available. It provides access to the mathematical functions defined by the C standard. FUNCTIONS acos[...] acos(x) Return the arc cosine (measured in radians) of x. acosh[...] acosh(x) Return the hyperbolic arc cosine (measured in radians) of x. asin(...) asin(x) Return the arc sine (measured in radians) of x. asinh[...] asinh(x) Return the hyperbolic arc sine (measured in radians) of x. The main site for the Python development project is hosted on python.org. 3.3.9. Java The java-1. 6 . 0 -o penjd k package adds support for the Java programming language. This package provides the java interpreter. The java-1. 6 . 0 -o penjd k-d evel package contains the javac compiler, as well as the libraries and header files required for developing Java extensions. Red Hat Enterprise Linux also ships with numerous java-related packages. By convention, the names of these packages have a java prefix or suffix. 3.3.9 .1 . Java Do cum e nt at io n For more information about Java, see man java. Some associated utilities also have their own respective man pages. You can also install other Java documentation packages for more details about specific Java utilities. By convention, such documentation packages have the javad o c suffix (for example, d busjava-javad o c). The main site for the development of Java is hosted on http://openjdk.java.net/. The main site for the library runtime of Java is hosted on http://icedtea.classpath.org. 3.3.10. Ruby 56 Chapt er 3. Libraries and Runt ime Support The ruby package provides the Ruby interpreter and adds support for the Ruby programming language. The ruby-d evel package contains the libraries and header files required for developing Ruby extensions. Red Hat Enterprise Linux also ships with numerous ruby-related packages. By convention, the names of these packages have a ruby or rubyg em prefix or suffix. Such packages are either library extensions or Ruby bindings to an existing library. Examples of ruby-related packages include: ruby-flexmock rubygem-flexmock rubygems ruby-irb ruby-libguestfs ruby-libs ruby-qpid ruby-rdoc ruby-ri ruby-saslwrapper ruby-static ruby-tcltk For information about updates to the Ruby language in Red Hat Enterprise Linux 6, see the following resources: fi l e: ///usr/share/d o c/ruby-version/NEWS fi l e: ///usr/share/d o c/ruby-version/NEWS-version 3.3.1 0 .1 . Ruby Do cum e nt at io n For more information about Ruby, see man ruby. You can also install ruby-d o cs, which provides HTML manuals and references in the following location: fi l e: ///usr/share/d o c/ruby-d o cs-version/ The main site for the development of Ruby is hosted on http://www.ruby-lang.org. The http://www.ruby-doc.org site also contains Ruby documentation. 3.3.11. Perl The perl package adds support for the Perl programming language. This package provides Perl core modules, the Perl Language Interpreter, and the PerlD oc tool. Red Hat also provides various perl modules in package form; these packages are named with the perl -* prefix. These modules provide stand-alone applications, language extensions, Perl libraries, and external library bindings. 57 Red Hat Ent erprise Linux 6 Developer G uide 3.3.1 1 .1 . Pe rl Updat e s For a full list of the differences between the Perl versions see the following documents: Perl 5.12 U p d at es Perl 5.12 has the following updates: Perl conforms closer to the Unicode standard. Experimental APIs allow Perl to be extended with " pluggable" keywords and syntax. Perl will be able to keep accurate time well past the " Y2038" barrier. Package version numbers can be directly specified in " package" statements. Perl warns the user about the use of depreciated features by default. The Perl 5.12 delta can be accessed at http://perldoc.perl.org/perl5120delta.html. Perl 5.14 U p d at es Perl 5.14 has the following updates: Unicode 6.0 support. Improved support for IPv6. Easier auto-configuration of the CPAN client. A new /r flag that makes s/// substitutions non-destructive. New regular expression flags to control whether matched strings should be treated as ASCII or Unicode. New packag e Foo { } syntax. Less memory and CPU usage than previous releases. A number of bug fixes. The Perl 5.14 delta can be accessed at http://perldoc.perl.org/perl5140delta.html. Perl 5.16 U p d at es Perl 5.14 has the following updates: Support for Unicode 6.1. $$ variable is writable. Improved debugger. Accessing Unicode database files directly is now depreciated; use Unicode::UCD instead. Version::Requirements is depreciated in favor of CPAN::Meta::Requirements. A number of perl4 libraries are removed: abbrev.pl assert.pl 58 Chapt er 3. Libraries and Runt ime Support bigfloat.pl bigint.pl bigrat.pl cacheout.pl complete.pl ctime.pl dotsh.pl exceptions.pl fastcwd.pl flush.pl getcwd.pl getopt.pl getopts.pl hostname.pl importenv.pl lib/find{,depth}.pl look.pl newgetopt.pl open2.pl open3.pl pwd.pl hellwords.pl stat.pl tainted.pl termcap.pl timelocal.pl The Perl 5.16 delta can be accessed at http://perldoc.perl.org/perl5160delta.html. 3.3.1 1 .2 . Inst allat io n Perl's capabilities can be extended by installing additional modules. These modules come in the following forms: O f f icial R ed H at R PM 59 Red Hat Ent erprise Linux 6 Developer G uide The official module packages can be installed with yum or rpm from the Red Hat Enterprise Linux repositories. They are installed to /usr/share/perl 5 and either /usr/l i b/perl 5 for 32bit architectures or /usr/l i b6 4 /perl 5 for 64bit architectures. Mo d u les f ro m C PAN Use the cpan tool provided by the perl-CPAN package to install modules directly from the CPAN website. They are installed to /usr/l o cal /share/perl 5 and either /usr/l o cal /l i b/perl 5 for 32bit architectures or /usr/l o cal /l i b6 4 /perl 5 for 64bit architectures. T h ird p art y mo d u le p ackag e Third party modules are installed to /usr/share/perl 5/vend o r_perl and either /usr/l i b/perl 5/vend o r_perl for 32bit architectures or /usr/l i b6 4 /perl 5/vend o r_perl for 64bit architectures. C u st o m mo d u le p ackag e / man u ally in st alled mo d u le These should be placed in the same directories as third-party modules. That is, /usr/share/perl 5/vend o r_perl and either /usr/l i b/perl 5/vend o r_perl for 32bit architectures or /usr/l i b6 4 /perl 5/vend o r_perl for 64bit architectures. Warning If an official version of a module is already installed, installing its non-official version can create conflicts in the /usr/share/man directory. 3.3.1 1 .3. Pe rl Do cum e nt at io n The perl d o c tool provides documentation on language and core modules. To learn more about a module, use perl d o c mo d ul e_name. For example, perl d o c C G I will display the following information about the CGI core module: NAME CGI - Handle Common Gateway Interface requests and responses SYNOPSIS use CGI; my $q = CGI->new; [...] DESCRIPTION CGI.pm is a stable, complete and mature solution for processing and preparing HTTP requests and responses. Major features including processing form submissions, file uploads, reading and writing cookies, query string generation and manipulation, and processing and preparing HTTP headers. Some HTML generation utilities are included as well. [...] PROGRAMMING STYLE There are two styles of programming with CGI.pm, an object-oriented 60 Chapt er 3. Libraries and Runt ime Support style and a function-oriented style. In the object-oriented style you create one or more CGI objects and then use object methods to create the various elements of the page. Each CGI object starts out with the list of named parameters that were passed to your CGI script by the server. [...] For details on Perl functions, use perl d o c -f function_name . For example, perldoc -f split wil display the following information about the split function: split /PATTERN/,EXPR,LIMIT split /PATTERN/,EXPR split /PATTERN/ split Splits the string EXPR into a list of strings and returns that list. By default, empty leading fields are preserved, and empty trailing ones are deleted. (If all fields are empty, they are considered to be trailing.) In scalar context, returns the number of fields found. In scalar and void context it splits into the @ _ array. Use of split in scalar and void context is deprecated, however, because it clobbers your subroutine arguments. If omitted, Anything fields. EXPR is omitted, splits the $_ string. If PATTERN is also splits on whitespace (after skipping any leading whitespace). matching PATTERN is taken to be a delimiter separating the (Note that the delimiter may be longer than one character.) [...] Current PerlD oc documentation can be found on perldoc.perl.org. Core and external modules are documented on the Comprehensive Perl Archive Network. [1] MPI s up p o rt is no t availab le o n IBM Sys tem Z mac hines (where O p en MPI is no t availab le). 61 Red Hat Ent erprise Linux 6 Developer G uide Chapter 4. Compiling and Building Red Hat Enterprise Linux 6 includes many packages used for software development, including tools for compiling and building source code. This chapter discusses several of these packages and tools used to compile source code. 4 .1. GNU Compiler Collect ion (GCC) The GNU Compiler Collection (GCC) is a set of tools for compiling a variety of programming languages (including C, C++, ObjectiveC, ObjectiveC++, Fortran, and Ada) into highly optimized machine code. These tools include various compilers (like g cc and g + + ), run-time libraries (like l i bg cc, l i bstd c+ + , l i bg fo rtran, and l i bg o mp), and miscellaneous other utilities. 4 .1.1. GCC St at us and Feat ures GCC for Red Hat Enterprise Linux 6 is based on the 4.4.x release series and includes several bug fixes, enhancements, and backports from upcoming releases (including the GCC 4.5). However, GCC 4.5 was not considered sufficiently mature for an enterprise distribution when Red Hat Enterprise Linux 6 features were frozen. This standardization means that as updates to the 4.4 series become available (4.4.1, 4.4.2, and so on), they will be incorporated into the compiler included with Red Hat Enterprise Linux 6 as updates. Red Hat may import additional backports and enhancements from upcoming releases outside the 4.4 series that will not break compatibility within the Enterprise Linux release. Occasionally, code that was not compliant to standards may fail to compile or its functionality may change in the process of fixing bugs or maintaining standards compliant behavior. Since the previous release of Red Hat Enterprise Linux, GCC has had three major releases: 4.2.x, 4.3.x, and 4.4.x. A selective summary of the expansive list of changes follows. The inliner, dead code elimination routines, compile time, and memory usage codes are now improved. This release also features a new register allocator, instruction scheduler, and software pipeliner. Version 3.0 of the OpenMP specification is now supported for the C, C++, and Fortran compilers. Experimental support for the upcoming ISO C++ standard (C++0x) is included. This has support for auto/inline namespaces, character types, and scoped enumerations. To enable this, use the compiler options -std = c+ + 0 x (which disables GNU extensions) or -std = g nu+ + 0 x. For a more detailed list of the status of C++0x improvements, see: http://gcc.gnu.org/gcc-4.4/cxx0x_status.html GCC now incorporates the Variable Tracking at Assignments (VTA) infrastructure. This allows GCC to better track variables during optimizations so that it can produce improved debugging information (that is, D WARF) for the GNU Project D ebugger, SystemTap, and other tools. For a brief overview of VTA, see Section 5.4, “ Variable Tracking at Assignments” . With VTA you can debug optimized code drastically better than with previous GCC releases, and you do not have to compile with -O0 to provide a better debugging experience. Fortran 2008 is now supported, while support for Fortran 2003 is extended. For a more detailed list of improvements in GCC, see: Updates in the 4.2 Series: http://gcc.gnu.org/gcc-4.2/changes.html 62 Chapt er 4 . Compiling and Building Updates in the 4.3 Series: http://gcc.gnu.org/gcc-4.3/changes.html Updates in the 4.4 Series: http://gcc.gnu.org/gcc-4.4/changes.html In addition to the changes introduced via the GCC 4.4 rebase, the Red Hat Enterprise Linux 6 version of GCC also features several fixes and enhancements backported from upstream sources (that is, version 4.5 and beyond). These improvements include the following (among others): Improved D WARF3 debugging for debugging optimized C++ code. Fortran optimization improvements. More accurate instruction length information for ix86, Intel 64 and AMD 64, and s390. Intel Atom support. POWER7 support. C++ raw string support, u/U/u8 string literal support. 4 .1.2. Language Compat ibilit y Application Binary Interfaces specified by the GNU C, C++, Fortran and Java Compiler include: Calling conventions. These specify how arguments are passed to functions and how results are returned from functions. Register usage conventions. These specify how processor registers are allocated and used. Object file formats. These specify the representation of binary object code. Size, layout, and alignment of data types. These specify how data is laid out in memory. Interfaces provided by the runtime environment. Where the documented semantics do not change from one version to another they must be kept available and use the same name at all times. The default system C compiler included with Red Hat Enterprise Linux 6 is largely compatible with the C99 ABI standard. D eviations from the C99 standard in GCC 4.4 are tracked online. In addition to the C ABI, the Application Binary Interface for the GNU C++ Compiler specifies the binary interfaces required to support the C++ language, such as: Name mangling and demangling Creation and propagation of exceptions Formatting of run-time type information Constructors and destructors Layout, alignment, and padding of classes and derived classes Virtual function implementation details, such as the layout and alignment of virtual tables The default system C++ compiler included with Red Hat Enterprise Linux 6 conforms to the C++ ABI defined by the Itanium C++ ABI (1.86). Although every effort has been made to keep each version of GCC compatible with previous releases, some incompatibilities do exist. AB I in co mp at ib ilit ies b et ween R ed H at En t erp rise Lin u x 6 an d R ed H at En t erp rise Lin u x 5 63 Red Hat Ent erprise Linux 6 Developer G uide En t erp rise Lin u x 5 The following is a list of known incompatibilities between the Red Hat Enterprise Linux 6 and 5 toolchains. Passing/returning structs with flexible array members by value changed in some cases on Intel 64 and AMD 64. Passing/returning of unions with long double members by value changed in some cases on Intel 64 and AMD 64. Passing/returning structs with complex float member by value changed in some cases on Intel 64 and AMD 64. Passing of 256-bit vectors on x86, Intel 64 and AMD 64 platforms changed when -mavx is used. There have been multiple changes in passing of _D ecimal{32,64,128} types and aggregates containing those by value on several targets. Packing of packed char bitfields changed in some cases. AB I in co mp at ib ilit ies b et ween R ed H at En t erp rise Lin u x 5 an d R ed H at En t erp rise Lin u x 4 The following is a list of known incompatibilities between the Red Hat Enterprise Linux 5 and 4 toolchains. There have been changes in the library interface specified by the C++ ABI for thread-safe initialization of function-scope static variables. On Intel 64 and AMD 64, the medium model for building applications where data segment exceeds 4GB, was redesigned to match the latest ABI draft at the time. The ABI change results in incompatibility among medium model objects. The compiler flag -Wabi can be used to get diagnostics indicating where these constructs appear in source code, though it will not catch every single case. This flag is especially useful for C++ code to warn whenever the compiler generates code that is known to be incompatible with the vendor-neutral C++ ABI. Excluding the incompatibilities listed above, the GCC C and C++ language ABIs are mostly ABI compatible. The vast majority of source code will not encounter any of the known issues, and can be considered compatible. Compatible ABIs allow the objects created by compiling source code to be portable to other systems. In particular, for Red Hat Enterprise Linux, this allows for upward compatibility. Upward compatibility is defined as the ability to link shared libraries and objects, created using a version of the compilers in a particular Red Hat Enterprise Linux release, with no problems. This includes new objects compiled on subsequent Red Hat Enterprise Linux releases. The C ABI is considered to be stable, and has been so since at least Red Hat Enterprise Linux 3 (again, barring any incompatibilities mentioned in the above lists). Libraries built on Red Hat Enterprise Linux 3 and later can be linked to objects created on a subsequent environment (Red Hat Enterprise Linux 4, Red Hat Enterprise Linux 5, and Red Hat Enterprise Linux 6). The C++ ABI is considered to be stable, but less stable than the C ABI, and only as of Red Hat Enterprise Linux 4 (corresponding to GCC version 3.4 and above.). As with C, this is only an upward compatibility. Libraries built on Red Hat Enterprise Linux 4 and above can be linked to objects created on a subsequent environment (Red Hat Enterprise Linux 5, and Red Hat Enterprise Linux 6). To force GCC to generate code compatible with the C++ ABI in Red Hat Enterprise Linux releases 64 Chapt er 4 . Compiling and Building prior to Red Hat Enterprise Linux 4, some developers have used the -fabi -versi o n= 1 option. This practice is not recommended. Objects created this way are indistinguishable from objects conforming to the current stable ABI, and can be linked (incorrectly) amongst the different ABIs, especially when using new compilers to generate code to be linked with old libraries that were built with tools prior to Red Hat Enterprise Linux 4. Warning The above incompatibilities make it incredibly difficult to maintain ABI shared library sanity between releases, especially when developing custom libraries with multiple dependencies outside of the core libraries. Therefore, if shared libraries are developed, it is highly recommend that a new version is built for each Red Hat Enterprise Linux release. 4 .1.3. Object Compat ibilit y and Int eroperabilit y Two items that are important are the changes and enhancements in the underlying tools used by the compiler, and the compatibility between the different versions of a language's compiler. Changes and new features in tools like l d (distributed as part of the bi nuti l s package) or in the dynamic loader (l d . so , distributed as part of the g l i bc package) can subtly change the object files that the compiler produces. These changes mean that object files moving to the current release of Red Hat Enterprise Linux from previous releases may lose functionality, behave differently at runtime, or otherwise interoperate in a diminished capacity. Known problem areas include: l d --bui l d -i d In Red Hat Enterprise Linux 6 this is passed to l d by default, whereas Red Hat Enterprise Linux 5 l d doesn't recognize it. as . cfi _secti o ns support In Red Hat Enterprise Linux 6 this directive allows . d ebug _frame, . eh_frame or both to be omitted from . cfi * directives. In Red Hat Enterprise Linux 5 only . eh_frame is omitted. as, l d , l d . so , and g d b ST B_G NU_UNIQ UE and %g nu_uni q ue_symbo l support In Red Hat Enterprise Linux 6 more debug information is generated and stored in object files. This information relies on new features detailed in the D WAR F standard, and also on new extensions not yet standardized. In Red Hat Enterprise Linux 5, tools like as, l d , g d b, o bjd ump, and read el f may not be prepared for this new information and may fail to interoperate with objects created with the newer tools. In addition, Red Hat Enterprise Linux 5 produced object files do not support these new features; these object files may be handled by Red Hat Enterprise Linux 6 tools in a sub-optimal manner. An outgrowth of this enhanced debug information is that the debuginfo packages that ship with system libraries allow you to do useful source level debugging into system libraries if they are installed. See Section 5.2, “ Installing D ebuginfo Packages” for more information on debuginfo packages. Object file changes, such as the ones listed above, may interfere with the portable use of prel i nk. 4 .1.4 . Backwards Compat ibilit y Packages Several packages are provided to serve as an aid for those moving source code or executables from older versions of Red Hat Enterprise Linux to the current release. These packages are intended to be 65 Red Hat Ent erprise Linux 6 Developer G uide used as a temporary aid in transitioning sources to newer compilers with changed behavior, or as a convenient way to otherwise isolate differences in the system environment from the compile environment. Note Please be advised that Red Hat may remove these packages in future Red Hat Enterprise Linux releases. The following packages provide compatibility tools for compiling Fortran or C++ source code on the current release of Red Hat Enterprise Linux 6 as if one was using the older compilers on Red Hat Enterprise Linux 4: co mpat-g cc-34 co mpat-g cc-34 -c+ + co mpat-g cc-34 -g 77 The following package provides a compatibility runtime library for Fortran executables compiled on Red Hat Enterprise Linux 5 to run without recompilation on the current release of Red Hat Enterprise Linux 6: co mpat-l i bg fo rtran-4 1 Please note that backwards compatibility library packages are not provided for all supported system libraries, just the system libraries pertaining to the compiler and the C/C++ standard libraries. For more information about backwards compatibility library packages, see the Application Compatibility section of the Red Hat Enterprise Linux 6 Migration Guide. 4 .1.5. Previewing Red Hat Ent erprise Linux 6 compiler feat ures on Red Hat Ent erprise Linux 5 On Red Hat Enterprise Linux 5, we have included the package g cc4 4 as an update. This is a backport of the Red Hat Enterprise Linux 6 compiler to allow users running Red Hat Enterprise Linux 5 to compile their code with the Red Hat Enterprise Linux 6 compiler and experiment with new features and optimizations before upgrading their systems to the next major release. The resulting binary will be forward compatible with Red Hat Enterprise Linux 6, so it can be compiled on Red Hat Enterprise Linux 5 with g cc4 4 and run on Red Hat Enterprise Linux 5, Red Hat Enterprise Linux 6, and above. The Red Hat Enterprise Linux 5 g cc4 4 compiler will be kept reasonably in step with the GCC 4.4.x that we ship with Red Hat Enterprise Linux 6 to ease transition. Though, to get the latest features, it is recommended Red Hat Enterprise Linux 6 is used for development. The g cc4 4 is only provided as an aid in the conversion process. 4 .1.6. Running GCC To compile using GCC tools, first install bi nuti l s and g cc; doing so will also install several dependencies. 66 Chapt er 4 . Compiling and Building In brief, the tools work via the g cc command. This is the main driver for the compiler. It can be used from the command line to pre-process or compile a source file, link object files and libraries, or perform a combination thereof. By default, g cc takes care of the details and links in the provided l i bg cc library. The compiler functions provided by GCC are also integrated into the Eclipse ID E as part of the C D T . This presents many advantages, particularly for developers who prefer a graphical interface and fully integrated environment. Conversely, using GCC tools from the command line interface consumes less system resources. This also allows finer-grained control over compilers; GCC's command line tools can even be used outside of the graphical mode (runlevel 5). 4 .1 .6 .1 . Sim ple C Usage Basic compilation of a C language program using GCC is easy. Start with the following simple program: h ello .c #include <stdio.h> int main () { printf ("Hello world!\n"); return 0; } The following procedure illustrates the compilation process for C in its most basic form. Pro ced u re 4 .1. C o mp ilin g a ' H ello Wo rld ' C Pro g ram 1. Compile hello.c into an executable with: g cc hel l o . c -o hel l o Ensure that the resulting binary hel l o is in the same directory as hel l o . c. 2. Run the hel l o binary, that is, hel l o . 4 .1 .6 .2 . Sim ple C++ Usage Basic compilation of a C++ language program using GCC is similar. Start with the following simple program: h ello .cc #include <iostream> using namespace std; int main(void) { cout << "Hello World!" << endl; return 0; } 67 Red Hat Ent erprise Linux 6 Developer G uide The following procedure illustrates the compilation process for C++ in its most basic form. Pro ced u re 4 .2. C o mp ilin g a ' H ello Wo rld ' C + + Pro g ram 1. Compile hello.cc into an executable with: g + + hel l o . cc -o hel l o Ensure that the resulting binary hel l o is in the same directory as hel l o . cc. 2. Run the hel l o binary, that is, hel l o . 4 .1 .6 .3. Sim ple Mult i-File Usage To use basic compilation involving multiple files or object files, start with the following two source files: o n e.c #include <stdio.h> void hello() { printf("Hello world!\n"); } t wo .c extern void hello(); int main() { hello(); return 0; } The following procedure illustrates a simple, multi-file compilation process in its most basic form. Pro ced u re 4 .3. C o mp ilin g a Pro g ram wit h Mu lt ip le So u rce Files 1. Compile one.c into an executable with: g cc -c o ne. c -o o ne. o Ensure that the resulting binary o ne. o is in the same directory as o ne. c. 2. Compile two.c into an executable with: g cc -c two . c -o two . o Ensure that the resulting binary two . o is in the same directory as two . c. 3. Compile the two object files o ne. o and two . o into a single executable with: g cc o ne. o two . o -o hel l o Ensure that the resulting binary hel l o is in the same directory as o ne. o and two . o . 68 Chapt er 4 . Compiling and Building 4. Run the hel l o binary, that is, hel l o . 4 .1 .6 .4 . Re co m m e nde d Opt im izat io n Opt io ns D ifferent projects require different optimization options. There is no one-size-fits-all approach when it comes to optimization, but here are a few guidelines to keep in mind. In st ru ct io n select io n an d t u n in g It is very important to choose the correct architecture for instruction scheduling. By default GCC produces code optimized for the most common processors, but if the CPU on which your code will run is known, the corresponding -mtune= option to optimize the instruction scheduling, and march= option to optimize the instruction selection should be used. The option -mtune= optimizes instruction scheduling to fit your architecture by tuning everything except the ABI and the available instruction set. This option will not choose particular instructions, but instead will tune your program in such a way that executing on a particular architecture will be optimized. For example, if an Intel Core2 CPU will predominantly be used, choose -mtune= co re2. If the wrong choice is made, the program will still run, but not optimally on the given architecture. The architecture on which the program will most likely run should always be chosen. The option -march= optimizes instruction selection. As such, it is important to choose correctly as choosing incorrectly will cause your program to fail. This option selects the instruction set used when generating code. For example, if the program will be run on an AMD K8 core based CPU, choose march= k8. Specifying the architecture with this option will imply -mtune= . The -mtune= and -march= commands should only be used for tuning and selecting instructions within a given architecture, not to generate code for a different architecture (also known as crosscompiling). For example, this is not to be used to generate PowerPC code from an Intel 64 and AMD 64 platform. For a complete list of the available options for both -march= and -mtune= , see the GCC documentation available here: GCC 4.4.4 Manual: Hardware Models and Configurations G en eral p u rp o se o p t imiz at io n f lag s The compiler flag -O 2 is a good middle of the road option to generate fast code. It produces the best optimized code when the resulting code size is not large. Use this when unsure what would best suit. When code size is not an issue, -O 3 is preferable. This option produces code that is slightly larger but runs faster because of a more frequent inline of functions. This is ideal for floating point intensive code. The other general purpose optimization flag is -O s. This flag also optimizes for size, and produces faster code in situations where a smaller footprint will increase code locality, thereby reducing cache misses. Use -freco rd -g cc-swi tches when compiling objects. This records the options used to build objects into objects themselves. After an object is built, it determines which set of options were used to build it. The set of options are then recorded in a section called . G C C . co mmand . l i ne within the object and can be examined with the following: $ gcc -frecord-gcc-switches -O3 -Wall hello.c -o hello $ readelf --string-dump=.GCC.command.line hello String dump of section '.GCC.command.line': [ 0] hello.c 69 Red Hat Ent erprise Linux 6 Developer G uide [ [ [ [ 8] 17] 1b] 21] -mtune=generic -O3 -Wall -frecord-gcc-switches It is very important to test and try different options with a representative data set. Often, different modules or objects can be compiled with different optimization flags in order to produce optimal results. See Section 4.1.6.5, “ Using Profile Feedback to Tune Optimization Heuristics” for additional optimization tuning. 4 .1 .6 .5 . Using Pro file Fe e dback t o T une Opt im izat io n He urist ics D uring the transformation of a typical set of source code into an executable, tens of hundreds of choices must be made about the importance of speed in one part of code over another, or code size as opposed to code speed. By default, these choices are made by the compiler using reasonable heuristics, tuned over time to produce the optimum runtime performance. However, GCC also has a way to teach the compiler to optimize executables for a specific machine in a specific production environment. This feature is called profile feedback. Profile feedback is used to tune optimizations such as: Inlining Branch prediction Instruction scheduling Inter-procedural constant propagation D etermining of hot or cold functions Profile feedback compiles a program first to generate a program that is run and analyzed and then a second time to optimize with the gathered data. Pro ced u re 4 .4 . U sin g Pro f ile Feed b ack 1. The application must be instrumented to produce profiling information by compiling it with fpro fi l e-g enerate. 2. Run the application to accumulate and save the profiling information. 3. Recompile the application with -fpro fi l e-use. Step three will use the profile information gathered in step one to tune the compiler's heuristics while optimizing the code into a final executable. Pro ced u re 4 .5. C o mp ilin g a Pro g ram wit h Pro f ilin g Feed b ack 1. Compile so urce. c to include profiling instrumentation: g cc so urce. c -fpro fi l e-g enerate -O 2 -o executabl e 2. Run executabl e to gather profiling information: . /executabl e 3. Recompile and optimize so urce. c with profiling information gathered in step one: g cc so urce. c -fpro fi l e-use -O 2 -o executabl e 70 Chapt er 4 . Compiling and Building Multiple data collection runs, as seen in step two, will accumulate data into the profiling file instead of replacing it. This allows the executable in step two to be run multiple times with additional representative data in order to collect even more information. The executable must run with representative levels of both the machine being used and a respective data set large enough for the input required. This ensures optimal results are achieved. By default, GCC will generate the profile data into the directory where step one was performed. To generate this information elsewhere, compile with -fpro fi l e-d i r= D IR where D IR is the preferred output directory. Warning The format of the compiler feedback data file changes between compiler versions. It is imperative that the program compilation is repeated with each version of the compiler. 4 .1 .6 .6 . Using 32 -bit co m pile rs o n a 6 4 -bit ho st On a 64-bit host, GCC will build executables that can only run on 64-bit hosts. However, GCC can be used to build executables that will run both on 64-bit hosts and on 32-bit hosts. To build 32-bit binaries on a 64-bit host, first install 32-bit versions of any supporting libraries the executable may require. This must at least include supporting libraries for g l i bc and l i bg cc, and l i bstd c+ + if the program is a C++ program. On Intel 64 and AMD 64, this can be done with: yum i nstal l g l i bc-d evel . i 6 86 l i bg cc. i 6 86 l i bstd c+ + -d evel . i 6 86 There may be cases where it is useful to to install additional 32-bit libraries that a program may require. For example, if a program uses the d b4 -d evel libraries to build, the 32-bit version of these libraries can be installed with: yum i nstal l d b4 -d evel . i 6 86 Note The . i 6 86 suffix on the x86 platform (as opposed to x86 -6 4 ) specifies a 32-bit version of the given package. For PowerPC architectures, the suffix is ppc (as opposed to ppc6 4 ). After the 32-bit libraries have been installed, the -m32 option can be passed to the compiler and linker to produce 32-bit executables. Provided the supporting 32-bit libraries are installed on the 64bit system, this executable will be able to run on both 32-bit systems and 64-bit systems. Pro ced u re 4 .6 . C o mp ilin g a 32- b it Pro g ram o n a 6 4 - b it H o st 1. On a 64-bit system, compile hel l o . c into a 64-bit executable with: g cc hel l o . c -o hel l o 6 4 2. Ensure that the resulting executable is a 64-bit binary: $ file hello64 hello64: ELF 64-bit LSB executable, x86-64, version 1 (GNU/Linux), dynamically linked (uses shared libs), for GNU/Linux 2.6.18, not 71 Red Hat Ent erprise Linux 6 Developer G uide stripped $ ldd hello64 linux-vdso.so.1 => (0x00007fff242dd000) libc.so.6 => /lib64/libc.so.6 (0x00007f0721514000) /lib64/ld-linux-x86-64.so.2 (0x00007f0721893000) The command fi l e on a 64-bit executable will include ELF 6 4 -bi t in its output, and l d d will list /l i b6 4 /l i bc. so . 6 as the main C library linked. 3. On a 64-bit system, compile hel l o . c into a 32-bit executable with: g cc -m32 hel l o . c -o hel l o 32 4. Ensure that the resulting executable is a 32-bit binary: $ file hello32 hello32: ELF 32-bit LSB executable, Intel 80386, version 1 (GNU/Linux), dynamically linked (uses shared libs), for GNU/Linux 2.6.18, not stripped $ ldd hello32 linux-gate.so.1 => (0x007eb000) libc.so.6 => /lib/libc.so.6 (0x00b13000) /lib/ld-linux.so.2 (0x00cd7000) The command fi l e on a 32-bit executable will include ELF 32-bi t in its output, and l d d will list /l i b/l i bc. so . 6 as the main C library linked. If you have not installed the 32-bit supporting libraries you will get an error similar to this for C code: $ gcc -m32 hello32.c -o hello32 /usr/bin/ld: crt1.o: No such file: No such file or directory collect2: ld returned 1 exit status A similar error would be triggered on C++ code: $ g++ -m32 hello32.cc -o hello32-c++ In file included from /usr/include/features.h:385, from /usr/lib/gcc/x86_64-redhatlinux/4.4.4/../../../../include/c++/4.4.4/x86_64-redhatlinux/32/bits/os_defines.h:39, from /usr/lib/gcc/x86_64-redhatlinux/4.4.4/../../../../include/c++/4.4.4/x86_64-redhatlinux/32/bits/c++config.h:243, from /usr/lib/gcc/x86_64-redhatlinux/4.4.4/../../../../include/c++/4.4.4/iostream:39, from hello32.cc:1: /usr/include/gnu/stubs.h:7:27: error: gnu/stubs-32.h: No such file or directory These errors indicate that the supporting 32-bit libraries have not been properly installed as explained at the beginning of this section. Also important is to note that building with -m32 will in not adapt or convert a program to resolve any issues arising from 32/64-bit incompatibilities. For tips on writing portable code and converting from 32-bits to 64-bits, see the paper entitled Porting to 64-bit GNU/Linux Systems in the Proceedings of the 2003 GCC D evelopers Summit. 72 Chapt er 4 . Compiling and Building 4 .1.7. GCC Document at ion For more information about GCC compilers, see the man pages for cpp, g cc, g + + , g cj, and g fo rtran. the following online user manuals are also available: GCC 4.4.4 Manual GCC 4.4.4 GNU Fortran Manual GCC 4.4.4 GCJ Manual GCC 4.4.4 CPP Manual GCC 4.4.4 GNAT Reference Manual GCC 4.4.4 GNAT User's Guide GCC 4.4.4 GNU OpenMP Manual The main site for the development of GCC is gcc.gnu.org. 4 .2. Dist ribut ed Compiling Red Hat Enterprise Linux 6 also supports distributed compiling. This involves transforming one compile job into many smaller jobs; these jobs are distributed over a cluster of machines, which speeds up build time (particularly for programs with large codebases). The d i stcc package provides this capability. To set up distributed compiling, install the following packages: d i stcc d i stcc-server For more information about distributed compiling, see the man pages for d i stcc and d i stccd . The following link also provides detailed information about the development of d i stcc: http://code.google.com/p/distcc 4 .3. Aut ot ools GNU Autotools is a suite of command line tools that allow developers to build applications on different systems, regardless of the installed packages or even Linux distribution. These tools aid developers in creating a co nfi g ure script. This script runs prior to builds and creates the top-level Makefi l es required to build the application. The co nfi g ure script may perform tests on the current system, create additional files, or run other directives as per parameters provided by the builder. The Autotools suite's most commonly-used tools are: au t o co n f Generates the co nfi g ure script from an input file (co nfi g ure. ac, for example) au t o make 73 Red Hat Ent erprise Linux 6 Developer G uide Creates the Makefi l e for a project on a specific system au t o scan Generates a preliminary input file (that is, co nfi g ure. scan), which can be edited to create a final co nfi g ure. ac to be used by auto co nf All tools in the Autotools suite are part of the D evel o pment T o o l s group package. You can install this package group to install the entire Autotools suite, or use yum to install any tools in the suite as you wish. 4 .3.1. Aut ot ools Plug-in for Eclipse The Autotools suite is also integrated into the Eclipse ID E via the Autotools plug-in. This plug-in provides an Eclipse graphical user interface for Autotools, which is suitable for most C/C++ projects. As of Red Hat Enterprise Linux 6, this plug-in only supports two templates for new C/C++ projects: An empty project A " hello world" application The empty project template is used when importing projects into the C/C++ D evelopment Toolkit that already support Autotools. Future updates to the Autotools plug-in will include additional graphical user interfaces (wizards, for example) for creating shared libraries and other complex scenarios. The Red Hat Enterprise Linux 6 version of the Autotools plug-in also does not integrate g i t or mercuri al into Eclipse. As such, Autotools projects that use g i t repositories will be required to be checked out outside the Eclipse workspace. Afterwards, you can specify the source location for such projects in Eclipse. Any repository manipulation (commits, or updates for example) are done via the command line. 4 .3.2. Configurat ion Script The most crucial function of Autotools is the creation of the co nfi g ure script. This script tests systems for tools, input files, and other features it can use in order to build the project [2] . The co nfi g ure script generates a Makefi l e which allows the make tool to build the project based on the system configuration. To create the co nfi g ure script, first create an input file. Then feed it to an Autotools utility in order to create the co nfi g ure script. This input file is typically co nfi g ure. ac or Makefi l e. am; the former is usually processed by auto co nf, while the later is fed to auto make. If a Makefi l e. am input file is available, the auto make utility creates a Makefi l e template (that is, Makefi l e. i n), which may see information collected at configuration time. For example, the Makefi l e may have to link to a particular library if and only if that library is already installed. When the co nfi g ure script runs, auto make will use the Makefi l e. i n templates to create a Makefi l e. If a co nfi g ure. ac file is available instead, then auto co nf will automatically create the co nfi g ure script based on the macros invoked by co nfi g ure. ac. To create a preliminary co nfi g ure. ac, use the auto scan utility and edit the file accordingly. 4 .3.3. Aut ot ools Document at ion 74 Chapt er 4 . Compiling and Building Red Hat Enterprise Linux 6 includes man pages for auto co nf, auto make, auto scan and most tools included in the Autotools suite. In addition, the Autotools community provides extensive documentation on auto co nf and auto make on the following websites: http://www.gnu.org/software/autoconf/manual/autoconf.html http://www.gnu.org/software/autoconf/manual/automake.html The following is an online book describing the use of Autotools. Although the above online documentation is the recommended and most up to date information on Autotools, this book is a good alternative and introduction. http://sourceware.org/autobook/ For information on how to create Autotools input files, see: http://www.gnu.org/software/autoconf/manual/autoconf.html#Making-configure-Scripts http://www.gnu.org/software/autoconf/manual/automake.html#Invoking-Automake The following upstream example also illustrates the use of Autotools in a simple hel l o program: http://www.gnu.org/software/hello/manual/hello.html 4 .4 . Eclipse Built -in Specfile Edit or The Specfile Editor Plug-in for Eclipse provides useful features to help developers manage . spec files. This plug-in allows users to leverage several Eclipse GUI features in editing . spec files, such as auto-completion, highlighting, file hyperlinks, and folding. In addition, the Specfile Editor Plug-in also integrates the rpml i nt tool into the Eclipse interface. rpml i nt is a command line tool that helps developers detect common RPM package errors. The richer visualization offered by the Eclipse interface helps developers quickly detect, view, and correct mistakes reported by rpml i nt. The Specfile Editor for Eclipse is provided by the ecl i pse-rpm-ed i to r package. For more information about this plug-in, see Specfile Editor User Guide in the Eclipse H elp C o n t en t s. 4 .5. CDT in Eclipse The CDT (C/C++ D evelopment Tools) is an Eclipse project that adds support for developing C and C++ projects with Eclipse. A user can create three forms of projects: 1. Managed Make Project 2. Standard Make Project 3. Autotools Project 4 .5.1. Managed Make Project A managed make CD T project, sometimes referred to as a managed project, is one where the details regarding how to build the project are automated on behalf of the end-user. This differs from the standard make project, another common type of CD T C/C++ project, whereby a user supplies a Makefile that has the build details specified. For a managed project, start by selecting the type of managed project and the required toolchain. 75 Red Hat Ent erprise Linux 6 Developer G uide The project type is categorized based on the ultimate target of the project, such as an executable, a shared library, or a static library. Within these categories there may be templates for more specific projects (a hello world sample executable project, for example) where base source files are already provided. These can then be further customized. A toolchain is the set of tools used to generate the target. Typically, a Red Hat Enterprise Linux C/C++ developer would select the Linux GCC toolchain, which uses GCC for compiling, linking and assembly. Each tool in the toolchain is associated with one or more input types, typically specified by file suffix (for example, . c or . h or . S) or by file name. The tool will have parameter settings which can be customized by the developer, and each tool has an output type it creates. The tool also has a command or binary executable associated with it which may overlap among multiple tools. The C compiler and linker, for example, can both use GCC, but the compiler and linker tools will each have different input and output types, as well as different settings presented to the developer. Customize the tool settings through Pro p ert ies > C /C + + B u ild > Set t in g s. The toolchain itself can be customized in order to add, remove, or replace the used tools through Pro p ert ies > C /C + + B u ild > T o o lch ain Ed it o r. New files, such as source files or header files, can be added to the project once it has been created. The new files are added automatically to the build based on their input types and the tool settings. Navigate to Pro ject > C /C + + B u ild under the B u ild er Set t in g s tab in order for the managed make project to generate a Makefile which can be distributed with the project. This facilitates the use of the Makefile outside Eclipse. For more information regarding managed make C/C++ projects, see the C/C++ Development User Guide which can be found by navigating to C o n cep t s > Pro ject T yp es, T asks > C reat in g a Pro ject , or R ef eren ce > C /C + + Pro p ert ies > C /C + + Pro ject Pro p ert ies > C /C + + B u ild > Set t in g s Pag e. 4 .5.2. St andard Make Project A standard make CD T project is a traditional C project with a Makefile that is manually managed by the developer. Unlike the managed make project, there are no tool settings to be used in determining rules in the Makefile. Manual additions to the Makefile are required when new source files that are to be processed as part of the build are added to the project. If a pattern rule exists which the new file name matches (for example, . c: . o , which states how to process a file with the suffix . c into a file with the suffix . o ), then this is not required. The default make target for building the project is al l , and the default make target for cleaning the project is cl ean. It is also possible for a user to build other targets found in the Makefile. To do this use the Makefile Target dialog to create targets to run or build existing ones. Creating pseudo-targets that group multiple targets found in the makefile in a particular order is also done through the Makefile Target dialog. To access the specific create and build dialogs, select Pro ject > Make T arg et > C reat e... and Pro ject > Make T arg et > B u ild ... respectively. Alternatively, right click on reso urces in the project and select the Make T arg et s option to access either C reat e... or B u ild ... For more information regarding standard make C/C++ projects, see the C/C++ D evelopment user guide, accessed through C o n cep t s > Pro ject T yp es, T asks > C reat in g a p ro ject or R ef eren ce > C /C + + Pro p ert ies > C /C + + Pro ject Pro p ert ies > C /C + + B u ild > Set t in g s Pag e. 4 .5.3. Aut ot ools Project An autotools project is a lot like a standard make project however the Makefile is usually generated as part of a configuration step that occurs prior to building. See Section 4.3, “ Autotools” for details on Autotools and the Autotools plug-in for Eclipse which adds support for this type of project. Like a standard make project, make targets can be run with the Make Target dialog. 76 Chapt er 4 . Compiling and Building 4 .6. build-id Unique Ident ificat ion of Binaries Each executable or shared library built with Red Hat Enterprise Linux Server 6 or later is assigned a unique identification 160-bit SHA-1 string, generated as a checksum of selected parts of the binary. This allows two builds of the same program on the same host to always produce consistent build-ids and binary content. D isplay the build-id of a binary with the following command: $ eu-readelf -n /bin/bash [...] Note section [ 3] '.note.gnu.build-id' of 36 bytes at offset 0x274: Owner Data size Type GNU 20 GNU_BUILD_ID Build ID: efdd0b5e69b0742fa5e5bad0771df4d1df2459d1 Unique identificators of binaries are useful in cases such as analysing core files, documented Section 5.2.1, “ Installing D ebuginfo Packages for Core Files Analysis” . 4 .7. Soft ware Collect ions and scl-ut ils With Software Collections, it is possible to build and concurrently install multiple versions of the same RPM packages on a system. Software Collections have no impact on the system versions of the packages installed by the conventional RPM package manager. To enable support for Software Collections on a system, install the packages scl-utils and by typing the following at a shell prompt as ro o t: ~]# yum i nstal l scl -uti l s The scl-utils package provides the scl tool, which is used to enable a Software Collection and to run applications in the Software Collection environment. General usage of the scl tool can be described using the following syntax: scl action software_collection_1 software_collection_2 command Examp le 4 .1. R u n n in g an Ap p licat io n D irect ly To directly run Perl with the --versi o n option in the Software Collection named so f t ware_co llect io n _1, execute the following command: scl enabl e so ftware_co l l ecti o n_1 ' perl --versi o n' Examp le 4 .2. R u n n in g a Sh ell wit h Mu lt ip le So f t ware C o llect io n s En ab led To run the B ash shell in the environment with multiple Software Collections enabled, execute the following command: scl enabl e so ftware_co l l ecti o n_1 so ftware_co l l ecti o n_2 bash 77 Red Hat Ent erprise Linux 6 Developer G uide The command above enables two Software Collections named so f t ware_co llect io n _1 and so f t ware_co llect io n _2. Examp le 4 .3. R u n n in g C o mman d s St o red in a File To execute a number of commands, which are stored in a file, in the Software Collections environment, run the following command: cat cmd | scl enabl e so ftware_co l l ecti o n_1 The above command executes commands, which are stored in the cmd file, in the environment of the Software Collection named so f t ware_co llect io n _1. For more information regarding Software Collections and scl -uti l s, see the Red Hat Software Collections 1.2 Beta Packaging Guide. [2] Fo r info rmatio n ab o ut tes ts that co nfi g ure c an p erfo rm, s ee the fo llo wing link: http ://www.g nu.o rg /s o ftware/auto c o nf/manual/auto c o nf.html#Exis ting -Tes ts 78 Chapt er 5. Debugging Chapter 5. Debugging Useful, well-written software generally goes through several different phases of application development, allowing ample opportunity for mistakes to be made. Some phases come with their own set of mechanisms to detect errors. For example, during compilation an elementary semantic analysis is often performed to make sure objects, such as variables and functions, are adequately described. The error-checking mechanisms performed during each application development phase aims to catch simple and obvious mistakes in code. The debugging phase helps to bring more subtle errors to light that fell through the cracks during routine code inspection. 5.1. ELF Execut able Binaries Red Hat Enterprise Linux uses ELF for executable binaries, shared libraries, or debuginfo files. Within these debuginfo ELF files, the D WARF format is used. Version 3 of D WARF is used in ELF files (that is, g cc -g is equivalent to g cc -g d warf-3). D WARF debuginfo includes: names of all the compiled functions and variables, including their target addresses in binaries source files used for compilation, including their source line numbers local variables location Important STABS is occasionally used with UNIX. STABS is an older, less capable format. Its use is discouraged by Red Hat. GCC and GD B support STABS production and consumption on a best effort basis only. Within these ELF files, the GCC debuginfo level is also used. The default is level 2, where macro information is not present; level 3 has C/C++ macro definitions included, but the debuginfo can be very large with this setting. The command for the default g cc -g is the same as g cc -g 2. To change the macro information to level three, use g cc -g 3. There are multiple levels of debuginfo available. Use the command read el f -WS file to see which sections are used in a file. T ab le 5.1. d eb u g in f o levels B in ary St at e C o mman d N o t es Stripped stri p file or Only the symbols required for runtime linkage with shared libraries are present. g cc -s -o file ELF section in use: . d ynsym g cc -o file Only the names of functions and variables are present, no binding to the source files and no types. ELF symbols ELF section in use: . symtab 79 Red Hat Ent erprise Linux 6 Developer G uide B in ary St at e C o mman d N o t es D WARF debuginfo with macros g cc -g -o file The source file names and line numbers are known, including types. ELF section in use: . d ebug _* D WARF debuginfo with macros g cc -g 3 -o file Similar to g cc -g but the macros are known to GD B. ELF section in use: . d ebug _macro Note GD B never interprets the source files, it only displays them as text. Use g cc -g and its variants to store the information into D WARF. Compiling a program or library with g cc -rd ynami c is discouraged. For specific symbols, use g cc -Wl , --d ynami c-l i st= . . . instead. If g cc -rd ynami c is used, the stri p command or -s gcc option have no effect. This is because all ELF symbols are kept in the binary for possible runtime linkage with shared libraries. ELF symbols can be read by the read el f -s file command. D WARF symbols are read by the read el f -w file command. The command read el f -wi file is a good verification of debuginfo, compiled within your program. The commands stri p file or g cc -s are commonly accidentally executed on the output during various compilation stages of the program. The read el f -w file command can also be used to show a special section called . eh_frame with a format and purpose is similar to the D WARF section . d ebug _frame. The . eh_frame section is used for runtime C++ exception resolution and is present even if -g gcc option was not used. It is kept in the primary RPM and is never present in the debuginfo RPMs. D ebuginfo RPMs contain the sections . symtab and . d ebug _*. Neither . eh_frame, . eh_frame_hd r, nor . d ynsym are moved or present in debuginfo RPMs as those sections are needed during program runtime. 5.2. Inst alling Debuginfo Packages Red Hat Enterprise Linux also provides -d ebug i nfo packages for all architecture-dependent RPMs included in the operating system. A packagenamed ebug i nfo -version-release. architecture. rpm package contains detailed information about the relationship of the package source files and the final installed binary. The debuginfo packages contain both . d ebug files, which in turn contain D WARF debuginfo and the source files used for compiling the binary packages. 80 Chapt er 5. Debugging Note Most of the debugger functionality is missed if attempting to debug a package without having its debuginfo equivalent installed. For example, the names of exported shared library functions will still be available, but the matching source file lines will not be without the debuginfo package installed. Use g cc compilation option -g for your own programs. The debugging experience is better if no optimizations (gcc option -O , such as -O 2) is applied with -g . For Red Hat Enterprise Linux 6, the debuginfo packages are now available on a new channel on the Red Hat Network. To install the -d ebug i nfo package of a package (that is, typically packagename-d ebug i nfo ), first the machine has to be subscribed to the corresponding D ebuginfo channel. For example, for Red Hat Enterprise Server 6, the corresponding channel would be R ed Hat Enterpri se Li nux Server D ebug i nfo (v. 6 ). Red Hat Enterprise Linux system packages are compiled with optimizations (gcc option -O 2). This means that some variables will be displayed as <o pti mi zed o ut>. Stepping through code will 'jump' a little but a crash can still be analyzed. If some debugging information is missing because of the optimizations, the right variable information can be found by disassembling the code and matching it to the source manually. This is applicable only in exceptional cases and is not suitable for regular debugging. For system packages, GD B informs the user if it is missing some debuginfo packages that limit its functionality. gdb ls [...] Reading symbols from /bin/ls...(no debugging symbols found)...done. Missing separate debuginfos, use: debuginfo-install coreutils-8.416.el6.x86_64 (gdb) q If the system package to be debugged is known, use the command suggested by GD B above. It will also automatically install all the debug packages packagename depends on. # debuginfo-install packagename 5.2.1. Inst alling Debuginfo Packages for Core Files Analysis A core file is a representation of the memory image at the time of a process crash. For bug reporting of system program crashes, Red Hat recommends the use of the ABRT tool, explained in the Automatic Bug Reporting Tool chapter in the Red Hat Deployment Guide. If ABRT is not suitable for your purposes, the steps it automates are explained here. If the ul i mi t -c unl i mi ted setting is in use when a process crashes, the core file is dumped into the current directory. The core file contains only the memory areas modified by the process from the original state of disk files. In order to perform a full analysis of a crash, a core file is required to have: the core file itself the executable binary which has crashed, such as /usr/sbi n/send mai l all the shared libraries loaded in the binary when it crashed 81 Red Hat Ent erprise Linux 6 Developer G uide .debug files and source files (both stored in debuginfo RPMs) for the executable and all of its loaded libraries For a proper analysis, either the exact version-release.architecture for all the RPMs involved or the same build of your own compiled binaries is needed. At the time of the crash, the application may have already recompiled or been updated by yum on the disk, rendering the files inappropriate for the core file analysis. The core file contains build-ids of all the binaries involved. For more information on build-id, see Section 4.6, “ build-id Unique Identification of Binaries” . The contents of the core file can be displayed by: $ eu-unstrip -n --core=./core.9814 0x400000+0x207000 2818b2009547f780a5639c904cded443e564973e@ 0x400284 /bin/sleep /usr/lib/debug/bin/sleep.debug [exe] 0x7fff26fff000+0x1000 1e2a683b7d877576970e4275d41a6aaec280795e@ 0x7fff26fff340 . - linux-vdso.so.1 0x35e7e00000+0x3b6000 374add1ead31ccb449779bc7ee7877de3377e5ad@ 0x35e7e00280 /lib64/libc2.14.90.so /usr/lib/debug/lib64/libc-2.14.90.so.debug libc.so.6 0x35e7a00000+0x224000 3ed9e61c2b7e707ce244816335776afa2ad0307d@ 0x35e7a001d8 /lib64/ld-2.14.90.so /usr/lib/debug/lib64/ld-2.14.90.so.debug ld-linux-x86-64.so.2 The meaning of the columns in each line are: The in-memory address where the specific binary was mapped to (for example, 0 x4 0 0 0 0 0 in the first line). The size of the binary (for example, + 0 x20 70 0 0 in the first line). The 160-bit SHA-1 build-id of the binary (for example, 2818b20 0 9 54 7f780 a56 39 c9 0 4 cd ed 4 4 3e56 4 9 73e in the first line). The in-memory address where the build-id bytes were stored (for example, @ 0 x4 0 0 284 in the first line). The on-disk binary file, if available (for example, /bi n/sl eep in the first line). This was found by eu-unstri p for this module. The on-disk debuginfo file, if available (for example, /usr/l i b/d ebug /bi n/sl eep. d ebug ). However, best practice is to use the binary file reference instead. The shared library name as stored in the shared library list in the core file (for example, l i bc. so . 6 in the third line). For each build-id (for example, ab/cd ef0 1234 56 789 0 1234 56 789 0 1234 56 789 0 123) a symbolic link is included in its debuginfo RPM. Using the /bi n/sl eep executable above as an example, the co reuti l s-d ebug i nfo RPM contains, among other files: lrwxrwxrwx 1 root root 24 Nov 29 17:07 /usr/lib/debug/.buildid/28/18b2009547f780a5639c904cded443e564973e -> ../../../../../bin/sleep* lrwxrwxrwx 1 root root 21 Nov 29 17:07 /usr/lib/debug/.buildid/28/18b2009547f780a5639c904cded443e564973e.debug -> ../../bin/sleep.debug In some cases (such as loading a core file), GD B does not know the name, version, or release of a name-d ebug i nfo -version-release. rpm package; it only knows the build-id. In such cases, 82 Chapt er 5. Debugging GD B suggests a different command: gdb -c ./core [...] Missing separate debuginfo for the main executable filename Try: yum --disablerepo='*' --enablerepo='*debug*' install /usr/lib/debug/.build-id/ef/dd0b5e69b0742fa5e5bad0771df4d1df2459d1 The version-release.architecture of the binary package packagename-debuginfo-versionrelease.architecture.rpm must be an exact match. If it differs then GD B cannot use the debuginfo package. Even the same version-release.architecture from a different build leads to an incompatible debuginfo package. If GD B reports a missing debuginfo, ensure to recheck: rpm -q packagename packagename-d ebug i nfo The version-release.architecture definitions should match. rpm -V packagename packagename-d ebug i nfo This command should produce no output, except possibly modified configuration files of packagename, for example. rpm -q i packagename packagename-d ebug i nfo The version-release.architecture should display matching information for Vendor, Build D ate, and Build Host. For example, using a CentOS debuginfo RPM for a Red Hat Enterprise Linux RPM package will not work. If the required build-id is known, the following command can query which RPM contains it: $ repoquery --disablerepo='*' --enablerepo='*-debug*' -qf /usr/lib/debug/.build-id/ef/dd0b5e69b0742fa5e5bad0771df4d1df2459d1 For example, a version of an executable which matches the core file can be installed by: # yum --enablerepo='*-debug*' install $(eu-unstrip -n --core=./core.9814 | sed -e 's#^[^ ]* \(..\)\([^@ ]*\).*$#/usr/lib/debug/.build-id/\1/\2#p' -e 's/$/.debug/') Similar methods are available if the binaries are not packaged into RPMs and stored in yum repositories. It is possible to create local repositories with custom application builds by using /usr/bi n/createrepo . 5.3. GDB Fundamentally, like most debuggers, GD B manages the execution of compiled code in a very closely controlled environment. This environment makes possible the following fundamental mechanisms necessary to the operation of GD B: Inspect and modify memory within the code being debugged (for example, reading and setting variables). Control the execution state of the code being debugged, principally whether it's running or stopped. 83 Red Hat Ent erprise Linux 6 Developer G uide D etect the execution of particular sections of code (for example, stop running code when it reaches a specified area of interest to the programmer). D etect access to particular areas of memory (for example, stop running code when it accesses a specified variable). Execute portions of code (from an otherwise stopped program) in a controlled manner. D etect various programmatic asynchronous events such as signals. The operation of these mechanisms rely mostly on information produced by a compiler. For example, to view the value of a variable, GD B has to know: The location of the variable in memory The nature of the variable This means that displaying a double-precision floating point value requires a very different process from displaying a string of characters. For something complex like a structure, GD B has to know not only the characteristics of each individual elements in the structure, but the morphology of the structure as well. GD B requires the following items in order to fully function: D eb u g In f o rmat io n Much of GD B's operations rely on a program's debug information. While this information generally comes from compilers, much of it is necessary only while debugging a program, that is, it is not used during the program's normal execution. For this reason, compilers do not always make that information available by default — GCC, for instance, must be explicitly instructed to provide this debugging information with the -g flag. To make full use of GD B's capabilities, it is highly advisable to make the debug information available first to GD B. GD B can only be of very limited use when run against code with no available debug information. So u rce C o d e One of the most useful features of GD B (or any other debugger) is the ability to associate events and circumstances in program execution with their corresponding location in source code. This location normally refers to a specific line or series of lines in a source file. This, of course, would require that a program's source code be available to GD B at debug time. 5.3.1. Simple GDB GD B literally contains dozens of commands. This section describes the most fundamental ones. br ( b reakp o in t ) The breakpoint command instructs GD B to halt execution upon reaching a specified point in the execution. That point can be specified a number of ways, but the most common are just as the line number in the source file, or the name of a function. Any number of breakpoints can be in effect simultaneously. This is frequently the first command issued after starting GD B. r ( ru n ) The run command starts the execution of the program. If run is executed with any arguments, those arguments are passed on to the executable as if the program has been started normally. Users normally issue this command after setting breakpoints. 84 Chapt er 5. Debugging Before an executable is started, or once the executable stops at, for example, a breakpoint, the state of many aspects of the program can be inspected. The following commands are a few of the more common ways things can be examined. p ( p rin t ) The pri nt command displays the value of the argument given, and that argument can be almost anything relevant to the program. Usually, the argument is the name of a variable of any complexity, from a simple single value to a structure. An argument can also be an expression valid in the current language, including the use of program variables and library functions, or functions defined in the program being tested. bt ( b ackt race) The backtrace displays the chain of function calls used up until the execution was terminated. This is useful for investigating serious bugs (such as segmentation faults) with elusive causes. l ( list ) When execution is stopped, the l i st command shows the line in the source code corresponding to where the program stopped. The execution of a stopped program can be resumed in a number of ways. The following are the most common. c ( co n t in u e) The co nti nue command restarts the execution of the program, which will continue to execute until it encounters a breakpoint, runs into a specified or emergent condition (for example, an error), or terminates. n ( n ext ) Like co nti nue, the next command also restarts execution; however, in addition to the stopping conditions implicit in the co nti nue command, next will also halt execution at the next sequential line of code in the current source file. s ( st ep ) Like next, the step command also halts execution at each sequential line of code in the current source file. However, if execution is currently stopped at a source line containing a function call, GD B stops execution after entering the function call (rather than executing it). fi ni ( f in ish ) Like the aforementioned commands, the fi ni sh command resumes executions, but halts when execution returns from a function. Finally, two essential commands: q ( q u it ) This terminates the execution. h ( h elp ) 85 Red Hat Ent erprise Linux 6 Developer G uide The hel p command provides access to its extensive internal documentation. The command takes arguments: hel p breakpo i nt (or h br), for example, shows a detailed description of the breakpo i nt command. See the hel p output of each command for more detailed information. 5.3.2. Running GDB This section will describe a basic execution of GD B, using the following simple program: h ello .c #include <stdio.h> char hello[] = { "Hello, World!" }; int main() { fprintf (stdout, "%s\n", hello); return (0); } The following procedure illustrates the debugging process in its most basic form. Pro ced u re 5.1. D eb u g g in g a ' H ello Wo rld ' Pro g ram 1. Compile hello.c into an executable with the debug flag set, as in: g cc -g -o hel l o hel l o . c Ensure that the resulting binary hel l o is in the same directory as hel l o . c. 2. Run g d b on the hel l o binary, that is, g d b hel l o . 3. After several introductory comments, g d b will display the default GD B prompt: (gdb) 4. The variable hel l o is global, so it can be seen even before the mai n procedure starts: gdb) p hello $1 = "Hello, World!" (gdb) p hello[0] $2 = 72 'H' (gdb) p *hello $3 = 72 'H' (gdb) Note that the pri nt targets hel l o [0 ] and *hel l o require the evaluation of an expression, as does, for example, *(hel l o + 1): (gdb) p *(hello + 1) $4 = 101 'e' 5. Next, list the source: 86 Chapt er 5. Debugging (gdb) l 1 #include <stdio.h> 2 3 char hello[] = { "Hello, World!" }; 4 5 int 6 main() 7 { 8 fprintf (stdout, "%s\n", hello); 9 return (0); 10 } The l i st reveals that the fpri ntf call is on line 8. Apply a breakpoint on that line and resume the code: (gdb) br 8 Breakpoint 1 at 0x80483ed: file hello.c, line 8. (gdb) r Starting program: /home/moller/tinkering/gdb-manual/hello Breakpoint 1, main () at hello.c:8 8 fprintf (stdout, "%s\n", hello); 6. Finally, use the next command to step past the fpri ntf call, executing it: (gdb) n Hello, World! 9 return (0); The following sections describe more complex applications of GD B. 5.3.3. Condit ional Breakpoint s In many real-world cases, a program may perform its task well during the first few thousand times; it may then start crashing or encountering errors during its eight thousandth iteration of the task. D ebugging programs like this can be difficult, as it is hard to imagine a programmer with the patience to issue a co nti nue command thousands of times just to get to the iteration that crashed. Situations like this are common in real life, which is why GD B allows programmers to attach conditions to a breakpoint. For example, consider the following program: simp le.c #include <stdio.h> main() { int i; for (i = 0;; i++) { fprintf (stdout, "i = %d\n", i); } } 87 Red Hat Ent erprise Linux 6 Developer G uide To set a conditional breakpoint at the GD B prompt: (gdb) br 8 if i == 8936 Breakpoint 1 at 0x80483f5: file iterations.c, line 8. (gdb) r With this condition, the program execution will eventually stop with the following output: i i i i i = = = = = 8931 8932 8933 8934 8935 Breakpoint 1, main () at iterations.c:8 8 fprintf (stdout, "i = %d\n", i); Inspect the breakpoint information (using i nfo br) to review the breakpoint status: (gdb) info br Num Type Disp Enb Address What 1 breakpoint keep y 0x080483f5 in main at iterations.c:8 stop only if i == 8936 breakpoint already hit 1 time 5.3.4 . Forked Execut ion Among the more challenging bugs confronting programmers is where one program (the parent) makes an independent copy of itself (a fork). That fork then creates a child process which, in turn, fails. D ebugging the parent process may or may not be useful. Often the only way to get to the bug may be by debugging the child process, but this is not always possible. The set fo l l o w-fo rk-mo d e feature is used to overcome this barrier allowing programmers to follow a a child process instead of the parent process. set fo l l o w-fo rk-mo d e parent The original process is debugged after a fork. The child process runs unimpeded. This is the default. set fo l l o w-fo rk-mo d e chi l d The new process is debugged after a fork. The parent process runs unimpeded. sho w fo l l o w-fo rk-mo d e D isplay the current debugger response to a fork call. Use the set d etach-o n-fo rk command to debug both the parent and the child processes after a fork, or retain debugger control over them both. set d etach-o n-fo rk o n The child process (or parent process, depending on the value of fo l l o w-fo rk-mo d e) will be detached and allowed to run independently. This is the default. set d etach-o n-fo rk o ff 88 Chapt er 5. Debugging Both processes will be held under the control of GD B. One process (child or parent, depending on the value of fo l l o w-fo rk-mo d e) is debugged as usual, while the other is suspended. sho w d etach-o n-fo rk Show whether d etach-o n-fo rk mode is on or off. Consider the following program: f o rk.c # include <unistd.h> i nt main() { pid_t pid; const char *name; pid = fork(); if (pid == 0) { name = "I am the child"; } else { name = "I am the parent"; } return 0; } This program, compiled with the command g cc -g fo rk. c -o fo rk -l pthread and examined under GD B will show: g db ./fork [...] ( gdb) break main B reakpoint 1 at 0x4005dc: file fork.c, line 8. ( gdb) run [...] B reakpoint 1, main () at fork.c:8 8 pid = fork(); ( gdb) next D etaching after fork from child process 3840. 9 if (pid == 0) ( gdb) next 15 name = "I am the parent"; ( gdb) next 17 return 0; ( gdb) print name $ 1 = 0x400717 "I am the parent" GD B followed the parent process and allowed the child process (process 3840) to continue execution. The following is the same test using set fo l l o w-fo rk-mo d e chi l d . 89 Red Hat Ent erprise Linux 6 Developer G uide ( gdb) set follow-fork-mode child ( gdb) break main B reakpoint 1 at 0x4005dc: file fork.c, line 8. ( gdb) run [...] B reakpoint 1, main () at fork.c:8 8 pid = fork(); ( gdb) next [New process 3875] [Thread debugging using libthread_db enabled] [Switching to Thread 0x7ffff7fd5720 (LWP 3875)] 9 if (pid == 0) ( gdb) next 11 name = "I am the child"; ( gdb) next 17 return 0; ( gdb) print name $ 2 = 0x400708 "I am the child" ( gdb) GD B switched to the child process here. This can be permanent by adding the setting to the appropriate . g d bi ni t. For example, if set fo l l o w-fo rk-mo d e ask is added to ~ /. g d bi ni t, then ask mode becomes the default mode. 5.3.5. Debugging Individual T hreads GD B has the ability to debug individual threads, and to manipulate and examine them independently. This functionality is not enabled by default. To do so use set no n-sto p o n and set targ et-async o n. These can be added to . g d bi ni t. Once that functionality is turned on, GD B is ready to conduct thread debugging. For example, the following program creates two threads. These two threads, along with the original thread executing main makes a total of three threads. t h ree- t h read s.c # include <stdio.h> # include <pthread.h> # include <unistd.h> p thread_t thread; v oid* thread3 (void* d) { int count3 = 0; while(count3 < 1000){ sleep(10); printf("Thread 3: %d\n", count3++); } return NULL; } 90 Chapt er 5. Debugging v oid* thread2 (void* d) { int count2 = 0; while(count2 < 1000){ printf("Thread 2: %d\n", count2++); } return NULL; } i nt main (){ pthread_create (& thread, NULL, thread2, NULL); pthread_create (& thread, NULL, thread3, NULL); //Thread 1 int count1 = 0; while(count1 < 1000){ printf("Thread 1: %d\n", count1++); } pthread_join(thread,NULL); return 0; } Compile this program in order to examine it under GD B. g cc -g three-threads.c -o three-threads g db ./three-threads -lpthread First set breakpoints on all thread functions; thread1, thread2, and main. ( gdb) break thread3 B reakpoint 1 at 0x4006c0: file three-threads.c, line 9. ( gdb) break thread2 B reakpoint 2 at 0x40070c: file three-threads.c, line 20. ( gdb) break main B reakpoint 3 at 0x40074a: file three-threads.c, line 30. Then run the program. ( gdb) run [...] B reakpoint 3, main () at three-threads.c:30 3 0 pthread_create (& thread, NULL, thread2, NULL); [...] ( gdb) info threads * 1 Thread 0x7ffff7fd5720 (LWP 4620) main () at three-threads.c:30 ( gdb) Note that the command i nfo thread s provides a summary of the program's threads and some details about their current state. In this case there is only one thread that has been created so far. 91 Red Hat Ent erprise Linux 6 Developer G uide Continue execution some more. ( gdb) next [New Thread 0x7ffff7fd3710 (LWP 4687)] 3 1 pthread_create (& thread, NULL, thread3, NULL); ( gdb) B reakpoint 2, thread2 (d=0x0) at three-threads.c:20 2 0 int count2 = 0; n ext [New Thread 0x7ffff75d2710 (LWP 4688)] 3 4 int count1 = 0; ( gdb) B reakpoint 1, thread3 (d=0x0) at three-threads.c:9 9 int count3 = 0; i nfo threads 3 Thread 0x7ffff75d2710 (LWP 4688) thread3 (d=0x0) at threethreads.c:9 2 Thread 0x7ffff7fd3710 (LWP 4687) thread2 (d=0x0) at threethreads.c:20 * 1 Thread 0x7ffff7fd5720 (LWP 4620) main () at three-threads.c:34 Here, two more threads are created. The star indicates the thread currently under focus. Also, the newly created threads have hit the breakpoint set for them in their initialization functions. Namely, thread2() and thread3(). To begin real thread debugging, use the thread <thread number> command to switch the focus to another thread. ( gdb) thread 2 [Switching to thread 2 (Thread 0x7ffff7fd3710 (LWP 4687))]#0 (d=0x0) at three-threads.c:20 2 0 int count2 = 0; ( gdb) list 15 return NULL; 16 } 17 18 void* thread2 (void* d) 19 { 2 0 int count2 = 0; 2 1 2 2 while(count2 < 1000){ 2 3 printf("Thread 2: %d\n", count2++); 2 4 } Thread 2 stopped at line 20 in its function thread2(). ( gdb) next 2 2 while(count2 < 1000){ ( gdb) print count2 $ 1 = 0 ( gdb) next 2 3 printf("Thread 2: %d\n", count2++); ( gdb) next 92 thread2 Chapt er 5. Debugging T hread 2: 0 2 2 while(count2 < 1000){ ( gdb) next 2 3 printf("Thread 2: %d\n", count2++); ( gdb) print count2 $ 2 = 1 ( gdb) info threads 3 Thread 0x7ffff75d2710 (LWP 4688) thread3 (d=0x0) at threethreads.c:9 * 2 Thread 0x7ffff7fd3710 (LWP 4687) thread2 (d=0x0) at threethreads.c:23 1 Thread 0x7ffff7fd5720 (LWP 4620) main () at three-threads.c:34 ( gdb) Above, a few lines of thread2 printed the counter count2 and left thread 2 at line 23 as is seen by the output of 'info threads'. Now thread3. ( gdb) thread 3 [Switching to thread 3 (Thread 0x7ffff75d2710 (LWP 4688))]#0 (d=0x0) at three-threads.c:9 9 int count3 = 0; ( gdb) list 4 5 pthread_t thread; 6 7 void* thread3 (void* d) 8 { 9 int count3 = 0; 10 11 while(count3 < 1000){ 12 sleep(10); 13 printf("Thread 3: %d\n", count3++); ( gdb) thread3 Thread three is a little different in that it has a sleep statement and executes slowly. Think of it as a representation of an uninteresting IO thread. Because this thread is uninteresting, continue its execution uninterrupted, using the co nti nue. ( gdb) continue & ( gdb) Thread 3: 0 T hread 3: 1 T hread 3: 2 T hread 3: 3 Take note of the & at the end of the co nti nue. This allows the GD B prompt to return so other commands can be executed. Using the i nterrupt, execution can be stopped should thread 3 become interesting again. ( gdb) interrupt [Thread 0x7ffff75d2710 (LWP 4688)] #3 stopped. 0 x000000343f4a6a6d in nanosleep () at ../sysdeps/unix/syscalltemplate.S:82 93 Red Hat Ent erprise Linux 6 Developer G uide 8 2 T_PSEUDO (SYSCALL_SYMBOL, SYSCALL_NAME, SYSCALL_NARGS) It is also possible to go back to the original main thread and examine it some more. ( gdb) thread 1 [Switching to thread 1 (Thread 0x7ffff7fd5720 (LWP 4620))]#0 main () at three-threads.c:34 3 4 int count1 = 0; ( gdb) next 3 6 while(count1 < 1000){ ( gdb) next 3 7 printf("Thread 1: %d\n", count1++); ( gdb) next T hread 1: 0 3 6 while(count1 < 1000){ ( gdb) next 3 7 printf("Thread 1: %d\n", count1++); ( gdb) next T hread 1: 1 3 6 while(count1 < 1000){ ( gdb) next 3 7 printf("Thread 1: %d\n", count1++); ( gdb) next T hread 1: 2 3 6 while(count1 < 1000){ ( gdb) print count1 $ 3 = 3 ( gdb) info threads 3 Thread 0x7ffff75d2710 (LWP 4688) 0x000000343f4a6a6d in nanosleep () at ../sysdeps/unix/syscall-template.S:82 2 Thread 0x7ffff7fd3710 (LWP 4687) thread2 (d=0x0) at threethreads.c:23 * 1 Thread 0x7ffff7fd5720 (LWP 4620) main () at three-threads.c:36 ( gdb) As can be seen from the output of info threads, the other threads are where they were left, unaffected by the debugging of thread 1. 5.3.6. Alt ernat ive User Int erfaces for GDB GD B uses the command line as its default interface. However, it also has an API called machine interface (MI). MI allows ID E developers to create other user interfaces to GD B. Some examples of these interfaces are: Eclip se ( C D T ) A graphical debugger interface integrated with the Eclipse development environment. More information can be found at the Eclipse website. N emiver A graphical debugger interface which is well suited to the GNOME D esktop Environment. More information can be found at the Nemiver website Emacs 94 Chapt er 5. Debugging A GD B interface which is integrated with the emacs. More information can be found at the Emacs website 5.3.7. GDB Document at ion For more detailed information about GD B, see the GD B manual: http://sources.redhat.com/gdb/current/onlinedocs/gdb.html Also, the commands i nfo g d b and man g d b will provide more concise information that is up to date with the installed version of gdb. 5.4 . Variable T racking at Assignment s Variable Tracking at Assignments (VTA) is a new infrastructure included in GCC used to improve variable tracking during optimizations. This allows GCC to produce more precise, meaningful, and useful debugging information for GD B, SystemTap, and other debugging tools. When GCC compiles code with optimizations enabled, variables are renamed, moved around, or even removed altogether. As such, optimized compiling can cause a debugger to report that some variables have been <optimized out>. With VTA enabled, optimized code is internally annotated to ensure that optimization passes to transparently keep track of each variable's value, regardless of whether the variable is moved or removed. The effect of this is more parameter and variable values available, even for the optimized (g cc -O 2 -g built) code. It also displays the <optimized out> message less. VTA's benefits are more pronounced when debugging applications with inlined functions. Without VTA, optimization could completely remove some arguments of an inlined function, preventing the debugger from inspecting its value. With VTA, optimization will still happen, and appropriate debugging information will be generated for any missing arguments. VTA is enabled by default when compiling code with optimizations and debugging information enabled (that is, g cc -O -g or, more commonly, g cc -O 2 -g ). To disable VTA during such builds, add the -fno -var-tracki ng -assi g nments. In addition, the VTA infrastructure includes the new g cc option -fco mpare-d ebug . This option tests code compiled by GCC with debug information and without debug information: the test passes if the two binaries are identical. This test ensures that executable code is not affected by any debugging options, which further ensures that there are no hidden bugs in the debug code. Note that -fco mpare-d ebug adds significant cost in compilation time. See man g cc for details about this option. For more information about the infrastructure and development of VTA, see A Plan to Fix Local Variable Debug Information in GCC, available at the following link: http://gcc.gnu.org/wiki/Var_Tracking_Assignments A slide deck version of this whitepaper is also available at http://people.redhat.com/aoliva/papers/vta/slides.pdf. 5.5. Pyt hon Pret t y-Print ers The GD B command pri nt outputs comprehensive debugging information for a target application. GD B aims to provide as much debugging data as it can to users; however, this means that for highly complex programs the amount of data can become very cryptic. 95 Red Hat Ent erprise Linux 6 Developer G uide In addition, GD B does not provide any tools that help decipher GD B pri nt output. GD B does not even empower users to easily create tools that can help decipher program data. This makes the practice of reading and understanding debugging data quite arcane, particularly for large, complex projects. For most developers, the only way to customize GD B pri nt output (and make it more meaningful) is to revise and recompile GD B. However, very few developers can actually do this. Further, this practice will not scale well, particularly if the developer must also debug other programs that are heterogeneous and contain equally complex debugging data. To address this, the Red Hat Enterprise Linux 6 version of GD B is now compatible with Python prettyprinters. This allows the retrieval of more meaningful debugging data by leaving the introspection, printing, and formatting logic to a third-party Python script. Compatibility with Python pretty-printers gives you the chance to truly customize GD B output as you see fit. This makes GD B a more viable debugging solution to a wider range of projects, since you now have the flexibility to adapt GD B output as required, and with greater ease. Further, developers with intimate knowledge of a project and a specific programming language are best qualified in deciding what kind of output is meaningful, allowing them to improve the usefulness of that output. The Python pretty-printers implementation allows users to automatically inspect, format, and print program data according to specification. These specifications are written as rules implemented via Python scripts. This offers the following benefits: Saf e To pass program data to a set of registered Python pretty-printers, the GD B development team added hooks to the GD B printing code. These hooks were implemented with safety in mind: the built-in GD B printing code is still intact, allowing it to serve as a default fallback printing logic. As such, if no specialized printers are available, GD B will still print debugging data the way it always did. This ensures that GD B is backwards-compatible; users who do not require pretty-printers can still continue using GD B. H ig h ly C u st o miz ab le This new " Python-scripted" approach allows users to distill as much knowledge as required into specific printers. As such, a project can have an entire library of printer scripts that parses program data in a unique manner specific to its user's requirements. There is no limit to the number of printers a user can build for a specific project; what's more, being able to customize debugging data script by script offers users an easier way to re-use and re-purpose printer scripts — or even a whole library of them. Easy t o Learn The best part about this approach is its lower barrier to entry. Python scripting is comparatively easy to learn and has a large library of free documentation available online. In addition, most programmers already have basic to intermediate experience in Python scripting, or in scripting in general. Here is a small example of a pretty printer. Consider the following C++ program: f ru it .cc e num Fruits {Orange, Apple, Banana}; c lass Fruit { 96 Chapt er 5. Debugging int fruit; public: Fruit (int f) { fruit = f; } } ; i nt main() { Fruit myFruit(Apple); return 0; // line 17 } This is compiled with the command g + + -g frui t. cc -o frui t. Now, examine this program with GD B. g db ./fruit [...] ( gdb) break 17 B reakpoint 1 at 0x40056d: file fruit.cc, line 17. ( gdb) run B reakpoint 1, main () at fruit.cc:17 17 return 0; // line 17 ( gdb) print myFruit $ 1 = {fruit = 1} The output of {frui t = 1} is correct because that is the internal representation of 'fruit' in the data structure 'Fruit'. However, this is not easily read by humans as it is difficult to tell which fruit the integer 1 represents. To solve this problem, write the following pretty printer: fruit.py c lass FruitPrinter: def __init__(self, val): self.val = val def to_string (self): fruit = self.val['fruit'] if (fruit == 0): name = "Orange" elif (fruit == 1): name = "Apple" elif (fruit == 2): name = "Banana" else: name = "unknown" return "Our fruit is " + name d ef lookup_type (val): if str(val.type) == 'Fruit': 97 Red Hat Ent erprise Linux 6 Developer G uide return FruitPrinter(val) return None g db.pretty_printers.append (lookup_type) Examine this printer from the bottom up. The line g d b. pretty_pri nters. append (l o o kup_type) adds the function l o o kup_type to GD B's list of printer lookup functions. The function l o o kup_type is responsible for examining the type of object to be printed, and returning an appropriate pretty printer. The object is passed by GD B in the parameter val. val . type is an attribute which represents the type of the pretty printer. Frui tP ri nter is where the actual work is done. More specifically in the to _stri ng function of that Class. In this function, the integer frui t is retrieved using the python dictionary syntax sel f. val [' frui t' ]. Then the name is determined using that value. The string returned by this function is the string that will be printed to the user. After creating frui t. py, it must then be loaded into GD B with the following command: (g d b) pytho n execfi l e("frui t. py") The GDB and Python Pretty-Printers whitepaper provides more details on this feature. This whitepaper also includes details and examples on how to write your own Python pretty-printer as well as how to import it into GD B. See the following link for more information: http://sourceware.org/gdb/onlinedocs/gdb/Pretty-Printing.html 5.6. Debugging C/C++ Applicat ions wit h Eclipse The Eclipse C/C++ development tools have excellent integration with the GNU D ebugger (GD B). These Eclipse plug-ins take advantage of the latest features available in GD B. Starting a debugging session for an application is similar to launching the application through either the context menu's D eb u g As → C /C + + Ap p licat io n , or using the R u n menu. The context menu can be accessed in one of three ways: Clicking the right mouse button with the cursor in the editor. On the application binary. On the project containing the binary of interest. If more than one binary can be launched, a dialog will be presented to choose which one. After the session has started, a prompt will appear to switch to the D ebug perspective, which contains the following collection of views related to debugging. C o n t ro l View The Control View is known as the D ebug view and has buttons for stepping over and into code selections. It also allows for thread process suspension. So u rce C o d e Ed it o r View 98 Chapt er 5. Debugging The Source Code Editor View reflects which source code lines correspond to the position of the debugger in the execution. By pressing the Instructi o n Steppi ng Mo d e button in the D ebug view toolbar, it is possible to control the execution of the application by assembly instruction instead of by source code line. C o n so le View The Console View displays the input and output that is available. Finally, variable data and other information can been found in the corresponding views in the D ebug perspective. For further details, see the C o n cep t s → D eb u g , G et t in g St art ed → D eb u g g in g Pro ject s, and T asks → R u n n in g an d D eb u g g in g Pro ject s sections of the C/C++ Development User Guide in the Help Contents. 99 Red Hat Ent erprise Linux 6 Developer G uide Chapter 6. Profiling D evelopers profile programs to focus attention on the areas of the program that have the largest impact on performance. The types of data collected include what section of the program consumes the most processor time, and where memory is allocated. Profiling collects data from the actual program execution. Thus, the quality of the data collect is influenced by the actual tasks being performed by the program. The tasks performed during profiling should be representative of actual use; this ensures that problems arising from realistic use of the program are addressed during development. Red Hat Enterprise Linux 6 includes a number of different tools (Valgrind, OProfile, perf, and SystemTap) to collect profiling data. Each tool is suitable for performing specific types of profile runs, as described in the following sections. 6.1. Valgrind Valg rin d is an instrumentation framework for building dynamic analysis tools that can be used to profile applications in detail. Valg rin d tools are generally used to automatically detect many memory management and threading problems. The Valg rin d suite also includes tools that allow the building of new profiling tools as required. Valg rin d provides instrumentation for user-space binaries to check for errors, such as the use of uninitialized memory, improper allocation/freeing of memory, and improper arguments for systemcalls. Its profiling tools can be used by normal users on most binaries; however, compared to other profilers, Valg rin d profile runs are significantly slower. To profile a binary, Valg rin d rewrites its executable and instruments the rewritten binary. Valg rin d 's tools are most useful for looking for memory-related issues in user-space programs; it is not suitable for debugging time-specific issues or kernel-space instrumentation/debugging. Previously, Valg rin d did not support IBM System z architecture. However, as of 6.1, this support has been added, meaning Valg rin d now supports all hardware architectures that are supported by Red Hat Enterprise Linux 6.x. 6.1.1. Valgrind T ools The Valg rin d suite is composed of the following tools: memch eck This tool detects memory management problems in programs by checking all reads from and writes to memory and intercepting all system calls to mal l o c, new, free, and d el ete. memch eck is perhaps the most used Valg rin d tool, as memory management problems can be difficult to detect using other means. Such problems often remain undetected for long periods, eventually causing crashes that are difficult to diagnose. cach eg rin d cach eg rin d is a cache profiler that accurately pinpoints sources of cache misses in code by performing a detailed simulation of the I1, D 1 and L2 caches in the CPU. It shows the number of cache misses, memory references, and instructions accruing to each line of source code; cach eg rin d also provides per-function, per-module, and whole-program summaries, and can even show counts for each individual machine instructions. callg rin d 100 Chapt er 6 . Profiling Like cacheg ri nd , cal l g ri nd can model cache behavior. However, the main purpose of cal l g ri nd is to record callgraphs data for the executed code. massif massif is a heap profiler; it measures how much heap memory a program uses, providing information on heap blocks, heap administration overheads, and stack sizes. Heap profilers are useful in finding ways to reduce heap memory usage. On systems that use virtual memory, programs with optimized heap memory usage are less likely to run out of memory, and may be faster as they require less paging. h elg rin d In programs that use the POSIX pthreads threading primitives, h elg rin d detects synchronization errors. Such errors are: Misuses of the POSIX pthreads API Potential deadlocks arising from lock ordering problems D ata races (that is, accessing memory without adequate locking) Valg rin d also allows you to develop your own profiling tools. In line with this, Valg rin d includes the l ackey tool, which is a sample that can be used as a template for generating your own tools. 6.1.2. Using Valgrind The val g ri nd package and its dependencies install all the necessary tools for performing a Valg rin d profile run. To profile a program with Valg rin d , use: val g ri nd --to o l = toolname program See Section 6.1.1, “ Valgrind Tools” for a list of arguments for toolname. In addition to the suite of Valg rin d tools, no ne is also a valid argument for toolname; this argument allows you to run a program under Valg rin d without performing any profiling. This is useful for debugging or benchmarking Valg rin d itself. You can also instruct Valg rin d to send all of its information to a specific file. To do so, use the option --l o g -fi l e= filename. For example, to check the memory usage of the executable file hel l o and send profile information to o utput, use: val g ri nd --to o l = memcheck --l o g -fi l e= o utput hel l o See Section 6.1.4, “ Valgrind D ocumentation” for more information on Valg rin d , along with other available documentation on the Valg rin d suite of tools. 6.1.3. Valgrind Plug-in for Eclipse The Valg rin d plug-in for Eclipse integrates several Valg rin d tools into Eclipse. This allows Eclipse users to seamlessly include profiling capabilities into their workflow. At present, the Valg rin d plug-in for Eclipse supports three Valg rin d tools: Memch eck Massif C ach eg rin d 101 Red Hat Ent erprise Linux 6 Developer G uide To launch a Valg rin d profile run, navigate to R u n > Pro f ile. This will open the Pro f ile As dialog, from which you can select a tool for a profile run. Fig u re 6 .1. Pro f ile As To configure each tool for a profile run, navigate to R u n > Pro f ile C o n f ig u rat io n . This will open the Pro f ile C o n f ig u rat io n menu. 102 Chapt er 6 . Profiling Fig u re 6 .2. Pro f ile C o n f ig u rat io n The Valg rin d plug-in for Eclipse is provided by the ecl i pse-val g ri nd package. For more information about this plug-in, see Valgrind Integration User Guide in the Eclipse H elp C o n t en t s. 6.1.4 . Valgrind Document at ion For more extensive information on Valg rin d , see man val g ri nd . Red Hat Enterprise Linux 6 also provides a comprehensive Valgrind Documentation book, available as PD F and HTML in: fi l e: ///usr/share/d o c/val g ri nd -version/val g ri nd _manual . pd f fi l e: ///usr/share/d o c/val g ri nd -version/html /i nd ex. html The Valgrind Integration User Guide in the Eclipse H elp C o n t en t salso provides detailed information on the setup and usage of the Valg rin d plug-in for Eclipse. This guide is provided by the ecl i pseval g ri nd package. 6.2. OProfile OProfile is a system-wide Linux profiler, capable of running at low overhead. It consists of a kernel driver and a daemon for collecting raw sample data, along with a suite of tools for parsing that data into meaningful information. OProfile is generally used by developers to determine which sections of code consume the most amount of CPU time, and why. D uring a profile run, OProfile uses the processor's performance monitoring hardware. Valg rin d rewrites the binary of an application, and in turn instruments it. OProfile, on the other hand,profiles a running application as-is. It sets up the performance monitoring hardware to take a sample every x 103 Red Hat Ent erprise Linux 6 Developer G uide number of events (for example, cache misses or branch instructions). Each sample also contains information on where it occurred in the program. OProfile's profiling methods consume less resources than Valg rin d . However, OProfile requires root privileges. OProfile is useful for finding " hot-spots" in code, and looking for their causes (for example, poor cache performance, branch mispredictions). Using OProfile involves starting the OProfile daemon (o pro fi l ed ), running the program to be profiled, collecting the system profile data, and parsing it into a more understandable format. OProfile provides several tools for every step of this process. 6.2.1. OProfile T ools The most useful OProfile commands include the following: o p co n t ro l This tool is used to start/stop the OProfile daemon and configure a profile session. o p rep o rt The o prepo rt command outputs binary image summaries, or per-symbol data, from OProfile profiling sessions. o p an n o t at e The o panno tate command outputs annotated source and/or assembly from the profile data of an OProfile session. o p arch ive The o parchi ve command generates a directory populated with executable, debug, and OProfile sample files. This directory can be moved to another machine (via tar), where it can be analyzed offline. o p g p ro f Like o prepo rt, the o pg pro f command outputs profile data for a given binary image from an OProfile session. The output of o pg pro f is in g pro f format. For a complete list of OProfile commands, see man o pro fi l e. For detailed information on each OProfile command, see its corresponding man page. See Section 6.2.4, “ OProfile D ocumentation” for other available documentation on OProfile. 6.2.2. Using OProfile The o pro fi l e package and its dependencies install all the necessary utilities for executing OProfile. To instruct OProfile to profile all the applications running on the system and to group the samples for the shared libraries with the application using the library, run the following command: # o pco ntro l --no -vml i nux --separate= l i brary --start You can also start the OProfile daemon without collecting system data. To do so, use the option -start-d aemo n. The --sto p option halts data collection, while --shutd o wn terminates the OProfile daemon. Use o prepo rt, o panno tate, or o pg pro f to display the collected profiling data. By default, the data collected by the OProfile daemon is stored in /var/l i b/o pro fi l e/sampl es/. 104 Chapt er 6 . Profiling O Pro f ile co n f lict wit h Perf o rman ce C o u n t ers f o r Lin u x ( PC L) t o o ls Both OProfile and Performance Counters for Linux (PCL) use the same hardware Performance Monitoring Unit (PMU). If the PCL or the NMI watchdog timer are using the hardware PMU, a message like the following occurs when starting OProfile: # opcontrol --start Using default event: CPU_CLK_UNHALTED:100000:0:1:1 Error: counter 0 not available nmi_watchdog using this resource ? Try: opcontrol --deinit echo 0 > /proc/sys/kernel/nmi_watchdog Stop any perf commands running on the system, then turn off the NMI watchdog and reload the OProfile kernel driver with the following commands: # o pco ntro l --d ei ni t # echo 0 > /pro c/sys/kernel /nmi _watchd o g 6.2.3. OProfile Plug-in For Eclipse The O Pro f ile suite of tools provide powerful call profiling capabilities; as a plug-in, these capabilities are well ported into the Eclipse user interface. The O Pro f ile Plug-in provides the following benefits: T arg et ed Pro f ilin g The O Pro f ile Plug-in will allow Eclipse users to profile a specific binary, include related shared libraries/kernel modules, and even exclude binaries. This produces very targeted, detailed usage results on each binary, function, and symbol, down to individual line numbers in the source code. U ser In t erf ace Fu lly In t eg rat ed in t o C D T The plug-in displays enriched O Pro f ile results through Eclipse, just like any other plug-in. D oubleclicking on a source line in the results brings users directly to the corresponding line in the Eclipse editor. This allows users to build, profile, and edit code through a single interface, making profiling a convenient experience for Eclipse users. In addition, profile runs are launched and configured the same way as C/C++ applications within Eclipse. Fu lly C u st o miz ab le Pro f ilin g O p t io n s The Eclipse interface allows users to configure their profile run using all options available in the O Pro f ile command line utility. The plug-in supports event configuration based on processor debugging registers (that is, counters), as well as interrupt-based profiling for kernels or processors that do not support hardware counters. Ease o f U se The O Pro f ile Plug-in provides generally useful defaults for all options, usable for a majority of profiling runs. In addition, it also features a " one-click profile" that executes a profile run using these defaults. Users can profile applications from start to finish, or select specific areas of code through a manual control dialog. To launch a Valg rin d profile run, navigate to R u n > Pro f ile. This will open the Pro f ile As dialog, from which you can select a tool for a profile run. 105 Red Hat Ent erprise Linux 6 Developer G uide Fig u re 6 .3. Pro f ile As To configure each tool for a profile run, navigate to R u n > Pro f ile C o n f ig u rat io n . This will open the Pro f ile C o n f ig u rat io n menu. 106 Chapt er 6 . Profiling Fig u re 6 .4 . Pro f ile C o n f ig u rat io n The OProfile plug-in for Eclipse is provided by the ecl i pse-o pro fi l e package. For more information about this plug-in, see OProfile Integration User Guide in the Eclipse H elp C o n t en t s (also provided by ecl i pse-pro fi l e). 6.2.4 . OProfile Document at ion For a more extensive information on OProfile, see man o pro fi l e. Red Hat Enterprise Linux 6 also provides two comprehensive guides to OProfile in fi l e: ///usr/share/d o c/o pro fi l e-version/: O Pro f ile Man u al A comprehensive manual with detailed instructions on the setup and use of OProfile is found at fi l e: ///usr/share/d o c/o pro fi l e-version/o pro fi l e. html O Pro f ile In t ern als D ocumentation on the internal workings of OProfile, useful for programmers interested in contributing to the OProfile upstream, can be found at fi l e: ///usr/share/d o c/o pro fi l e-version/i nternal s. html The OProfile Integration User Guide in the Eclipse H elp C o n t en t s also provides detailed information on the setup and usage of the OProfile plug-in for Eclipse. This guide is provided by the ecl i pseo pro fi l e package. 6.3. Syst emT ap 107 Red Hat Ent erprise Linux 6 Developer G uide SystemTap is a useful instrumentation platform for probing running processes and kernel activity on the Linux system. To execute a probe: 1. Write SystemTap scripts that specify which system events (for example, virtual file system reads, packet transmissions) should trigger specified actions (for example, print, parse, or otherwise manipulate data). 2. SystemTap translates the script into a C program, which it compiles into a kernel module. 3. SystemTap loads the kernel module to perform the actual probe. SystemTap scripts are useful for monitoring system operation and diagnosing system issues with minimal intrusion into the normal operation of the system. You can quickly instrument running system test hypotheses without having to recompile and re-install instrumented code. To compile a SystemTap script that probes kernel-space, SystemTap uses information from three different kernel information packages: kernel -variant-d evel -version kernel -variant-d ebug i nfo -version kernel -d ebug i nfo -co mmo n-arch-version Note The kernel information package in Red Hat Enterprise Linux 6 is now named kernel d ebug i nfo -co mmo n-arch-version. It was originally kernel -d ebug i nfo co mmo n-version in Red Hat Enterprise Linux 5. These kernel information packages must match the kernel to be probed. In addition, to compile SystemTap scripts for multiple kernels, the kernel information packages of each kernel must also be installed. An important new feature has been added as of Red Hat Enterprise Linux 6.1: the --remo te option. This allows users to build the SystemTap module locally, and then execute it remotely via SSH. The syntax to use this is --remo te [USER @ ]HO ST NAME; set the execution target to the specified SSH host, optionally using a different username. This option may be repeated to target multiple execution targets. Passes 1-4 are completed locally as normal to build the script, and then pass 5 copies the module to the target and runs it. The following sections describe other new SystemTap features available in the Red Hat Enterprise Linux 6 release. 6.3.1. Syst emT ap Compile Server SystemTap in Red Hat Enterprise Linux 6 supports a compile server and client deployment. With this setup, the kernel information packages of all client systems in the network are installed on just one compile server host (or a few). When a client system attempts to compile a kernel module from a SystemTap script, it remotely accesses the kernel information it requires from the centralized compile server host. A properly configured and maintained SystemTap compile server host offers the following benefits: The system administrator can verify the integrity of kernel information packages before making the packages available to users. 108 Chapt er 6 . Profiling The identity of a compile server can be authenticated using the Secure Socket Layer (SSL). SSL provides an encrypted network connection that prevents eavesdropping or tampering during transmission. Individual users can run their own servers and authorize them for their own use as trusted. System administrators can authorize one or more servers on the network as trusted for use by all users. A server that has not been explicitly authorized is ignored, preventing any server impersonations and similar attacks. 6.3.2. Syst emT ap Support for Unprivileged Users For security purposes, users in an enterprise setting are rarely given privileged (that is, root or sud o ) access to their own machines. In addition, full SystemTap functionality should also be restricted to privileged users, as this can provide the ability to completely take control of a system. SystemTap in Red Hat Enterprise Linux 6 features a new option to the SystemTap client: -unpri vi l eg ed . This option allows an unprivileged user to run stap. Of course, several restrictions apply to unprivileged users that attempt to run stap. Note An unprivileged user is a member of the group stapusr but is not a member of the group stapd ev (and is not root). Before loading any kernel modules created by unprivileged users, SystemTap verifies the integrity of the module using standard digital (cryptographic) signing techniques. Each time the -unpri vi l eg ed option is used, the server checks the script against the constraints imposed for unprivileged users. If the checks are successful, the server compiles the script and signs the resulting module using a self-generated certificate. When the client attempts to load the module, staprun first verifies the signature of the module by checking it against a database of trusted signing certificates maintained and authorized by root. Once a signed kernel module is successfully verified, staprun is assured that: The module was created using a trusted systemtap server implementation. The module was compiled using the --unpri vi l eg ed option. The module meets the restrictions required for use by an unprivileged user. The module has not been tampered with since it was created. 6.3.3. SSL and Cert ificat e Management SystemTap in Red Hat Enterprise Linux 6 implements authentication and security via certificates and public/private key pairs. It is the responsibility of the system administrator to add the credentials (that is, certificates) of compile servers to a database of trusted servers. SystemTap uses this database to verify the identity of a compile server that the client attempts to access. Likewise, SystemTap also uses this method to verify kernel modules created by compile servers using the --unpri vi l eg ed option. 6 .3.3.1 . Aut ho rizing Co m pile Se rve rs fo r Co nne ct io n 109 Red Hat Ent erprise Linux 6 Developer G uide The first time a compile server is started on a server host, the compile server automatically generates a certificate. This certificate verifies the compile server's identity during SSL authentication and module signing. In order for clients to access the compile server (whether on the same server host or from a client machine), the system administrator must add the compile server's certificate to a database of trusted servers. Each client host intending to use compile servers maintains such a database. This allows individual users to customize their database of trusted servers, which can include a list of compile servers authorized for their own use only. 6 .3.3.2 . Aut ho rizing Co m pile Se rve rs fo r Mo dule Signing (fo r Unprivile ge d Use rs) Unprivileged users can only load signed, authorized SystemTap kernel modules. For modules to be recognized as such, they have to be created by a compile server whose certificate appears in a database of trusted signers; this database must be maintained on each host where the module will be loaded. 6 .3.3.3. Aut o m at ic Aut ho rizat io n Servers started using the stap-server initscript are automatically authorized to receive connections from all clients on the same host. Servers started by other means are automatically authorized to receive connections from clients on the same host run by the user who started the server. This was implemented with convenience in mind; users are automatically authorized to connect to a server they started themselves, provided that both client and server are running on the same host. Whenever root starts a compile server, all clients running on the same host automatically recognize the server as authorized. However, Red Hat advises that you refrain from doing so. Similarly, a compile server initiated through stap-server is automatically authorized as a trusted signer on the host in which it runs. If the compile server was initiated through other means, it is not automatically authorized as such. 6.3.4 . Syst emT ap Document at ion For more detailed information about SystemTap, see the following books (also provided by Red Hat): SystemTap Beginner's Guide SystemTap Tapset Reference SystemTap Language Reference (documentation supplied by IBM) The SystemTap Beginner's Guide and SystemTap Tapset Reference are also available locally when you install the systemtap package: fi l e: ///usr/share/d o c/systemtap-version/SystemT ap_Beg i nners_G ui d e/i nd ex. html fi l e: ///usr/share/d o c/systemtap-version/SystemT ap_Beg i nners_G ui d e. pd f fi l e: ///usr/share/d o c/systemtap-version/tapsets/i nd ex. html fi l e: ///usr/share/d o c/systemtap-version/tapsets. pd f Section 6.3.1, “ SystemTap Compile Server” , Section 6.3.2, “ SystemTap Support for Unprivileged Users” , and Section 6.3.3, “ SSL and Certificate Management” are all excerpts from the SystemTap 110 Chapt er 6 . Profiling Support for Unprivileged Users and Server Client Deployment whitepaper. This whitepaper also provides more details on each feature, along with a case study to help illustrate their application in a realworld environment. 6.4 . Performance Count ers for Linux (PCL) T ools and perf Performance Counters for Linux (PCL) is a new kernel-based subsystem that provides a framework for collecting and analyzing performance data. These events will vary based on the performance monitoring hardware and the software configuration of the system. Red Hat Enterprise Linux 6 includes this kernel subsystem to collect data and the user-space tool perf to analyze the collected performance data. The PCL subsystem can be used to measure hardware events, including retired instructions and processor clock cycles. It can also measure software events, including major page faults and context switches. For example, PCL counters can compute the Instructions Per Clock (IPC) from a process's counts of instructions retired and processor clock cycles. A low IPC ratio indicates the code makes poor use of the CPU. Other hardware events can also be used to diagnose poor CPU performance. Performance counters can also be configured to record samples. The relative frequency of samples can be used to identify which regions of code have the greatest impact on performance. 6.4 .1. Perf T ool Commands Useful perf commands include the following: p erf st at This perf command provides overall statistics for common performance events, including instructions executed and clock cycles consumed. Options allow selection of events other than the default measurement events. p erf reco rd This perf command records performance data into a file which can be later analyzed using perf repo rt. p erf rep o rt This perf command reads the performance data from a file and analyzes the recorded data. p erf list This perf command lists the events available on a particular machine. These events will vary based on the performance monitoring hardware and the software configuration of the system. Use perf hel p to obtain a complete list of perf commands. To retrieve man page information on each perf command, use perf hel p command. 6.4 .2. Using Perf Using the basic PCL infrastructure for collecting statistics or samples of program execution is relatively straightforward. This section provides simple examples of overall statistics and sampling. To collect statistics on make and its children, use the following command: 111 Red Hat Ent erprise Linux 6 Developer G uide # perf stat -- make al l The perf command collects a number of different hardware and software counters. It then prints the following information: Performance counter stats for 'make all': 244011.782059 task-clock-msecs 53328 context-switches 515 CPU-migrations 1843121 page-faults 789702529782 cycles 1050912611378 instructions 275538938708 branches 2888756216 branch-misses 4343060367 cache-references 428257037 cache-misses 263.779192511 # # # # # # # # # # 0.925 CPUs 0.000 M/sec 0.000 M/sec 0.008 M/sec 3236.330 M/sec 1.331 IPC 1129.203 M/sec 1.048 % 17.799 M/sec 1.755 M/sec seconds time elapsed The perf tool can also record samples. For example, to record data on the make command and its children, use: # perf reco rd -- make al l This prints out the file in which the samples are stored, along with the number of samples collected: [ perf record: Woken up 42 times to write data ] [ perf record: Captured and wrote 9.753 MB perf.data (~426109 samples) ] As of Red Hat Enterprise Linux 6.4, a new functionality to the {} group syntax has been added that allows the creation of event groups based on the way they are specified on the command line. The current --g ro up or -g options remain the same; if it is specified for record, stat, or top command, all the specified events become members of a single group with the first event as a group leader. The new {} group syntax allows the creation of a group like: # perf reco rd -e ' {cycles, faults}' l s The above results in a single event group containing cycles and faults events, with the cycles event as the group leader. All groups are created with regards to threads and CPUs. As such, recording an event group within two threads on a server with four CPUs will create eight separate groups. It is possible to use a standard event modifier for a group. This spans over all events in the group and updates each event modifier settings. # perf reco rd -r ' {faults:k,cache-references}: p' The above command results in the : kp modifier being used for faults, and the : p modifier being used for the cache-references event. 112 Chapt er 6 . Profiling Perf o rman ce C o u n t ers f o r Lin u x ( PC L) T o o ls co n f lict wit h O Pro f ile Both OProfile and Performance Counters for Linux (PCL) use the same hardware Performance Monitoring Unit (PMU). If OProfile is currently running while attempting to use the PCL perf command, an error message like the following occurs when starting OProfile: Error: open_counter returned with 16 (Device or resource busy). /bin/dmesg may provide additional information. Fatal: Not all events could be opened. To use the perf command, first shut down OProfile: # o pco ntro l --d ei ni t You can then analyze perf. d ata to determine the relative frequency of samples. The report output includes the command, object, and function for the samples. Use perf repo rt to output an analysis of perf. d ata. For example, the following command produces a report of the executable that consumes the most time: # perf repo rt --so rt= co mm The resulting output: # Samples: 1083783860000 # # Overhead Command # ........ ............... # 48.19% xsltproc 44.48% pdfxmltex 6.01% make 0.95% perl 0.17% kernel-doc 0.05% xmllint 0.05% cc1 0.03% cp 0.01% xmlto 0.01% sh 0.01% docproc 0.01% ld 0.01% gcc 0.00% rm 0.00% sed 0.00% git-diff-files 0.00% bash 0.00% git-diff-index The column on the left shows the relative frequency of the samples. This output shows that make spends most of this time in xsl tpro c and the pd fxml tex. To reduce the time for the make to complete, focus on xsl tpro c and pd fxml tex. To list the functions executed by xsl tpro c, run: # perf repo rt -n --co mm= xsl tpro c 113 Red Hat Ent erprise Linux 6 Developer G uide This generates: comm: xsltproc # Samples: 472520675377 # # Overhead Samples Shared Object # ........ .......... ............................. # 45.54%215179861044 libxml2.so.2.7.6 xmlXPathCmpNodesExt 11.63%54959620202 libxml2.so.2.7.6 xmlXPathNodeSetAdd__internal_alias 8.60%40634845107 libxml2.so.2.7.6 xmlXPathCompOpEval 4.63%21864091080 libxml2.so.2.7.6 xmlXPathReleaseObject 2.73%12919672281 libxml2.so.2.7.6 xmlXPathNodeSetSort__internal_alias 2.60%12271959697 libxml2.so.2.7.6 2.41%11379910918 libxml2.so.2.7.6 xmlXPathIsNaN__internal_alias 2.19%10340901937 libxml2.so.2.7.6 valuePush__internal_alias Symbol ...... [.] [.] [.] [.] [.] [.] valuePop [.] [.] 6.5. ft race The ftrace framework provides users with several tracing capabilities, accessible through an interface much simpler than SystemTap's. This framework uses a set of virtual files in the d ebug fs file system; these files enable specific tracers. The ftrace function tracer outputs each function called in the kernel in real time; other tracers within the ftrace framework can also be used to analyze wakeup latency, task switches, kernel events, and the like. You can also add new tracers for ftrace, making it a flexible solution for analyzing kernel events. The ftrace framework is useful for debugging or analyzing latencies and performance issues that take place outside of user-space. Unlike other profilers documented in this guide, ftrace is a built-in feature of the kernel. 6.5.1. Using ft race The Red Hat Enterprise Linux 6 kernels have been configured with the C O NFIG _FT R AC E= y option. This option provides the interfaces required by ftrace. To use ftrace, mount the d ebug fs file system as follows: mo unt -t d ebug fs no d ev /sys/kernel /d ebug All the ftrace utilities are located in /sys/kernel /d ebug /traci ng /. View the /sys/kernel /d ebug /traci ng /avai l abl e_tracers file to find out what tracers are available for your kernel: cat /sys/kernel /d ebug /traci ng /avai l abl e_tracers power wakeup irqsoff function sysprof sched_switch initcall nop 114 Chapt er 6 . Profiling To use a specific tracer, write it to /sys/kernel /d ebug /traci ng /current_tracer. For example, wakeup traces and records the maximum time it takes for the highest-priority task to be scheduled after the task wakes up. To use it: echo wakeup > /sys/kernel /d ebug /traci ng /current_tracer To start or stop tracing, write to /sys/kernel /d ebug /traci ng /traci ng _o n, as in: echo 1 > /sys/kernel /d ebug /traci ng /traci ng _o n (enables tracing) echo 0 > /sys/kernel /d ebug /traci ng /traci ng _o n (disables tracing) The results of the trace can be viewed from the following files: /sys/kern el/d eb u g /t racin g /t race This file contains human-readable trace output. /sys/kern el/d eb u g /t racin g /t race_p ip e This file contains the same output as /sys/kernel /d ebug /traci ng /trace, but is meant to be piped into a command. Unlike /sys/kernel /d ebug /traci ng /trace, reading from this file consumes its output. 6.5.2. ft race Document at ion The ftrace framework is fully documented in the following files: ftrace - Function Tracer: fi l e: ///usr/share/d o c/kernel d o c-version/D o cumentati o n/trace/ftrace. txt function tracer guts: fi l e: ///usr/share/d o c/kernel d o c-version/D o cumentati o n/trace/ftrace-d esi g n. txt 115 Red Hat Ent erprise Linux 6 Developer G uide Chapter 7. Red Hat Developer Toolset 7.1. What is Red Hat Developer T oolset ? Red Hat D eveloper Toolset is a Red Hat offering for developers on the Red Hat Enterprise Linux platform, and provides a complete set of development and performance analysis tools that can be installed and used on multiple versions of Red Hat Enterprise Linux. Executables built with the Red Hat D eveloper Toolset toolchain can then also be deployed and run on multiple versions of Red Hat Enterprise Linux. Red Hat D eveloper Toolset does not replace the default system tools and libraries provided with Red Hat Enterprise Linux 6 when installed on this platform. Instead, a parallel set of developer tools provides an alternative, newer version of those tools for optional use by developers. Applications and libraries provided by Red Hat D eveloper Toolset do not replace the Red Hat Enterprise Linux system versions, nor are they used in preference to the system versions. The default compiler and debugger, for example, remain those provided by the base Red Hat Enterprise Linux system. D evelopers can pick and choose at any time which version of the tool they would like to use by using the scl utility. For details on how to install the product and invoke the executables, see the Red Hat Developer Toolset 2.1 User Guide. 7.2. What Does Red Hat Developer T oolset Offer? In comparison with Red Hat Enterprise Linux 6, Red Hat D eveloper Toolset provides more recent versions of the Eclip se development environment, G N U C o mp iler C o llect io n (GCC), G N U D eb u g g er (GD B), and other development and performance analysis tools as listed in Table 7.1, “ Red Hat D eveloper Toolset Components” . These updated tools allow developers to develop applications while using experimental C++14 language features, the latest compiler optimizations, parallel programming with OpenMP 4.0, and improved debugging support. T ab le 7.1. R ed H at D evelo p er T o o lset C o mp o n en t s N ame Versio n D escrip t io n Eclipse 4.4 An integrated development environment with a graphical user interface. [a] GCC binutils 4.9.1 2.24 elfutils 0.159 dwz 0.11 GD B 7.8 ltrace 0.7.91 strace 4.8 memstomp 0.1.5 A portable compiler suite with support for C, C++, and Fortran. A collection of binary tools and other utilities to inspect and manipulate object files and binaries. A collection of binary tools and other utilities to inspect and manipulate ELF files. A tool to optimize D WARF debugging information contained in ELF shared libraries and ELF executables for size. A command line debugger for programs written in C, C++, and Fortran. A debugging tool to display calls to dynamic libraries that a program makes. It can also monitor system calls executed by programs. A debugging tool to monitor system calls that a program uses and signals it receives. A debugging tool to identify calls to library functions with overlapping memory regions that are not allowed by various standards. 116 Chapt er 7 . Red Hat Developer T oolset N ame Versio n D escrip t io n SystemTap 2.5 Valgrind 3.9.0 OProfile 0.9.9 D yninst 8.2 A tracing and probing tool to monitor the activities of the entire system without the need to instrument, recompile, install, and reboot. An instrumentation framework and a number of tools to profile applications in order to detect memory errors, identify memory management problems, and report any use of improper arguments in system calls. A system-wide profiler that uses the performance monitoring hardware on the processor to retrieve information about the kernel and executables on the system. A library for instrumenting and working with user-space executables during their execution. [a] If yo u intend to d evelo p ap p lic atio ns fo r Red Hat JBo s s Mid d leware o r req uire s up p o rt fo r O p enShift To o ls , it is rec o mmend ed that yo u us e Red Hat JBo s s Develo p er Stud io . 7.3. Plat form Compat ibilit y Red Hat D eveloper Toolset 3.0 is available for Red Hat Enterprise Linux 6 and 7 for 64-bit Intel and AMD architectures. Figure 7.1, “ Red Hat D eveloper Toolset 3.0 Compatibility Matrix” illustrates the support for binaries built with Red Hat D eveloper Toolset on a certain version of Red Hat Enterprise Linux when those binaries are run on various other versions of this system. For ABI compatibility information, see the ABI Compatibility section of the Red Hat Developer Toolset 3.0 Beta User Guide. Fig u re 7.1. R ed H at D evelo p er T o o lset 3.0 C o mp at ib ilit y Mat rix 7.4 . Addit ional Resources For more information about Red Hat D eveloper Toolset, see the resources listed below. Red Hat D eveloper Toolset 3.0 Beta Release Notes — The Release Notes for Red Hat D eveloper Toolset 3.0 Beta provide important information available at the time of its release. Read this book to learn about system requirements or known problems of the product. 117 Red Hat Ent erprise Linux 6 Developer G uide Red Hat D eveloper Toolset 3.0 Beta User Guide — The User Guide for Red Hat D eveloper Toolset 3.0 Beta provides an overview of the product, explains how to invoke and use the Red Hat D eveloper Toolset versions of the tools, and links to resources with more in-depth information. Read this book to learn how to obtain, install, and use Red Hat D eveloper Toolset on your system, or for a detailed list of changes in this product. 118 Chapt er 8 . Red Hat Soft ware Collect ions Chapter 8. Red Hat Software Collections 8.1. What is Red Hat Soft ware Collect ions? For certain applications, more recent versions of some software components are often needed in order to use their latest features. Red Hat Software Collections is a Red Hat offering that provides a set of dynamic programming languages, database servers, and related packages that are either more recent than their equivalent versions included in the base Red Hat Enterprise Linux system, or are available for this system for the first time. D ynamic languages, database servers, and other tools distributed with Red Hat Software Collections do not replace the default system tools provided with Red Hat Enterprise Linux 6, nor are they used in preference to these tools. The default versions of Perl and Po st g reSQ L, for example, remain those provided by the base Red Hat Enterprise Linux system. Users can pick and choose at any time which version of the tool they would like to run by using the scl utility. With the notable exception of N o d e.js, all Red Hat Software Collections components are fully supported under Red Hat Enterprise Linux Subscription Level Agreements, are functionally complete, and are intended for production use. Red Hat D eveloper Toolset is now a part of Red Hat Software Collections, included as a separate Software Collection. For more information about Red Hat D eveloper Toolset, see the Red Hat D eveloper Toolset Release Notes and the Red Hat D eveloper Toolset User Guide. 8.2. What Does Red Hat Soft ware Collect ions Offer? Red Hat Software Collections 1.2 provides recent versions of the tools listed in Table 8.1, “ 6 Components” . T ab le 8.1. 6 C o mp o n en t s C o mp o n en t So f t ware C o llec D escrip t io n t io n R ed H at D evelo p er T o o lset 3.0 devtoolset-3 Perl 5.16 .3 perl516 Red Hat D eveloper Toolset is designed for developers on the Red_Hat_Enterprise_Linux platform. It provides current versions of the G N U C o mp iler C o llect io n , G N U D eb u g g er, Eclip se development platform, and other development, debugging, and performance monitoring tools. For a complete list of components, see the Red Hat D eveloper Toolset Components table in the Red Hat Developer Toolset User Guide. A release of Perl with a number of additional utilities, scripts, and database connectors for MySQL and PostgreSQL. This version provides a large number of new features and enhancements, including new debugging options, improved Unicode support, and better performance. Also, it adds p erl- D at eT ime and mo d _p erl, which is supported only with the httpd24 Software Collection package. 119 Red Hat Ent erprise Linux 6 Developer G uide C o mp o n en t So f t ware C o llec D escrip t io n t io n PH P 5.4 .16 php54 PH P 5.5.6 php55 Pyt h o n 2.7.5 python27 Pyt h o n 3.3.2 python33 R u b y 1.9 .3 [a] ruby193 R u b y 2.0.0 ruby200 Ruby on ror40 R ails 4 .0.2 [a] 120 A release of PHP with PEAR 1.9 .4 and a number of additional extensions. PHP 5.4 provides a number of language and interface improvements. The APC , memcach e, and Z en d O Pcach e extensions are also included. A release of PHP with enhanced language features including better exception handling, generators, and Z en d O Pcach e. The memcach e and mo n g o d b extensions are also included. A release of Python 2.7 with a number of additional utilities. This Python version provides various new features and enhancements, including a new ordered dictionary type, faster I/O operations, and improved forward compatibility with Python 3. The python27 Software Collections contains the Python 2.7.5 interpreter, a set of extension libraries useful for programming web applications and mo d _wsg i (only supported with the httpd24 Software Collection), MySQL and PostgreSQL database connectors, and n u mp y and scip y. A release of Python 3 with a number of additional utilities. This Software Collection gives developers on Red_Hat_Enterprise_Linux access to Python 3 and allows them to benefit from various advantages and new features of this version. The python33 Software Collection contains Python 3.3.2 interpreter, a set of extension libraries useful for programming web applications and mo d _wsg i (only supported with the httpd24 Software Collection), PostgreSQL database connector, and n u mp y and scip y. A release of Ruby 1.9.3 and R u b y o n R ails 3.2.8 with a large collection of Ruby gems. This Software Collection gives developers on Red_Hat_Enterprise_Linux access to Ruby 1.9, which provides a number of new features and enhancements, including improved Unicode support, enhanced threading, faster load times, and mo d _p assen g er, which is supported only with the httpd24 Software Collection package. A release of Ruby 2.0.0. This version provides substantial performance and reliability improvements and includes a number of new features and improved debugging capabilities, while maintaining source level backward compatibility with Ruby 1.9.3. A release of R u b y o n R ails 4 .0, a web application development framework written in the Ruby language. This version provides a number of new features and improvements and adds live streaming for persistent connections. This Software Collection is supported together with the ruby200 collection. Chapt er 8 . Red Hat Soft ware Collect ions C o mp o n en t So f t ware C o llec D escrip t io n t io n MariaD B 5.5.37 mariadb55 Mo n g o D B 2.4 .9 mongodb24 [b ] MySQ L 5.5.37 mysql55 Po st g reSQ L 9 .2.8 postgresql92 N o d e.js 0.10 [b ] [c ] nodejs010 n g in x 1.6 .1 nginx16 Ap ach e h t t p d 2.4 .6 httpd24 T h ermo st at 1.0.4 thermostat1 G it 1.9 .4 git19 D evAssist an t 0.9 .1 devassist09 A release of MariaD B, an alternative to MySQL for users of Red_Hat_Enterprise_Linux. MySQL is binary compatible with MariaD B and can be replaced with it without any data conversions. This version adds the PAM authentication plugin to MariaD B. A release of MongoD B, a cross-platform documentoriented database system classified as a NoSQL database. This Software Collection includes the mongo-java-driver package. A release of MySQL, which provides a number of new features and enhancements, including improved performance. A release of PostgreSQL, which provides a number of new features and enhancements, including cascading replication, native JSON support, improved scalability, and better performance. A release of Node.js with n p m 1.3.24 . This Software Collection gives users of Red_Hat_Enterprise_Linux access to this programming platform. A release of nginx, a web and proxy server with a focus on high concurrency, performance and low memory usage. This versions introduces a number of new features, including various SSL improvements, support for SPDY 3.1, cache revalidation with conditional requests, and authentication request module. A release of the Apache HTTP Server (httpd), including a high performance event-based processing model, enhanced SSL module and FastCGI support. The mo d _au t h _kerb module is also included. A release of Thermostat, a monitoring and instrumentation tool for the OpenJDK HotSpot JVM, with support for monitoring multiple JVM instances. This Software Collection depends on the mongodb24 component. A release of Git, a distributed revision control system with a peer-to-peer architecture. As opposed to centralized version control systems with a client-server model, Git ensures that each working copy of a Git repository is its exact copy with complete revision history. A release of D evAssistant, a tool designed to assist developers with creating and setting up basic projects in various programming languages, installing dependencies, setting up a development environment, and working with source control. D evAssistant supports the C, C++, Java, and Python programming languages but it is able to support working with any other language, framework, or tool due to its modular architecture. 121 Red Hat Ent erprise Linux 6 Developer G uide C o mp o n en t So f t ware C o llec D escrip t io n t io n Maven 3.0.5 maven30 A release of Maven, a software project management and comprehension tool used primarily for Java projects. Based on the concept of a project object model (POM), Maven can manage a project's build, reporting, and documentation from a central piece of information. [a] A p art o f this So ftware Co llec tio n req uires a JavaSc rip t eng ine. The v8314 So ftware Co llec tio n inc lud ed in 6 p ro vid es the V8 JavaSc rip t eng ine and is s up p o rted o nly as the So ftware Co llec tio n' s d ep end enc y. [b ] This So ftware Co llec tio n als o req uires v8 31 4 . The v8314 So ftware Co llec tio n inc lud ed in 6 p ro vid es the V8 JavaSc rip t eng ine and is s up p o rted o nly as the So ftware Co llec tio n' s d ep end enc y. [c ] In 6 , Node.js is inc lud ed as a Tec hno lo g y Preview. Fo r mo re info rmatio n ab o ut Red Hat Tec hno lo g y Previews , s ee http s ://ac c es s .red hat.c o m/s up p o rt/o ffering s /tec hp review/. 8.3. Which Plat forms Are Support ed? Red Hat Software Collections 1.2 is available for all supported releases of Red Hat Enterprise Linux 6 on AMD 64 and Intel 64 architectures. 8.4 . How t o Use Red Hat Soft ware Collect ions? To run an executable from a particular Software Collection, type the following command at a shell prompt: scl enabl e software_collection. . . ' command. . . ' Replace software_collection with a space-separated list of Software Collections you want to use and command with the command you want to run. For example, to execute a Perl program stored in a file named hel l o . pl with the Perl interpreter from the perl516 Software Collection, type: ~]$ scl enabl e perl 516 ' perl hel l o . pl ' Hello, World! To start a new shell session with executables from a selected Software Collection in preference to their Red Hat Enterprise Linux equivalents, type the following at a shell prompt: scl enabl e software_collection. . . bash Replace software_collection with a space-separated list of Software Collections you want to use. For example, to start a new shell session with the python27 and postgresql92 Software Collections as default, type: ~]$ scl enabl e pytho n27 po stg resq l 9 2 bash The list of Software Collections that are enabled in the current session is stored in the $X_SC LS environment variable, for instance: ~]$ echo $X_SC LS python27 postgresql92 122 Chapt er 8 . Red Hat Soft ware Collect ions You can execute any command using the scl utility, causing it to be run with the executables from a selected Software Collection in preference to their possible Red Hat Enterprise Linux system equivalents. See Section 4.7, “ Software Collections and scl-utils” for more information on how to install and use this command line utility on your system. For a complete list of Software Collections that are distributed with Red Hat Software Collections, see Table 8.1, “ 6 Components” . For detailed instructions on how to use these Software Collections, see the Red Hat Software Collections 1.1 Release Notes. 8.5. How t o Deploy Applicat ions T hat Use Red Hat Soft ware Collect ions? In general, you can use one of the following two approaches to deploy an application that depends on a component from Red Hat Software Collections in production: install all required Software Collections and packages manually and then deploy your application, or create a new Software Collection for your application and specify all required Software Collections and other packages as dependencies. For more information on how to manually install individual Red Hat Software Collections components, see the Red Hat Software Collections 1.2 Beta Release Notes. For a detailed explanation of how to create a custom Software Collection, read the Red Hat Developer Toolset Software Collections Guide. 8.6. Addit ional Resources Red Hat Software Collections 1.2 Beta Release Notes — The Release Notes for Red Hat Software Collections 1.2 Beta provides important information available at the time of its release. Read this book if you want to learn about system requirements or known problems of Red Hat Software Collections. Red Hat Software Collections 1.2 Beta Packaging Guide — The Packaging Guide for Red Hat Software Collections 1.2 Beta provides instructions on how to build custom Software Collections. 123 Red Hat Ent erprise Linux 6 Developer G uide Chapter 9. Documentation Tools Red Hat Enterprise Linux 6 has two documentation tools available to include documentation with a project. These are Pu b lican and D o xyg en . 9.1. Publican Publican a program is used to publish and process documentation through D ocBook XML. In the process of publishing books, it checks the XML to ensure it is valid and in a publishable standard. It is particularly useful for publishing the documentation accompanying a newly created application. 9.1.1. Commands Publican has a vast number of commands and actions available, all of which can be found in the -hel p or --man pages. The most common ones are: bui l d Converts the XML files into other formats more suitable for documentation (PD F, HTML, HTML-single, for example). create Creates a new book, including all the required files as discussed in Section 9.1.3, “ Files” . create_brand Creates a new brand, allowing all books to look the same, as discussed in Section 9.1.6, “ Brands” . packag e Packages the files of a book into an RPM ready to distribute. 9.1.2. Creat e a New Document Use the publ i can create command to create a new document including all the required files. There are a number of options available to append to the publ i can create. These are: --hel p Prints a list of accepted options for the publ i can create command. --name Doc_Name Set the name of the book. Keep in mind that the title must contain no spaces. --l ang Language_Code If this is not set, the default is en-US. The --l ang option sets the xml _l ang in the publ i can. cfg file and creates a directory with this name in the document directory. --versi o n version Set the version number of the product the book is about. 124 Chapt er 9 . Document at ion T ools --pro d uct Product_Name Set the name of the product the book is about. Keep in mind that this must contain no spaces. --brand brand Set the name of a brand to use to keep the look of the documents consistent. See --hel p for more options. Remember to change into the directory the book is to be created in before running publ i can create. This prevents the files and directories be added to the user's home directory. 9.1.3. Files When a book is made, a number of files are created in the book's directory. These files are required for the book to be built properly and should not be deleted. They are, however, required to be edited for links (such as chapters) to work, as well as to contain the correct information regarding authors and titles etc. These files are: publ i can. cfg This file configures the build options and always includes the parameters xml_lang (the language the book is in, en-US for example), type (the type of document, a book or a set, for example), and brand (the branding the document uses, found here: Section 9.1.6, “ Brands” . Red Hat, for example.). There are a number of optional parameters but these should be used cautiously as they can cause problems further on in areas like translation. A full list of these advanced parameters can be found in the Publican User Guide. The publ i can. cfg file is unlikely to be edited much beyond the initial creation. bo o k_i nfo . xml This file is the template of the book. It contains information such as the title, subtitle, author, publication number, and the book's ID number. It also contains the basic Publican information printed at the beginning of each publication with information on the notes, cautions, and warnings as well as a basic stylistic guide. This file will be edited often as every time a book is updated the publication number has to be incremented. Autho r_G ro up. xml This file is used to store information about the authors and contributors. Once initially set up it is unlikely further editing will be required unless a change of authorship occurs. C hapter. xml This file is an example of what the actual content will be. It is created as a place holder but unless it is linked in the Doc_Name.xml (below) it will not appear in the actual book. When writing content for the publication, new XML files are created, named appropriately (chpublican.xml, for example) and linked in D o c_Name. xml . When the book is built, the content of this file will form the content of the book. This specific file is unlikely to ever be edited but others like it will be edited constantly as content is changed, updated, added to or removed. Doc_Name. xml This file is the contents page of the publication. It contains a list of links to the various chapters a book is to contain. It will not actually be called 'D oc_Name' but will have whatever the title of the publication is in it's place (D eveloper_Guide.xml, for example). This 125 Red Hat Ent erprise Linux 6 Developer G uide will only be edited when new chapters are added, removed or rearranged. This must remain the same as Doc_Name. ent or the book will not build. Doc_Name. ent This file contains a list of local entities. By default YEAR is set to the current year and HOLDER has a reminder to place the copyright owner's name there. As with Doc_Name. xml , this file will not be called 'D oc_Name' but will be replaced with the title of the document (D eveloper_Guide.ent, for example). This is only likely to be edited once at the beginning of publication or if the copyright owner changes. This must remain the same as Doc_Name. xml or the book will not build. R evi si o n_Hi sto ry. xml When publ i can packag e is run, the first XML file containing a <revhi sto ry> tag is used to build the RPM revision history. 9 .1 .3.1 . Adding Me dia t o Do cum e nt at io n Occasionally it may become necessary to add various media to a document in order to illustrate what is being explained. Imag es The i mag es folder is created by publican in the document's directory. Store any images used in the document here. Then when entering an image into the document, link to the image inside the i mag es directory (. /i mag es/i mag e1. png , for example). C o d e Examp les As time passes and technology changes, a project's documentation will be required to be updated to reflect differences in code. To make this easier, create individual files for each code example in a preferred editor, then save them in a folder called extras in the document's directory. Then, when entering the code sample into the document, link to the file and the folder it is in. This way an example used in several places can be updated only once, and rather than search through a document looking for a specific item to change, all the code examples are located in the one place, saving time and effort. Arb it rary Files On occasion there may be a requirement for files not attached to the documentation to be bundled with the RPM (video tutorials, for example). Adding these files to a directory called fi l es in the publication's directory will allow them to be added to the RPM when the book is compiled. To link to any of these files, use the following XML: <xi:include parse="text" href="extras/fork/fork1.c" xmlns:xi="http://www.w3.org/2001/XInclude" /> 9.1.4 . Building a Document In the root directory, first run a test build to ensure that all the XML is correct and acceptable by typing publ i can bui l d --fo rmats= chosen_format --l ang s= chosen_language. For example, to build a document in US English and as a single HTML page, run publ i can bui l d -fo rmats= html -si ng l e --l ang s= en-US. Provided there are no errors the book will be built into 126 Chapt er 9 . Document at ion T ools the root directory where the pages can be viewed to see if it has the look required. It is recommended to do this regularly in order to make troubleshooting as easy as possible. Note When creating a build to test for any bugs in the XML code, sometimes it may be useful to use the --no val i d option. This skips over any cross-references and links that point to files or sections of the document that do not yet exist. Instead they are shown as three question marks (???). There are a number of different formats a document can be published in. These are: h t ml An ordinary HTML page with links to new pages for new chapters and sections. h t ml- sin g le One long HTML page where the links to new chapters and sections at the top of the page directing the user further down the page, rather than to new page. h t ml- d eskt o p One long HTML page where the links to new chapters and sections are in a panel on the left side of the document, directing the user further down the page, rather than to a new page. man A man page for Linux, UNIX, and other similar operating systems. pdf A PD F file. t est The XML is validated without actually creating a file for viewing. t xt A single text file. ep u b An e-book in EPUB format. eclip se An Eclipse help plug-in. 9.1.5. Packaging a Publicat ion Once the documentation is complete and can be built with no errors, run publ i can packag e -l ang = chosen_language. This will output SRPM packages to tmp/rpm in the document's directory, and binary RPM packages will go to tmp/rpm/no arch in the document's directory. By default, these packages are named productname-title-productnumber-[web]-language-editionpubsnumber.[build_target]. no arch. file_extension with the information for each of these sections coming from publ i can. cfg . 127 Red Hat Ent erprise Linux 6 Developer G uide 9.1.6. Brands Brands are used in a similar way as templates in that they create a level of consistency in appearance, with aspects like matching logos, images and color schemes, across a range of documents. This can be particularly useful when producing several books for the same application or the same bundle of applications. In order to create a new brand, it must have a name and a language. Run publ i can create_brand --name= brand --l ang = language_code. This will create a folder called publ i can-brand and place it in the publication's directory. This folder contains the following files: C O P Y ING Part of an SRPM package and containing the copyright license and details. d efaul ts. cfg Provides default values for the parameters that can be set in publ i can. cfg . Specifications from this file are applied first before applying those in the publ i can. cfg file. Therefore, values in the publ i can. cfg file override those in the d efaul ts. cfg file. It is best used for aspects that are routinely used throughout the documents but still allows writers to change settings. o verri d es. cfg Also provides values for the parameters that can be set in publ i can-brand . spec. Specifications from this file are applied last, thus overriding both the d efaul ts. cfg and the publ i can. cfg . It is best used for aspects the writers are not allowed to change. publ i can. cfg This file is similar to the publ i can. cfg file for a publication in that it configures basic information for the brand, such as version, release number and brand name. publ i can-brand . spec This file is used by the RPM Package Manager to package the publication into an RPM. R EAD ME Part of an SRPM package and providing a brief description of the package. A subdirectory, named by the language code, is also placed in this directory and contains the following files: Feed back. xml This is generated by default to allow readers to leave feedback. Customize it to contain the relevant contact details or a bug reporting process. Leg al _No ti ce. xml : Contains copyright information. Edit it to change the details of the chosen copyright license. Two more subdirectories are within this directory. The i mag es subdirectory contains a number of images of both raster (PNG) and vector (SVG) formats and serve as place holders for various navigation icons that can be changed by replacing the images. The css folder contains o verri d es. css, which sets the visual style for the brand, overriding those in co mmo n. css. 128 Chapt er 9 . Document at ion T ools In order to package the new brand ready for distribution, use the publ i can packag e command. By default this creates source RPM packages (SRPM Packages) but it can also create binary RPM packages using the option --bi nary. Packages are named publican-brand-versionrelease.[build_target].[no arch].file_extension with the required parameters taken from the publ i can. cfg file. Note SRPM packages have the file extension .src.rpm while binary RPM packages have the file extension .rpm Binary RPM packages include [bui l d _targ et]. no arch before the file extension, where [bui l d _targ et] represents the operating system and version that the package is built for as set by the o s_ver parameter in the publ i can. cfg file. The noarch element specifies that the package can be installed on any system, regardless of the system architecture. 9.1.7. Building a Websit e Publican can also build websites to manage documentation. This is mostly useful when only one person is maintaining the documentation, but where a team is working on the documentation Publican can generate RPM packages of documentation to install on a web server. The website created consists of a homepage, product and version description pages, and the pages for the documentation. In the publication's root directory, Publican creates a configuration file, an SQLite database file, and two subdirectories. There could be many configuration files depending on how many languages the documentation is published in, with a new subdirectory for each language. See Section 9.1.8, “ D ocumentation” for more information. 9.1.8. Document at ion Publican has comprehensive --man, --hel p and --hel p_acti o ns pages accessed from the terminal. For information on XML including the different tags available, see the D ocBook guide, DocBook: the definitive guide by Norman Walsh and Leonard Muellner, found here: http://www.docbook.org/tdg/en/html/docbook and specifically Part II: Reference for a list of all the tags and brief instructions on how to use them. There is also the comprehensive Publican User Guide accessed online at http://jfearn.fedorapeople.org/en-US/index.html or installed locally with yum i nstal l publ i cand o c. 9.2. Doxygen D oxygen is a documentation tool that creates reference material both online in HTML and offline in Latex. It does this from a set of documented source files which makes it easy to keep the documentation consistent and correct with the source code. 9.2.1. Doxygen Support ed Out put and Languages D oxygen has support for output in: RTF (MS Word) 129 Red Hat Ent erprise Linux 6 Developer G uide PostScript Hyperlinked PD F Compressed HTML Unix man pages D oxygen supports the following programming languages: C C++ C# Objective -C ID L Java VHD L PHP Python Fortran D 9.2.2. Get t ing St art ed D oxygen uses a configuration file to determine its settings, therefore it is paramount that this be created correctly. Each project requires its own configuration file. The most painless way to create the configuration file is with the command d o xyg en -g config-file. This creates a template configuration file that can be easily edited. The variable config-file is the name of the configuration file. If it is committed from the command it is called D oxyfile by default. Another useful option while creating the configuration file is the use of a minus sign (-) as the file name. This is useful for scripting as it will cause D oxygen to attempt to read the configuration file from standard input (std i n). The configuration file consists of a number of variables and tags, similar to a simple Makefile. For example: T AG NAME = VALUE1 VALUE2. . . For the most part these can be left alone but should it be required to edit them see the configuration page of the D oxygen documentation website for an extensive explanation of all the tags available. There is also a GUI interface called d o xywi zard . If this is the preferred method of editing then documentation for this function can be found on the Doxywizard usage page of the D oxygen documentation website. There are eight tags that are useful to become familiar with. INP UT 130 Chapt er 9 . Document at ion T ools For small projects consisting mainly of C or C++ source and header files it is not required to change anything. However, if the project is large and consists of a source directory or tree, then assign the root directory or directories to the INPUT tag. FILE_P AT T ER NS File patterns (for example, *. cpp or *. h) can be added to this tag allowing only files that match one of the patterns to be parsed. R EC UR SIVE Setting this to yes will allow recursive parsing of a source tree. EXC LUD E an d EXC LUD E_P AT T ER NS These are used to further fine-tune the files that are parsed by adding file patterns to avoid. For example, to omit all test directories from a source tree, use EXC LUD E_P AT T ER NS = */test/*. EXT R AC T _ALL When this is set to yes, doxygen will pretend that everything in the source files is documented to give an idea of how a fully documented project would look. However, warnings regarding undocumented members will not be generated in this mode; set it back to no when finished to correct this. SO UR C E_BR O WSER an d INLINE_SO UR C ES By setting the SO UR C E_BR O WSER tag to yes doxygen will generate a cross-reference to analyze a piece of software's definition in its source files with the documentation existing about it. These sources can also be included in the documentation by setting INLINE_SO UR C ES to yes. 9.2.3. Running Doxygen Running d o xyg en config-file creates html , rtf, l atex, xml , and / or man directories in whichever directory doxygen is started in, containing the documentation for the corresponding filetype. HT ML O UT P UT This documentation can be viewed with a HTML browser that supports cascading style sheets (CSS), as well as D HTML and Javascript for some sections. Point the browser (for example, Mozilla, Safari, Konqueror, or Internet Explorer 6) to the i nd ex. html in the html directory. LaT eX O UT P UT D oxygen writes a Makefi l e into the l atex directory in order to make it easy to first compile the Latex documentation. To do this, use a recent teTeX distribution. What is contained in this directory depends on whether the USE_P D FLAT EX is set to no . Where this is true, typing make while in the l atex directory generates refman. d vi . This can then be viewed with xd vi or converted to refman. ps by typing make ps. Note that this requires d vi ps. There are a number of commands that may be useful. The command make ps_2o n1 prints two pages on one physical page. It is also possible to convert to a PD F if a ghostscript interpreter is installed by using the command make pd f. Another valid command is make pd f_2o n1. When doing this set P D F_HY P ER LINKS and USE_P D FLAT EX tags to yes as this will cause Makefi l e will only contain a target to build refman. pd f directly. 131 Red Hat Ent erprise Linux 6 Developer G uide R T F O UT P UT This file is designed to import into Microsoft Word by combining the RTF output into a single file: refman. rtf. Some information is encoded using fields but this can be shown by selecting all (C T R L+ A or Edit -> select all) and then right-click and select the to g g l e fi el d s option from the drop down menu. XML O UT P UT The output into the xml directory consists of a number of files, each compound gathered by doxygen, as well as an i nd ex. xml . An XSLT script, co mbi ne. xsl t, is also created that is used to combine all the XML files into a single file. Along with this, two XML schema files are created, i nd ex. xsd for the index file, and co mpo und . xsd for the compound files, which describe the possible elements, their attributes, and how they are structured. MAN P AG E O UT P UT The documentation from the man directory can be viewed with the man program after ensuring the manpath has the correct man directory in the man path. Be aware that due to limitations with the man page format, information such as diagrams, cross-references and formulas will be lost. 9.2.4 . Document ing t he Sources There are three main steps to document the sources. 1. First, ensure that EXT R AC T _ALL is set to no so warnings are correctly generated and documentation is built properly. This allows doxygen to create documentation for documented members, files, classes and namespaces. 2. There are two ways this documentation can be created: A special d o cu men t at io n b lo ck This comment block, containing additional marking so D oxygen knows it is part of the documentation, is in either C or C++. It consists of a brief description, or a detailed description. Both of these are optional. What is not optional, however, is the in body description. This then links together all the comment blocks found in the body of the method or function. Note While more than one brief or detailed description is allowed, this is not recommended as the order is not specified. The following will detail the ways in which a comment block can be marked as a detailed description: C-style comment block, starting with two asterisks (*) in the JavaD oc style. /** * ... documentation ... */ C-style comment block using the Qt style, consisting of an exclamation mark (!) instead of an extra asterisk. 132 Chapt er 9 . Document at ion T ools /*! * ... documentation ... */ The beginning asterisks on the documentation lines can be left out in both cases if that is preferred. A blank beginning and end line in C++ also acceptable, with either three forward slashes or two forward slashes and an exclamation mark. /// /// ... documentation /// or //! //! ... documentation ... //! Alternatively, in order to make the comment blocks more visible a line of asterisks or forward slashes can be used. ///////////////////////////////////////////////// /// ... documentation ... ///////////////////////////////////////////////// or /********************************************//** * ... documentation ... ***********************************************/ Note that the two forwards slashes at the end of the normal comment block start a special comment block. There are three ways to add a brief description to documentation. To add a brief description use \bri ef above one of the comment blocks. This brief section ends at the end of the paragraph and any further paragraphs are the detailed descriptions. /*! \brief brief documentation. * brief documentation. * * detailed documentation. */ By setting JAVAD O C _AUT O BR IEF to yes, the brief description will only last until the first dot followed by a space or new line. Consequentially limiting the brief description to a single sentence. 133 Red Hat Ent erprise Linux 6 Developer G uide /** Brief documentation. Detailed documentation continues * from here. */ This can also be used with the above mentioned three-slash comment blocks (///). The third option is to use a special C++ style comment, ensuring this does not span more than one line. /// Brief documentation. /** Detailed documentation. */ or //! Brief documentation. //! Detailed documentation //! starts here The blank line in the above example is required to separate the brief description and the detailed description, and JAVAD O C _AUT O BR IEF must to be set to no . Examples of how a documented piece of C++ code using the Qt style can be found on the Doxygen documentation website It is also possible to have the documentation after members of a file, struct, union, class, or enum. To do this add a < marker in the comment block.\ int var; /*!< detailed description after the member */ Or in a Qt style as: int var; /**< detailed description after the member */ or int var; //!< detailed description after the member //!< or int var; ///< detailed description after the member ///< For brief descriptions after a member use: int var; //!< brief description after the member or int var; ///< brief description after the member 134 Chapt er 9 . Document at ion T ools Examples of these and how the HTML is produced can be viewed on the Doxygen documentation website D o cu men t at io n at o t h er p laces While it is preferable to place documentation in front of the code it is documenting, at times it is only possible to put it in a different location, especially if a file is to be documented; after all it is impossible to place the documentation in front of a file. This is best avoided unless it is absolutely necessary as it can lead to some duplication of information. To do this it is important to have a structural command inside the documentation block. Structural commands start with a backslash (\) or an at-sign (@) for JavaD oc and are followed by one or more parameters. /*! \class Test \brief A test class. A more detailed description of class. */ In the above example the command \cl ass is used. This indicates that the comment block contains documentation for the class 'Test'. Others are: \struct: document a C-struct \uni o n: document a union \enum: document an enumeration type \fn: document a function \var: document a variable, typedef, or enum value \d ef: document a #define \typed ef: document a type definition \fi l e: document a file \namespace: document a namespace \packag e: document a Java package \i nterface: document an ID L interface 3. Next, the contents of a special documentation block is parsed before being written to the HTML and / Latex output directories. This includes: a. Special commands are executed. b. Any white space and asterisks (*) are removed. c. Blank lines are taken as new paragraphs. d. Words are linked to their corresponding documentation. Where the word is preceded by a percent sign (% ) the percent sign is removed and the word remains. 135 Red Hat Ent erprise Linux 6 Developer G uide e. Where certain patterns are found in the text, links to members are created. Examples of this can be found on the automatic link generation page on the D oxygen documentation website. f. When the documentation is for Latex, HTML tags are interpreted and converted to Latex equivalents. A list of supported HTML tags can be found on the HTML commands page on the D oxygen documentation website. 9.2.5. Resources More information can be found on the D oxygen website. Doxygen homepage Doxygen introduction Doxygen documentation Output formats 136 Appendix Appendix A.1. mal l o pt mal l o pt is a library call that allows a program to change the behavior of the malloc memory allocator. Examp le A.1. Allo cat o r h eu rist ics An allocator has heuristics to determine long versus short lived objects. For the former, it attempts to allocate with mmap. For the later, it attempts to allocate with sbrk. In order to override these heuristics, set M_MMAP _T HR ESHO LD . In multi-threaded applications, the allocator creates multiple arenas in response to lock contention in existing arenas. This can improve the performance significantly for some multi-threaded applications at the cost of an increase in memory usage. To keep this under control, limit the number of arenas that can be created by using the mal l o pt interface. The allocator has limits on the number of arenas it can create. For 32bit targets, it will create 2 * # core arenas; for 64bit targets, it will create 8 * # core arenas. mal l o pt allows the developer to override those limits. Examp le A.2. mal l o pt To ensure no more than eight arenas are created, issue the following library call: mallopt (M_ARENA_MAX, 8); The first argument for mal l o pt can be: M_MXFAST M_TRIM_THRESHOLD M_TOP_PAD M_MMAP_THRESHOLD M_MMAP_MAX M_CHECK_ACTION M_PERTURB M_ARENA_TEST M_ARENA_MAX Specific definitions for the above can be found at http://www.makelinux.net/man/3/M/mallopt. mal l o c_tri m 137 Red Hat Ent erprise Linux 6 Developer G uide mal l o c_tri m is a library call that requests the allocator return any unused memory back to the operating system. This is normally automatic when an object is freed. However, in some cases when freeing small objects, g l i bc might not immediately release the memory back to the operating system. It does this so that the free memory can be used to satisfy upcoming memory allocation requests as it is expensive to allocate from and release memory back to the operating system. mal l o c_stats mal l o c_stats is used to dump information about the allocator's internal state to std err. Using mal l i nfo is similar to this, but it places the state into a structure instead. Further Information More information on mal l o pt can be found at http://www.makelinux.net/man/3/M/mallopt and http://www.gnu.org/software/libc/manual/html_node/Malloc-Tunable-Parameters.html. 138 Revision Hist ory Revision History R evisio n 2- 51 Initial release for RHEL 6.6. Fri O ct 10 2014 R o b ert K rát ký Index Symbols .sp ec f ile - specfile Editor - compiling and building, Eclipse RPM Building, Eclipse Built-in Specfile Editor A ad van t ag es - Python pretty-printers - debugging, Python Pretty-Printers Ako n ad i - KD E D evelopment Framework - libraries and runtime support, KD E4 Architecture Ap ach e Su b versio n ( SVN ) - Collaborating, Apache Subversion (SVN) - Committing changes, Committing Changes - D ocumentation, SVN D ocumentation - Importing data, Importing D ata - Installation, Installation - SVN Repository, SVN Repository - Working Copies, Working Copies arch it ect u re, K D E4 - KD E D evelopment Framework - libraries and runtime support, KD E4 Architecture au t h o riz in g co mp ile servers f o r co n n ect io n - SSL and certificate management - SystemTap, Authorizing Compile Servers for Connection au t o mat ic au t h o riz at io n - SSL and certificate management - SystemTap, Automatic Authorization Au t o t o o ls - compiling and building, Autotools B b ackt race - tools - GNU debugger, Simple GD B 139 Red Hat Ent erprise Linux 6 Developer G uide b in u t ils - version, What D oes Red Hat D eveloper Toolset Offer? B o o st - libraries and runtime support, Boost b o o st - d o c - Boost - libraries and runtime support, Boost D ocumentation b reakp o in t - fundamentals - GNU debugger, Simple GD B b reakp o in t s ( co n d it io n al) - GNU debugger, Conditional Breakpoints b u ild - id - compiling and building, build-id Unique Identification of Binaries b u ild in g - compiling and building, Compiling and Building C C + + St an d ard Lib rary, G N U - libraries and runtime support, The GNU C++ Standard Library C + + 0x, ad d ed su p p o rt f o r - GNU C++ Standard Library - libraries and runtime support, GNU C++ Standard Library Updates C /C + + so u rce co d e - Eclipse, Editing C/C++ Source Code in Eclipse cach eg rin d - tools - Valgrind, Valgrind Tools callg rin d - tools - Valgrind, Valgrind Tools C D T in Eclip se - Compiling and building, CD T in Eclipse - Compiling and Building - Autotools Project, Autotools Project - Managed Make Project, Managed Make Project - Standard Make Project, Standard Make Project cert if icat e man ag emen t - SSL and certificate management - SystemTap, SSL and Certificate Management C o d e C o mp let io n 14 0 Revision Hist ory - libhover - libraries and runtime support, Setup and Usage C o llab o rat in g , C o llab o rat in g - Apache Subversion (SVN), Apache Subversion (SVN) - Committing changes, Committing Changes - D ocumentation, SVN D ocumentation - Importing data, Importing D ata - Installation, Installation - SVN Repository, SVN Repository - Working Copies, Working Copies - Concurrent Versions System (CVS), Concurrent Versions System (CVS) C o mman d G ro u p Availab ilit y T ab - integrated development environment - Eclipse, Customize Perspective co mman d s - fundamentals - GNU debugger, Simple GD B - profiling - Valgrind, Valgrind Tools - tools - Performance Counters for Linux (PCL) and perf, Perf Tool Commands co mmo n ly- u sed co mman d s - Autotools - compiling and building, Autotools co mp at - g lib c - libraries and runtime support, compat-glibc co mp at ib ilit y - libraries and runtime support, Compatibility co mp ile server - SystemTap, SystemTap Compile Server co mp ilin g a C H ello Wo rld p ro g ram - usage - GCC, Simple C Usage co mp ilin g a C + + H ello Wo rld p ro g ram - usage - GCC, Simple C++ Usage co mp ilin g an d b u ild in g - Autotools, Autotools - commonly-used commands, Autotools - configuration script, Configuration Script - documentation, Autotools D ocumentation - plug-in for Eclipse, Autotools Plug-in for Eclipse 14 1 Red Hat Ent erprise Linux 6 Developer G uide - templates (supported), Autotools Plug-in for Eclipse - build-id, build-id Unique Identification of Binaries - distributed compiling, D istributed Compiling - GNU Compiler Collection, GNU Compiler Collection (GCC) - documentation, GCC D ocumentation - required packages, Running GCC - usage, Running GCC - introduction, Compiling and Building - required packages, D istributed Compiling - specfile Editor, Eclipse RPM Building, Eclipse Built-in Specfile Editor - plug-in for Eclipse, Eclipse RPM Building, Eclipse Built-in Specfile Editor C o mp ilin g an d b u ild in g - CD T in Eclipse, CD T in Eclipse C o mp ilin g an d B u ild in g - CD T in Eclipse - Autotools Project, Autotools Project - Managed Make Project, Managed Make Project - Standard Make Project, Standard Make Project C o n cu rren t Versio n s Syst em ( C VS) - Collaborating, Concurrent Versions System (CVS) co n d it io n al b reakp o in t s - GNU debugger, Conditional Breakpoints co n f ig u rat io n scrip t - Autotools - compiling and building, Configuration Script co n f ig u rin g keyb o ard sh o rt cu t s - integrated development environment - Eclipse, Keyboard Shortcuts co n n ect io n au t h o riz at io n ( co mp ile servers) - SSL and certificate management - SystemTap, Authorizing Compile Servers for Connection C o n so le View - user interface - Eclipse, Eclipse User Interface C o n t en t s ( H elp C o n t en t s) - Help system - Eclipse, Eclipse D ocumentation co n t in u e - tools - GNU debugger, Simple GD B C u st o miz e Persp ect ive Men u - integrated development environment 14 2 Revision Hist ory - Eclipse, Customize Perspective D d eb u g f s f ile syst em - profiling - ftrace, ftrace d eb u g g in g - debuginfo-packages, Installing D ebuginfo Packages - installation, Installing D ebuginfo Packages - GNU debugger, GD B - fundamental mechanisms, GD B - GD B, GD B - requirements, GD B - introduction, D ebugging - Python pretty-printers, Python Pretty-Printers - advantages, Python Pretty-Printers - debugging output (formatted), Python Pretty-Printers - documentation, Python Pretty-Printers - pretty-printers, Python Pretty-Printers - variable tracking at assignments (VTA), Variable Tracking at Assignments D eb u g g in g - D ebugging C/C++ applications with Eclipse, D ebugging C/C++ Applications with Eclipse d eb u g g in g a H ello Wo rld p ro g ram - usage - GNU debugger, Running GD B D eb u g g in g C /C + + ap p licat io n s wit h Eclip se - D ebugging, D ebugging C/C++ Applications with Eclipse d eb u g g in g o u t p u t ( f o rmat t ed ) - Python pretty-printers - debugging, Python Pretty-Printers d eb u g in f o - p ackag es - debugging, Installing D ebuginfo Packages d ef au lt - user interface - Eclipse, Eclipse User Interface d ist rib u t ed co mp ilin g - compiling and building, D istributed Compiling d o cu men t at io n - Autotools - compiling and building, Autotools D ocumentation - Boost - libraries and runtime support, Boost D ocumentation 14 3 Red Hat Ent erprise Linux 6 Developer G uide - GNU C++ Standard Library - libraries and runtime support, GNU C++ Standard Library D ocumentation - GNU Compiler Collection - compiling and building, GCC D ocumentation - GNU debugger, GD B D ocumentation - Java - libraries and runtime support, Java D ocumentation - KD E D evelopment Framework - libraries and runtime support, kdelibs D ocumentation - OProfile - profiling, OProfile D ocumentation - Perl - libraries and runtime support, Perl D ocumentation - profiling - ftrace, ftrace D ocumentation - Python - libraries and runtime support, Python D ocumentation - Python pretty-printers - debugging, Python Pretty-Printers - Qt - libraries and runtime support, Qt Library D ocumentation - Ruby - libraries and runtime support, Ruby D ocumentation - SystemTap - profiling, SystemTap D ocumentation - Valgrind - profiling, Valgrind D ocumentation D o cu men t at io n - D oxygen, D oxygen - D ocment sources, D ocumenting the Sources - Getting Started, Getting Started - Resources, Resources - Running D oxygen, Running D oxygen - Supported output and languages, D oxygen Supported Output and Languages D o cu men t at io n T o o ls, D o cu men t at io n T o o ls - Publican, Publican - Adding media to documentation, Adding Media to D ocumentation - Brands, Brands - Building a document, Building a D ocument - Building a website, Building a Website - Commands, Commands - Create a new document, Create a New D ocument - Files, Files - Packaging a publication, Packaging a Publication 14 4 Revision Hist ory - Publican documentation, D ocumentation D o xyg en - D ocumentation, D oxygen - document sources, D ocumenting the Sources - Getting Started, Getting Started - Resources, Resources - Running D oxygen, Running D oxygen - Supported output and languages, D oxygen Supported Output and Languages d wz - version, What D oes Red Hat D eveloper Toolset Offer? D yn amic H elp - Help system - Eclipse, Eclipse D ocumentation D yn in st - version, What D oes Red Hat D eveloper Toolset Offer? E Eclip se - C/C++ source code, Editing C/C++ Source Code in Eclipse - D ocumentation, Eclipse D ocumentation - Help system, Eclipse D ocumentation - Contents (Help Contents), Eclipse D ocumentation - D ynamic Help, Eclipse D ocumentation - Menu (Help Menu), Eclipse D ocumentation - Workbench User Guide, Eclipse D ocumentation - integrated development environment, Eclipse User Interface - Command Group Availability Tab, Customize Perspective - configuring keyboard shortcuts, Keyboard Shortcuts - Customize Perspective Menu, Customize Perspective - ID E (integrated development environment), Eclipse User Interface - Keyboard Shortcuts Menu, Keyboard Shortcuts - menu (Main Menu), Eclipse User Interface - Menu Visibility Tab, Customize Perspective - perspectives, Eclipse User Interface - Quick Access Menu, The Quick Access Menu - Shortcuts Tab, Customize Perspective - Tool Bar Visibility, Customize Perspective - user interface, Eclipse User Interface - workbench, Eclipse User Interface - introduction, Eclipse D evelopment Environment Java D evelopment, Editing Java Source Code in Eclipse libhover plug-in, libhover Plug-in profiling, Valgrind Plug-in for Eclipse, OProfile Plug-in For Eclipse projects, Starting an Eclipse project - New Project Wizard, Starting an Eclipse project - technical overview, Starting an Eclipse project - workspace (overview), Starting an Eclipse project - Workspace Launcher, Starting an Eclipse project 14 5 Red Hat Ent erprise Linux 6 Developer G uide - Quick Access Menu, The Quick Access Menu RPM Building, Eclipse RPM Building User Interface, Eclipse User Interface user interface - Console View, Eclipse User Interface - default, Eclipse User Interface - Editor, Eclipse User Interface - Outline Window, Eclipse User Interface - Problems View, Eclipse User Interface - Project Explorer, Eclipse User Interface - quick fix (Problems View), Eclipse User Interface - Tasks Properties, Eclipse User Interface - Tasks View, Eclipse User Interface - tracked comments, Eclipse User Interface - View Menu (button), Eclipse User Interface - version, What D oes Red Hat D eveloper Toolset Offer? Ed it o r - user interface - Eclipse, Eclipse User Interface elf u t ils - version, What D oes Red Hat D eveloper Toolset Offer? execu t io n ( f o rked ) - GNU debugger, Forked Execution F f eed b ack - contact information for this manual, We Need Feedback! f in ish - tools - GNU debugger, Simple GD B f o rked execu t io n - GNU debugger, Forked Execution f o rmat t ed d eb u g g in g o u t p u t - Python pretty-printers - debugging, Python Pretty-Printers f ramewo rk ( f t race) - profiling - ftrace, ftrace f t race - profiling, ftrace - debugfs file system, ftrace - documentation, ftrace D ocumentation - framework (ftrace), ftrace - usage, Using ftrace f u n ct io n t racer 14 6 Revision Hist ory - profiling - ftrace, ftrace f u n d amen t al co mman d s - fundamentals - GNU debugger, Simple GD B f u n d amen t al mech an isms - GNU debugger - debugging, GD B f u n d amen t als - GNU debugger, Simple GD B G g cc - GNU Compiler Collection - compiling and building, GNU Compiler Collection (GCC) G CC C - usage - compiling a C Hello World program, Simple C Usage G CC C+ + - usage - compiling a C++ Hello World program, Simple C++ Usage G DB - GNU debugger - debugging, GD B G it - configuration, Installing and Configuring Git documentation, Additional Resources installation, Installing and Configuring Git overview, Git usage, Using Git G N O ME Po wer Man ag er - libraries and runtime support, GNOME Power Manager g n o me- p o wer- man ag er - GNOME Power Manager - libraries and runtime support, GNOME Power Manager G N U C + + St an d ard Lib rary - libraries and runtime support, The GNU C++ Standard Library G N U C o mp iler C o llect io n - compiling and building, GNU Compiler Collection (GCC) - version, What D oes Red Hat D eveloper Toolset Offer? G N U d eb u g g er - conditional breakpoints, Conditional Breakpoints 14 7 Red Hat Ent erprise Linux 6 Developer G uide - debugging, GD B documentation, GD B D ocumentation execution (forked), Forked Execution forked execution, Forked Execution fundamentals, Simple GD B - breakpoint, Simple GD B - commands, Simple GD B - halting an executable, Simple GD B - inspecting the state of an executable, Simple GD B - starting an executable, Simple GD B - interfaces (CLI and machine), Alternative User Interfaces for GD B - thread and threaded debugging, D ebugging Individual Threads - tools, Simple GD B - backtrace, Simple GD B - continue, Simple GD B - finish, Simple GD B - help, Simple GD B - list, Simple GD B - next, Simple GD B - print, Simple GD B - quit, Simple GD B - step, Simple GD B - usage, Running GD B - debugging a Hello World program, Running GD B - variations and environments, Alternative User Interfaces for GD B G N U D eb u g g er - version, What D oes Red Hat D eveloper Toolset Offer? H h alt in g an execu t ab le - fundamentals - GNU debugger, Simple GD B h elg rin d - tools - Valgrind, Valgrind Tools h elp - getting help, D o You Need Help? - tools - GNU debugger, Simple GD B H elp syst em - Eclipse, Eclipse D ocumentation h o st ( co mp ile server h o st ) - compile server - SystemTap, SystemTap Compile Server H o ver H elp - libhover - libraries and runtime support, Setup and Usage 14 8 Revision Hist ory I ID E ( in t eg rat ed d evelo p men t en viro n men t ) - integrated development environment - Eclipse, Eclipse User Interface in d exin g - libhover - libraries and runtime support, libhover Plug-in in sp ect in g t h e st at e o f an execu t ab le - fundamentals - GNU debugger, Simple GD B in st allat io n - debuginfo-packages - debugging, Installing D ebuginfo Packages in t eg rat ed d evelo p men t en viro n men t - Eclipse, Eclipse User Interface in t erf aces ( C LI an d mach in e) - GNU debugger, Alternative User Interfaces for GD B in t ro d u ct io n - compiling and building, Compiling and Building - debugging, D ebugging - Eclipse, Eclipse D evelopment Environment - libraries and runtime support, Libraries and Runtime Support - profiling, Profiling - SystemTap, SystemTap ISO 14 4 82 St an d ard C + + lib rary - GNU C++ Standard Library - libraries and runtime support, The GNU C++ Standard Library ISO C + + T R 1 elemen t s, ad d ed su p p o rt f o r - GNU C++ Standard Library - libraries and runtime support, GNU C++ Standard Library Updates J Java - libraries and runtime support, Java Java D evelo p men t - Eclipse, Editing Java Source Code in Eclipse K K D E D evelo p men t Framewo rk - libraries and runtime support, KD E D evelopment Framework K D E4 arch it ect u re - KD E D evelopment Framework - libraries and runtime support, KD E4 Architecture 14 9 Red Hat Ent erprise Linux 6 Developer G uide kd elib s- d evel - KD E D evelopment Framework - libraries and runtime support, KD E D evelopment Framework kern el in f o rmat io n p ackag es - profiling - SystemTap, SystemTap K eyb o ard Sh o rt cu t s Men u - integrated development environment - Eclipse, Keyboard Shortcuts K H T ML - KD E D evelopment Framework - libraries and runtime support, KD E4 Architecture K IO - KD E D evelopment Framework - libraries and runtime support, KD E4 Architecture K JS - KD E D evelopment Framework - libraries and runtime support, KD E4 Architecture K N ewSt u f f 2 - KD E D evelopment Framework - libraries and runtime support, KD E4 Architecture K XMLG U I - KD E D evelopment Framework - libraries and runtime support, KD E4 Architecture L lib raries - runtime support, Libraries and Runtime Support lib raries an d ru n t ime su p p o rt - Boost, Boost - boost-doc, Boost D ocumentation - documentation, Boost D ocumentation - message passing interface (MPI), Boost - meta-package, Boost - MPICH2, Boost - new libraries, Boost Updates - Open MPI, Boost - sub-packages, Boost - updates, Boost Updates - C++ Standard Library, GNU, The GNU C++ Standard Library compat-glibc, compat-glibc compatibility, Compatibility GNOME Power Manager, GNOME Power Manager - gnome-power-manager, GNOME Power Manager - GNU C++ Standard Library, The GNU C++ Standard Library 150 Revision Hist ory - C++0x, added support for, GNU C++ Standard Library Updates - documentation, GNU C++ Standard Library D ocumentation - ISO 14482 Standard C++ library, The GNU C++ Standard Library - ISO C++ TR1 elements, added support for, GNU C++ Standard Library Updates - libstdc++-devel, The GNU C++ Standard Library - libstdc++-docs, GNU C++ Standard Library D ocumentation - Standard Template Library, The GNU C++ Standard Library - updates, GNU C++ Standard Library Updates - introduction, Libraries and Runtime Support - Java, Java - documentation, Java D ocumentation - KD E D evelopment Framework, KD E D evelopment Framework - Akonadi, KD E4 Architecture - documentation, kdelibs D ocumentation - KD E4 architecture, KD E4 Architecture - kdelibs-devel, KD E D evelopment Framework - KHTML, KD E4 Architecture - KIO, KD E4 Architecture - KJS, KD E4 Architecture - KNewStuff2, KD E4 Architecture - KXMLGUI, KD E4 Architecture - Phonon, KD E4 Architecture - Plasma, KD E4 Architecture - Solid, KD E4 Architecture - Sonnet, KD E4 Architecture - Strigi, KD E4 Architecture - Telepathy, KD E4 Architecture - libhover - Code Completion, Setup and Usage Hover Help, Setup and Usage indexing, libhover Plug-in usage, Setup and Usage - libstdc++, The GNU C++ Standard Library - Perl, Perl - documentation, Perl D ocumentation - module installation, Installation - updates, Perl Updates - Python, Python - documentation, Python D ocumentation - updates, Python Updates - Qt, Qt - documentation, Qt Library D ocumentation meta object compiler (MOC), Qt Qt Creator, Qt Creator qt-doc, Qt Library D ocumentation updates, Qt Updates widget toolkit, Qt - Ruby, Ruby - documentation, Ruby D ocumentation - ruby-devel, Ruby 151 Red Hat Ent erprise Linux 6 Developer G uide Lib rary an d R u n t ime D et ails - NSS Shared D atabases, NSS Shared D atabases - Backwards Compatibility, Backwards Compatibility - D ocumentation, NSS Shared D atabases D ocumentation lib st d c+ + - libraries and runtime support, The GNU C++ Standard Library lib st d c+ + - d evel - GNU C++ Standard Library - libraries and runtime support, The GNU C++ Standard Library lib st d c+ + - d o cs - GNU C++ Standard Library - libraries and runtime support, GNU C++ Standard Library D ocumentation list - tools - GNU debugger, Simple GD B - Performance Counters for Linux (PCL) and perf, Perf Tool Commands lt race - version, What D oes Red Hat D eveloper Toolset Offer? M mach in e in t erf ace - GNU debugger, Alternative User Interfaces for GD B mallo p t , mallo p t massif - tools - Valgrind, Valgrind Tools mech an isms - GNU debugger - debugging, GD B memch eck - tools - Valgrind, Valgrind Tools memst o mp - version, What D oes Red Hat D eveloper Toolset Offer? Men u ( H elp Men u ) - Help system - Eclipse, Eclipse D ocumentation men u ( Main Men u ) - integrated development environment - Eclipse, Eclipse User Interface Men u Visib ilit y T ab - integrated development environment 152 Revision Hist ory - Eclipse, Customize Perspective messag e p assin g in t erf ace ( MPI) - Boost - libraries and runtime support, Boost met a o b ject co mp iler ( MO C ) - Qt - libraries and runtime support, Qt met a- p ackag e - Boost - libraries and runtime support, Boost mo d u le in st allat io n - Perl - libraries and runtime support, Installation mo d u le sig n in g ( co mp ile server au t h o riz at io n ) - SSL and certificate management - SystemTap, Authorizing Compile Servers for Module Signing (for Unprivileged Users) MPIC H 2 - Boost - libraries and runtime support, Boost N n ew ext en sio n s - GNU C++ Standard Library - libraries and runtime support, GNU C++ Standard Library Updates n ew lib raries - Boost - libraries and runtime support, Boost Updates N ew Pro ject Wiz ard - projects - Eclipse, Starting an Eclipse project n ext - tools - GNU debugger, Simple GD B N SS Sh ared D at ag b ases - Library and Runtime D etails, NSS Shared D atabases - Backwards Compatibility, Backwards Compatibility - D ocumentation, NSS Shared D atabases D ocumentation O o p an n o t at e - tools - OProfile, OProfile Tools 153 Red Hat Ent erprise Linux 6 Developer G uide o p arch ive - tools - OProfile, OProfile Tools o p co n t ro l - tools - OProfile, OProfile Tools O p en MPI - Boost - libraries and runtime support, Boost o p g p ro f - tools - OProfile, OProfile Tools o p rep o rt - tools - OProfile, OProfile Tools O Pro f ile - profiling, OProfile - documentation, OProfile D ocumentation - usage, Using OProfile - tools, OProfile Tools - opannotate, OProfile Tools - oparchive, OProfile Tools - opcontrol, OProfile Tools - opgprof, OProfile Tools - opreport, OProfile Tools - version, What D oes Red Hat D eveloper Toolset Offer? o p ro f iled - OProfile - profiling, OProfile O u t lin e Win d o w - user interface - Eclipse, Eclipse User Interface P p erf - profiling - Performance Counters for Linux (PCL) and perf, Performance Counters for Linux (PCL) Tools and perf - usage - Performance Counters for Linux (PCL) and perf, Using Perf Perf o rman ce C o u n t ers f o r Lin u x ( PC L) an d p erf - profiling, Performance Counters for Linux (PCL) Tools and perf - subsystem (PCL), Performance Counters for Linux (PCL) Tools and perf 154 Revision Hist ory - tools, Perf Tool Commands - commands, Perf Tool Commands - list, Perf Tool Commands - record, Perf Tool Commands - report, Perf Tool Commands - stat, Perf Tool Commands - usage, Using Perf - perf, Using Perf Perl - libraries and runtime support, Perl p ersp ect ives - integrated development environment - Eclipse, Eclipse User Interface Ph o n o n - KD E D evelopment Framework - libraries and runtime support, KD E4 Architecture Plasma - KD E D evelopment Framework - libraries and runtime support, KD E4 Architecture p lu g - in f o r Eclip se - Autotools - compiling and building, Autotools Plug-in for Eclipse - profiling - Valgrind, Valgrind Plug-in for Eclipse - specfile Editor - compiling and building, Eclipse RPM Building, Eclipse Built-in Specfile Editor p ret t y- p rin t ers - Python pretty-printers - debugging, Python Pretty-Printers p rin t - tools - GNU debugger, Simple GD B Pro b lems View - user interface - Eclipse, Eclipse User Interface Pro f ile As - Eclipse - profiling, Valgrind Plug-in for Eclipse, OProfile Plug-in For Eclipse Pro f ile C o n f ig u rat io n Men u - Eclipse - profiling, Valgrind Plug-in for Eclipse, OProfile Plug-in For Eclipse 155 Red Hat Ent erprise Linux 6 Developer G uide p ro f ilin g - conflict between perf and oprofile, Using OProfile, Using Perf - Eclipse, Valgrind Plug-in for Eclipse, OProfile Plug-in For Eclipse - Profile As, Valgrind Plug-in for Eclipse, OProfile Plug-in For Eclipse - Profile Configuration Menu, Valgrind Plug-in for Eclipse, OProfile Plug-in For Eclipse - ftrace, ftrace - introduction, Profiling - OProfile, OProfile - oprofiled, OProfile - Performance Counters for Linux (PCL) and perf, Performance Counters for Linux (PCL) Tools and perf - SystemTap, SystemTap - Valgrind, Valgrind Pro ject Exp lo rer - user interface - Eclipse, Eclipse User Interface p ro ject s - Eclipse, Starting an Eclipse project Pu b lican - D ocumentation Tools, Publican - Adding media to documentation, Adding Media to D ocumentation - Brands, Brands - Building a document, Building a D ocument - Building a website, Building a Website - Commands, Commands - Create a new document, Create a New D ocument - Files, Files - Packaging a publication, Packaging a Publication - Publican documentation, D ocumentation Pyt h o n - libraries and runtime support, Python Pyt h o n p ret t y- p rin t ers - debugging, Python Pretty-Printers Q Qt - libraries and runtime support, Qt Q t C reat o r - Qt - libraries and runtime support, Qt Creator qt-doc - Qt - libraries and runtime support, Qt Library D ocumentation Q u ick Access Men u 156 Revision Hist ory - integrated development environment - Eclipse, The Quick Access Menu q u ick f ix ( Pro b lems View) - user interface - Eclipse, Eclipse User Interface q u it - tools - GNU debugger, Simple GD B R reco rd - tools - Performance Counters for Linux (PCL) and perf, Perf Tool Commands R ed H at D evelo p er T o o lset - documentation, Additional Resources rep o rt - tools - Performance Counters for Linux (PCL) and perf, Perf Tool Commands req u ired p ackag es - compiling and building, D istributed Compiling - GNU Compiler Collection - compiling and building, Running GCC - profiling - SystemTap, SystemTap req u iremen t s - GNU debugger - debugging, GD B Ruby - libraries and runtime support, Ruby ru b y- d evel - Ruby - libraries and runtime support, Ruby ru n t ime su p p o rt - libraries, Libraries and Runtime Support S scrip t s ( Syst emT ap scrip t s) - profiling - SystemTap, SystemTap set u p - libhover - libraries and runtime support, Setup and Usage 157 Red Hat Ent erprise Linux 6 Developer G uide Sh o rt cu t s T ab - integrated development environment - Eclipse, Customize Perspective sig n ed mo d u les - SSL and certificate management - SystemTap, Authorizing Compile Servers for Module Signing (for Unprivileged Users) - unprivileged user support - SystemTap, SystemTap Support for Unprivileged Users So lid - KD E D evelopment Framework - libraries and runtime support, KD E4 Architecture So n n et - KD E D evelopment Framework - libraries and runtime support, KD E4 Architecture sp ecf ile Ed it o r - compiling and building, Eclipse RPM Building, Eclipse Built-in Specfile Editor SSL an d cert if icat e man ag emen t - SystemTap, SSL and Certificate Management St an d ard T emp lat e Lib rary - GNU C++ Standard Library - libraries and runtime support, The GNU C++ Standard Library st art in g an execu t ab le - fundamentals - GNU debugger, Simple GD B st at - tools - Performance Counters for Linux (PCL) and perf, Perf Tool Commands st ep - tools - GNU debugger, Simple GD B st race - version, What D oes Red Hat D eveloper Toolset Offer? St rig i - KD E D evelopment Framework - libraries and runtime support, KD E4 Architecture su b - p ackag es - Boost - libraries and runtime support, Boost su b syst em ( PC L) 158 Revision Hist ory - profiling - Performance Counters for Linux (PCL) and perf, Performance Counters for Linux (PCL) Tools and perf su p p o rt ed t emp lat es - Autotools - compiling and building, Autotools Plug-in for Eclipse SVN ( see Ap ach e Su b versio n ( SVN ) ) Syst emT ap - compile server, SystemTap Compile Server - host (compile server host), SystemTap Compile Server - profiling, SystemTap - documentation, SystemTap D ocumentation - introduction, SystemTap - kernel information packages, SystemTap - required packages, SystemTap - scripts (SystemTap scripts), SystemTap - SSL and certificate management, SSL and Certificate Management - automatic authorization, Automatic Authorization - connection authorization (compile servers), Authorizing Compile Servers for Connection - module signing (compile server authorization), Authorizing Compile Servers for Module Signing (for Unprivileged Users) - unprivileged user support, SystemTap Support for Unprivileged Users - signed modules, SystemTap Support for Unprivileged Users - version, What D oes Red Hat D eveloper Toolset Offer? T T asks Pro p ert ies - user interface - Eclipse, Eclipse User Interface T asks View - user interface - Eclipse, Eclipse User Interface t ech n ical o verview - projects - Eclipse, Starting an Eclipse project T elep at h y - KD E D evelopment Framework - libraries and runtime support, KD E4 Architecture t emp lat es ( su p p o rt ed ) - Autotools - compiling and building, Autotools Plug-in for Eclipse t h read an d t h read ed d eb u g g in g - GNU debugger, D ebugging Individual Threads 159 Red Hat Ent erprise Linux 6 Developer G uide T o o l B ar Visib ilit y - integrated development environment - Eclipse, Customize Perspective t o o ls - GNU debugger, Simple GD B OProfile, OProfile Tools Performance Counters for Linux (PCL) and perf, Perf Tool Commands profiling - Valgrind, Valgrind Tools - Valgrind, Valgrind Tools t racked co mmen t s - user interface - Eclipse, Eclipse User Interface U u n p rivileg ed u ser su p p o rt - SystemTap, SystemTap Support for Unprivileged Users u n p rivileg ed u sers - unprivileged user support - SystemTap, SystemTap Support for Unprivileged Users u p d at es - Boost - libraries and runtime support, Boost Updates - GNU C++ Standard Library - libraries and runtime support, GNU C++ Standard Library Updates - Perl - libraries and runtime support, Perl Updates - Python - libraries and runtime support, Python Updates - Qt - libraries and runtime support, Qt Updates u sag e - GNU Compiler Collection - compiling and building, Running GCC - GNU debugger, Running GD B - fundamentals, Simple GD B - libhover - libraries and runtime support, Setup and Usage - Performance Counters for Linux (PCL) and perf, Using Perf - profiling - ftrace, Using ftrace - OProfile, Using OProfile - Valgrind 160 Revision Hist ory - profiling, Using Valgrind u ser in t erf ace - integrated development environment - Eclipse, Eclipse User Interface V Valg rin d - profiling, Valgrind - commands, Valgrind Tools - documentation, Valgrind D ocumentation - plug-in for Eclipse, Valgrind Plug-in for Eclipse - tools, Valgrind Tools - usage, Using Valgrind - tools - cachegrind, Valgrind Tools callgrind, Valgrind Tools helgrind, Valgrind Tools massif, Valgrind Tools memcheck, Valgrind Tools - version, What D oes Red Hat D eveloper Toolset Offer? variab le t rackin g at assig n men t s ( VT A) - debugging, Variable Tracking at Assignments variat io n s an d en viro n men t s - GNU debugger, Alternative User Interfaces for GD B View Men u ( b u t t o n ) - user interface - Eclipse, Eclipse User Interface W wid g et t o o lkit - Qt - libraries and runtime support, Qt wo rkb en ch - integrated development environment - Eclipse, Eclipse User Interface Wo rkb en ch U ser G u id e - Help system - Eclipse, Eclipse D ocumentation wo rksp ace ( o verview) - projects - Eclipse, Starting an Eclipse project Wo rksp ace Lau n ch er - projects - Eclipse, Starting an Eclipse project 161


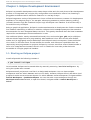
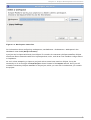
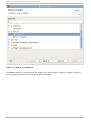
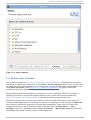
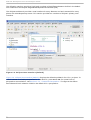

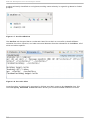
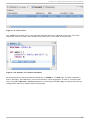
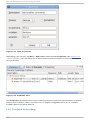
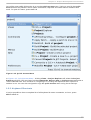


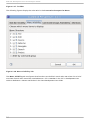
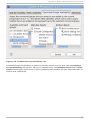


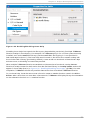


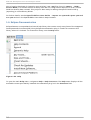
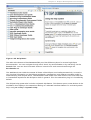
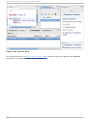

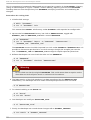
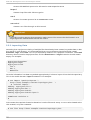
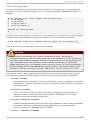


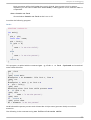
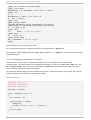


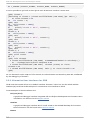


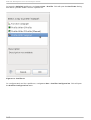
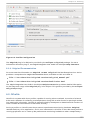
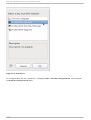


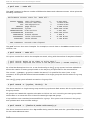
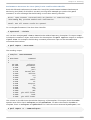
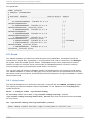


![j:j_"Xt$l"j:]:":,lg]:"r/Human Resources have been duty - e](http://vs1.manualzilla.com/store/data/005657435_1-26d97049bf04f0fd92265d73e45a9ab3-150x150.png)