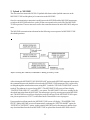
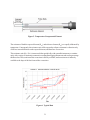
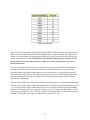
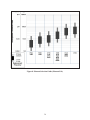
1
MS3500E/3510E
Remote ER Data Logger
Metal Samples Company
A Division of Alabama Specialty Products, Inc.
152 Metal Samples Rd., Munford, AL 36268 Phone: (256) 358-4202 Fax: (256) 358-4515
E-mail: [email protected] Internet: www.metalsamples.com
.
Table of Contents
I.
Introduction ...................................................................................................................... 1
A. Instrument Function Overview ................................................................................. 1
B. Instrument Parts List ................................................................................................ 2
II.
Installation ........................................................................................................................ 3
A. Enclosure and Mounting Details ............................................................................... 3
B. Battery Installation ................................................................................................... 4
C. 4-20mA Loop Installation ........................................................................................ 5
D. Probe-Instrument Connection .................................................................................. 6
E. Data Download Connection(s) ................................................................................. 7
III. Setup and Operation ......................................................................................................... 8
A. Main Menu Overview ............................................................................................. 8
B. Program Setup ...................................................................................................... 10
1. Set Time and Date ..................................................................................... 10
2. Enter Probe ID .......................................................................................... 11
3. Start Data Logging ..................................................................................... 12
C. Measure Probe Function ....................................................................................... 13
D. View Stored Data Functions .................................................................................. 14
E. Set Reading Interval Function ................................................................................ 15
F. Downloading Data ................................................................................................. 16
1. Upload to PC ............................................................................................ 16
2. Upload to MS1500E ................................................................................. 25
G. System Shutdown Function .................................................................................... 26
H. Test Mode Function .............................................................................................. 26
I. Data Interpretation ................................................................................................. 27
1. Probe Reading ........................................................................................... 27
2. Metal Loss ................................................................................................ 28
3. Corrosion Rate .......................................................................................... 28
4. 4-20mA Output ......................................................................................... 29
IV. ER Technique - General .................................................................................................. 30
A. Measurement Theory ............................................................................................ 30
B. ER Sensing Elements ............................................................................................. 32
C. ER Element Performance ...................................................................................... 34
D. ER Probe Body Design ......................................................................................... 38
Appendix A - MS3500E Specifications ................................................................................... 41
Appendix B - Testing the MS3500E/MS3510E with the ER Meter Prover .............................. 42
Appendix C - MS1500E Select Probe ID ............................................................................... 44
Appendix D - Returning an Instrument for Repair .................................................................... 47
Appendix E - Warranty .......................................................................................................... 49
Appendix F - Installation Drawing of MS3500E in Hazardous Location ................................... 50
I. Introduction
A. Instrument Function Overview
The MS3500E/3510E Data Logger is designed to provide a continuous record of corrosive activity in
remote locations that are infrequently visited, such as cross-country pipelines, and unmanned production
platforms. However, this unit finds equal application in locations that are inconvenient or difficult to
access on a regular basis, such as refinery overheads, and flue-gas stacks.
The MS3500E/3510E is completely self-contained with the onboard battery system supplying the total
power requirement for operation. It can be used with any of Metal Samples’ ER probes, or those of all
other major manufacturers. Once in place, it will automatically read the probe at customer-selected
intervals and store the resulting data in the unit’ s onboard memory. The onboard memory will collect up
to 3,100 data points before data download is required. The data collection interval is programmable in
hourly increments. Even at the minimum data collection interval (1 hour), data downloading need only be
performed every ninety days. With more practical data collection intervals (8 - 12 hours), the unit may
be unattended for as long as 6 - 8 months between downloading operations.
An optical, infrared, RS232 communication link is provided for data download to either a PC or Metal
Samples' MS1500E portable ER data logger. Downloaded data may be analyzed, reviewed, or reported by conventional spreadsheet, database, or mathematical software packages.
The infrared communication link is an integral part of the intrinsically safe design of the MS3500E/
3510E. Optical instead of electrical, this unique feature permits data downloading without removing the
instrument or “memory module” from the hazardous area.
Another unique feature of the MS3500E/3510E is the high level of onboard intelligence. The two-line,
20-character LCD allows visual review of all historical data in memory and reads directly as “total metal
loss” and/or “average corrosion rate”. This is in contrast to other commercially available units that store
and display only the raw “resistance ratio” that requires additional manipulation to provide useful and
intelligible data.
The LCD screen, together with the 2-key membrane keypad, provides a user-friendly, interactive,
prompting system that is used for both system setup and data review. This makes the MS3500E the
most advanced unit of its type on the market.
By adding a 4-20mA communication facility, the MS3500E becomes an MS3510E. This allows
continuous transmission of data, via a 4-20mA loop, to a plant computer or central data logger, for
integration with other real-time process parameters. This data transmission can be accomplished without
disruption of the unit’s basic logging and data storage operations. The 4-20mA loop extends the capabilities of the unit to include conventional, in-plant, real-time data communication.
The MS3500E/3510E unit uses a NEMA 4 (IP-65) enclosure, making it suitable for use in the most
extreme of outdoor conditions.
1
B. Instrument Parts List
The MS3500E/MS3510E is supplied with the following accessories.
Part no.
ET0133
Qty.
6
Description
1.5V, AA Dry Cells (Installed)
ET0612
1
4-20ma Loop Connector (MS3510E Only)
IN3500-2
1
Optilink Cable
IN3500-4
1
10 Ft. Probe Cable
IN3500-5
1
Meter Prover
IN3500-6
1
Serial Port Adapter
IN3500-7
1
Operations Manual
Upon receipt of the instrument, the user should verify that the above listed accessories are included.
Any shortage should be reported immediately to:
Metal Samples
Phone: (256) 358-4202
Fax: (256) 358-4515
E-mail: [email protected]
2
II. Installation
A. Enclosure & Mounting Details
The MS3500E/3510E enclosure is fabricated in carbon steel with a baked-on, high-build epoxy
coating. The unit has a hinged door that is secured, when shut, by screw-down clamps that discourage
unauthorized tampering. The enclosure is constructed to NEMA 4 (IP-65) weatherproof standards,
making it suitable for the most rigorous of outdoor environments.
The overall dimensions of the unit are 12-1/4" (height), 9" (width), 4-3/8" (depth), making it a convenient size to mount even in the most confined of locations. For the best results, the instrument should be
mounted within ten feet of the probe location. To facilitate this, the unit has a versatile mounting flange
with four .31" diameter, mounting holes. Overall dimensions and mounting hole centers are shown in
Figure 1.
Figure 1. MS3500E Dimensions
3
B. Battery Installation
The MS3500E/3510E instrument uses six 1.5V, AA size batteries, connected in series, as a primary
power source. While any AA size battery can be used, Duracell or Procell Type MN1500 or PC1500
batteries are required to meet the intrinsic safety certification requirements. Since the MS3500E/3510E
operates in a low power consumption mode between readings, battery life will be a function of the
reading interval and measurement time cycle set by the user. At the most frequent reading interval (1 per
hour), a minimum battery life of four months is to be expected. More practical intervals, such as every
12 or 24 hours, will yield a battery life in excess of twelve months. Generally, to avoid unexpected
power drains, batteries should be replaced once every six months. In the instance of a low reading
interval (1 per 4 hours or less), three monthly battery replacements is advisable.
Batteries are mounted in the back of the MS3500E/MS3510E, behind the instrument screen and
keyboard panel. The batteries are accessed by loosening the two thumbscrews on the right side of the
panel, then swinging the hinged panel open to the left. Care should be used when opening and closing
the panel to ensure that the internal wiring is not pinched or damaged. Once the panel is opened,
batteries can be inserted or removed from the spring-loaded retainer as shown below.
-
-
+
+
-
-
+
+
-
+
-
+
Figure 2. MS3500E Battery Installation
4
C. 4-20mA Loop Installation
The MS3510E is provided with a 4-20mA communication outlet that allows continuous, real-time
integration of ER corrosion data with other process parameters in the main plant computer. The
4-20mA outlet port is a 2-pin military connector (MIL 1 4S-9SF) on the base of the unit, marked
4-20mA. The mating connector for this outlet (ET0612) is supplied as part of the accessories for the
MS3510E unit. The positive lead of the communication loop should be connected to the “A” terminal of
the ET0612 mating connector, and the negative lead to the “B”. The loop can then be connected to the
4-20mA instrument outlet:
Metal Samples
Corrosion Monitoring Systems
OPTI-LINK
DATA PORT
PROBE
4-20
mA
A
A
A
B
VIEW A-A
2-PIN MALE CONNECTOR
(VIEWED FROM SOLDER-SIDE)
PIN 'A' (+ CURRENT LOOP)
PIN 'B' (- CURRENT LOOP)
MS3510E Connections
Figure 3. MS3510E Current Loop Termination
The loop should be powered by 10-24 VDC. For hazardous applications, an appropriate Zener
barrier should be installed in the loop, or power should be supplied from an intrinsically safe repeater
power supply. Typical hazardous installation is shown on page 49.
5
D. Probe-Instrument Connection
The MS3500E/3510E can be mounted directly onto an ER probe, or onto an HA700110-5 probe
adaptor in the case of a retrievable probe used in a two-inch, high-pressure, access fitting (see Figure
12, p. 41). However, in many instances it is either inconvenient or undesirable to mount the instrument
directly onto the probe. For these circumstances a 546810, ten-foot, extension cable is provided. The
extension cable has integral connectors with a guiding keyway to ensure correct pin alignment when
attached. The female connector (MS3106E145-6S) mates with the probe, or HA700110-5 probe
adaptor, and the male connector mates with the central terminal on the base of the MS3500E/3510E
unit.
The length of the extension cable has been carefully determined so as to avoid excessive
signal noise. Longer extension cables should only be employed after consultation with Metal
Samples.
The extension cable provided will mate directly with any Metal Samples’ ER probe or those of any
other major manufacturer, or with an HA700110-5 probe adaptor in the case of retrievable probes.
6
E. Data Download Connection
To download data from the MS3500E to a PC use the Optilink Cable and Serial Port Adaptor.
Note: Do NOT plug the phone jack on the end of the Optilink Cable directly into your PC's
modem.
If a serial port is unavailable on your PC and you wish to connect the MS3500E to your PC via a USB
port, you may use a serial to USB converter. This converter is not included with the instrument, but may
be purchased serparately at major electronics retailers.
To download data from the MS3500E to a MS1500E connect the Optilink Cable directly to the
MS1500E.
Detailed instructions of data downloading are given on p.16.
UPLOAD
TO MS1500
UPLOAD TO PC
(SAFE AREA ONLY)
Metal Samples
Corrosion Monitoring Systems
MS3510E
REMOTE ER DATA LOGGER/TRANSMITTER
MS1500E
MS3500 SERIAL
PORT ADAPTER
Ò
L I S T ED
US
Metal Samples
Corrosion Monitoring Systems
ER Data Logger
1 2 3
4 5 6
7 8
Exit
0
SERIAL TO USB
ADAPTER (OPTIONAL)
MS1500 HANDHELD
DATA-LOGGER
MS3500/MS3510
DATA-LOGGER
TO
COMPUTER
USB
PORT
OPTI-LINK CABLE
TO
COMPUTER
SERIAL
PORT
Figure 4. Data Download Connections
7
Enter
9
III. Setup and Operation
A. Main Menu Overview
Once the batteries are installed in the MS3500E/3510E, the instrument screen may be activated by
pressing either of the keys on the front panel. The company name “METAL SAMPLES” and software
version will appear, then after a few seconds will automatically change to the first of the function screens
that constitutes the main menu.
A series of nine function screens can be accessed simply by scrolling using KEY 1 on the instrument
keypad. Each of the nine function screens allows entry into a submenu to initiate an action such as
MEASURE PROBE or START DATA LOGGING; alternatively it allows input of data such as probe
identification or reading interval.
Each of the function screens and their submenus are fully explained later in the manual. The following
diagram shows the sequence of access to the ten function screens:
8
As explained, each function screen gives access to a submenu, the purpose of which is briefly described
below:
MEASURE PROBE. This will override the normal interval of logging readings to allow
a spot check reading to be obtained on screen.
MEASURE METER PROVER. Used to test the instrument with the Meter Prover.
VIEW STORED DATA. Allows visual review of all readings logged.
START DATA LOGGING. Initiates the data logging process after input of appropriate
start-up data.
ENTER PROBE ID Allows input of probe type and reading interval. Together with "SET
TIME AND DATE". This constitutes initial start-up data.
SET READING INTERVAL. This allows the initial reading interval that is input under
"PROBE ID" to be changed without deleting stored data.
SET MEASUREMENT TIME. This allows the initial measurement (polarization) time that is
input under "PROBE ID" to be changed without deleting stored data.
SET TIME AND DATE. This constitutes the initial step of start-up data, allowing correct
setting of the “real time” clock.
UPLOAD TO MS1500L. This activates the download of stored data to the MS1500L or to
a personal computer.
UPLOAD TO PC. This activates the download of stored data to a personal computer.
SYSTEM SHUTDOWN. This will stop the logging process, and minimize power
consumption without deleting stored data.
TEST MODE. This allows a calibration check of the 4-20mA loop, and supplies instrument
trouble shooting data.
9
B. Program Setup
Having installed the batteries, the MS3500E is ready for start-up programming which compromises the
following sequence:
• SET TIME AND DATE
• ENTER PROBE ID
• START LOGGING
1.Set Time and Date
This operation is illustrated below:
The screen of the instrument is initially activated by pressing either key. The “SET TIME & DATE”
function screen is then accessed by scrolling through the main menu using KEY 1. KEY 2 allows entry
into the submenu, and the time and date setup screen will be shown. Each digit of the time, day, month,
and year is sequentially set using KEY 1 to select the appropriate digit, and KEY 2 to enter the digit
and move the next digit of the time and date sequence.
Once the final digit of the year is entered, using KEY 2, the screen will automatically change to the time/
date display screen. This screen shows the time and date as set up. KEY 2 will accept and store this time
and date. KEY 1 will reject this information. Either key will automatically return the user to the “MEASURE PROBE” screen of the main menu. If the time and date has been rejected, scroll to the “SET TIME
& DATE” function screen, reenter the submenu and make the necessary corrections. If the time and date
are correct, and the user has used KEY 2 to accept the information, scroll to the “ENTER PROBE ID”
function screen to continue with program setup.
Please note that the time and date, once set, should not require alteration except after battery
replacement. Should the user decide to change the time and date while probe data is stored in
memory, all data will be displaced in time and highly inconvenient to interpret.
10
2. Enter Probe ID
This function will allow the user to identify the particular probe type or installation location with a unique,
4-digit tag number. Additionally, it allows the selection of correct probe element geometry, which is
necessary for the instrument’s calculation of metal loss and corrosion rate. Finally, it allows the user to
select the data collection rate. The operational sequence is as follows:
Once the “ENTER PROBE ID” function screen is located on the main menu, KEY 2 will give access to
the submenu. The initial screen of the submenu allows deletion of any stored data. Normally there will
be no data stored, since any useful data set will have been previously downloaded. If no useful data is
stored in the unit, press KEY 1 which will delete all existing data and give access to the Probe ID
screen. If useful data is stored, use KEY 2 to return to the main menu and download existing
data (p. 16) prior to proceeding.
The Probe ID screen allows you to insert a 4-digit identification number for the probe and/or monitoring
location. Each digit is selected with KEY 1, and individually entered with KEY 2.
When the fourth digit of the ID number is entered, the screen will automatically change to the element
identification screen.
The element identification screen shows the Probe ID number and a 5-6 digit/letter sequence that
identifies the probe element geometry and thickness. KEY 1 allows the user to scroll through the
element identifications, and KEY 2 will enter the appropriate element ID once it is located.
It should be noted that the variety of element geometries and thicknesses that is offered by
the various probe manufacturers tends to increase. Consequently it is possible, from time to
time, that the user may encounter a probe element style that is not included in the instrument
look-up table. In such a case, the user may select any of the element geometries in the table,
except wire, that has the same thickness as the element under consideration.
Upon entry of the probe element ID, the screen will automatically change to the data collection rate
screen. This allows the user to select the frequency with which the probe should be read. This can be
set in hourly increments from as high as once per hour to as low as once every 2,475 hours. The reading
frequency is set on the screen as days (two digits) and hours (two digits). The default reading is 1 per
hour. Each digit is selected by a KEY 1 scroll, and individually entered with KEY 2. Once the last hour
digit is entered, the next screen will be displayed which shows the reading frequency as entered, which
can then be accepted (KEY 2) or rejected (KEY 1). If accepted, the screen will revert to the “MEASURE PROBE” function screen, and the user can proceed to the “START DATA LOGGING” function. If rejected, the screen will also revert to the “MEASURE PROBE” function screen, but the user is
11
now required to access the “PROBE ID” function and reset/correct the probe ID, the element ID, and
the reading frequency prior to commencing with the data logging process.
Upon entry of the probe element ID, the screen will automatically change to the data collection rate
screen. This allows the user to select the frequency with which the probe should be read. This can be
set in hourly increments from as high as once per hour to as low as once every 2,475 hours. The reading
frequency is set on the screen as days (two digits) and hours (two digits). The default reading is 1 per
hour. Each digit is selected by a KEY 1 scroll, and individually entered with KEY 2. Once the last hour
digit is entered, the next screen will be displayed which shows the reading frequency as entered, which
can then be accepted (KEY 2) or rejected (KEY 1). If accepted, the screen will revert to the “MEASURE PROBE” function screen, and the user can proceed to the “START DATA LOGGING” function. If rejected, the screen will also revert to the “MEASURE PROBE” function screen, but the user is
now required to access the “PROBE ID” function and reset/correct the probe ID, the element ID, and
the reading frequency prior to commencing with the data logging process.
3. Start Data Logging
This is the set of commands that starts the logging process:
The submenu is entered from the “START DATA LOGGING” main menu function screen, using KEY
2. The first submenu screen is the “SYSTEM READY” screen, from which KEY 2 will start the logging
process and shut down the screen for power conservation. If, for any reason, the user does not wish to
commence logging, KEY 1 will allow escape to the “MEASURE PROBE” screen of the main menu.
Once logging is activated, it will continue until the user activates the system shutdown routine, or the
batteries discharge. In either event, all data collected to this point will be retained, but no additional data
will be collected. Entering a new probe ID will also stop the logging process and eliminate all existing
probe data from the memory; prior to entering new probe ID, ensure that all useful data is
downloaded.
Should logging continue in an uninterrupted fashion until the memory capacity of the unit is full, additional
data will sequentially overwrite the initial data points stored in memory.
The user should always set a download schedule of sufficient frequency so that no more than
3,100 readings are taken between download operations.
Note: Even at the highest frequency (1 per hour), downloading can be scheduled at
intervals as great as 129 without data corruption by overwriting.
12
C. Measure Probe Function
The “MEASURE PROBE” function allows the user to make a spot-check probe reading at any time,
without constraint of the normal logging interval. The submenu sequence is illustrated below:
The first screen of the “MEASURE PROBE” submenu displays the probe ID number, element geometry and thickness. KEY 1 exits to the main menu “MEASURE PROBE” function screen and KEY 2
will activate a measurement.
If KEY 2 is used to activate a measurement, the second submenu screen will be shown that displays the
probe ID, element geometry and thickness, and a “PLEASE WAIT” notation. After approximately 30
seconds, the reading will be complete and the third submenu screen will be automatically displayed. This
screen will show the current probe reading as an integer between 0-1000, and will give a KEY 1 EXIT
option, and a KEY 2 ENTER (save) option. KEY 1 will return the user to the “MEASURE PROBE”
function screen, KEY 2 will save the probe reading and automatically display the fourth submenu
screen.
The fourth submenu screen displays metal loss in MILS and average corrosion rate as MPY. After
approximately 30 seconds, this screen will automatically revert to the “MEASURE PROBE” main menu
screen. This main menu screen will automatically shutdown to the power saving mode after five minutes.
Normal data logging continues throughout the measure probe sequence without interruption.
13
D. View Stored Data Functions
This facility allows all data stored in the MS3500E/3510E to be called up on the screen for review. The
submenu sequence is shown below:
After pressing either key to access the MS3500E/3510E screen, KEY l is used to scroll to the “VIEW
STORED DATA” function screen. KEY 2 is then used to enter the submenu.
The first submenu screen displays the latest reading number, the date of the reading, and the reading in
“probe units”. The reading number is merely the total number of readings stored up to, and including, the
reading displayed. The probe unit reading is an integer from 0 to 1000 that indicates the percentage of
effective probe thickness consumed. Previous readings may be accessed sequentially using KEY 2.
KEY l will exit the review screen and display metal loss (MILS) and average corrosion rate (MPY) for
the reading number displayed when the exit key is used. The metal loss/corrosion rate screen will
display for approximately 30 seconds before automatically returning to the “MEASURE PROBE”
function screen.
The “VIEW STORED DATA” function may be used at anytime without disrupting normal logging.
14
E. Set Reading Interval Function
This function permits the reading interval to be changed at any time during logging without
disrupting the logging process or deleting the stored data. The operation sequence is as follows:
After any key is used to activate the screen, KEY 1 is used to scroll to the “SET READING INTERVAL” main function screen. KEY 2 then allows entry into the submenu.
The current reading interval is displayed as days and hours. Individual digits may be altered using KEY
1, and entered using KEY 2. After the final hour digit is entered, the screen will automatically change to
a reading interval confirmation screen. The interval as entered is displayed. KEY 1 will exit to the
“MEASURE PROBE” main function screen without entering (saving) the new interval. KEY 2 will enter
(save) the new reading interval, then automatically return to the “MEASURE PROBE” main function
screen, further logging taking place at the new reading interval.
15
F. Downloading Data
Data stored in the MS3500E/3510E unit may be downloaded, via the Opti-Link port, directly to a PC.
Alternatively, data may be downloaded to Metal Samples’ MS1500E Hand-Held Data Logger, and
subsequently transferred to a PC. Direct downloading is usually preferred in a control room or
laboratory environment. Where several MS3500E/3510E units are distributed in a field environment,
the data is most conveniently transferred via the MS1500E to a PC. The MS1500E will accept data
from as many as one hundred MS3500E/3510E units for subsequent transfer to a PC.
1. Upload to PC
To transfer data to a PC it is necessary to install the Corrosion Data Management Software.
To run the Corrosion Data Management Software, you need a PC that meets the following
requirements:
•
•
•
•
•
•
•
•
Pentium® class processor
Windows® 95 or higher operating system
16 MB of RAM
10 MB of available hard-disk space
VGA monitor with 800 600 or greater resolution
Mouse or pointing device recommended
Available 9-pin serial port or USB port
CD-ROM drive for software installation
To install the Corrosion Data Management Software:
1. Insert the setup disk provided in your accessory kit.
2. You will be prompted to close any open programs. After you have done so, click OK to
continue.
16
3. Click the install button to begin installation. Note, it is recommended that you install the software in the default directory.
4. After clicking the install button, the software will be installed on your PC.
5. When the software installation is complete you should remove the setup disk, then reboot your
computer.
Instrument Download Center
The Instrument Download Center is a simple tool for retrieving data from Metal Samples ER and LPR
data logger instruments.
To download data from an instrument:
• Connect the instrument to an available PC serial port or USB port (see page 7.)
• Turn the MS3500E on.
• Run the Corrosion Data Management Software
17
•
•
•
•
Open the Instrument Download Center
Select the serial port and instrument
Click the Download button (ensure that Part Status toggles to “On”).
From the main menu of the instrument, select UPLOAD TO PC.
Data will begin to transfer from the instrument to the PC, and will appear in the data window of the
Instrument Download Center as shown above. If the data appears garbled, the wrong instrument type
has been selected. Select another instrument type and try again. If data does not appear in the data
window at all, verify that:
•
•
•
•
•
The instrument is connected to a valid serial or USB port
All cables are securely connected
The message “Port Status: On” appears in the status bar
There are no errors on the instrument
If using a USB adapter, ensure that the device drivers have been installed.
Selecting a Serial Port
Use the Serial Port selection box to select the port to which the instrument is connected. If the COM
port number is unknown, it can be found in Windows Device Manager under “Ports (COM & LPT)”.
Selecting an Instrument
Use the Instrument option box to select the model of Metal Samples instrument being downloaded.
This sets the appropriate communication parameters, which will be displayed in the status bar at the
bottom of the window (“9600,N,8,1” for an MS1500, “2400,N,8,1” for an MS3500).
Downloading Data
To toggle the selected port on and off, click the Download button. Toggling the port on and off will
also clear the data window.
Once a valid serial port and instrument have been selected, click the Download button to turn the port
on and enable the computer to receive data. If a valid serial port has been selected, the status bar at the
bottom of the window will display the message “Port Status: On”. If an invalid serial port has been
selected, an error message will appear, and the status bar will display the message “Port Status: Off”.
If this happens, another serial port should be selected.
18
Saving Data
To save the data in the data window, click the Save button. The data is comma-delimited ASCII text.
It can be saved to a standard text (.txt) file, or it can be saved to a comma-separated values (.csv) file,
which greatly simplifies the process of importing the data into some spreadsheet programs such as
Excel® or Quattro Pro®.
Printing Data
To print the contents of the data window, click the Print button. A print dialog box will be displayed to
allow printer selection and setup.
Charting Data
To chart the contents of the data window, click the Chart Data button. If the data has not yet been
saved, the user will be prompted to do so before the charting process begins. For more information on
charting data, see the Data Analysis section.
Data Analysis
The Data Analysis utility is a convenient tool for charting data from Metal Samples ER and LPR data
logger instruments. The Data Analysis utility can be opened from the Main Menu, or it can be opened
directly from the Instrument Download Center.
If the Data Analysis utility is opened from the Instrument Download Center, the contents of the data
window will be loaded into the chart. However, if the Data Analysis utility is opened directly from the
Main Menu, a valid data file must be loaded. The Select File box will open to allow selection of a data
file.
19
Loading a Data File
After selecting a data file (or clicking the Chart Data button from the Instrument Download Center) a
status window will display the progress of the file being opened, along with the Instrument Type, Probe
Type, and Probe ID for the data file.
Data Table
After a file has been successfully loaded, the data will be displayed in the Data Table for review. By
default, all data points will be included in the chart. However, data points can be turned off, or excluded, from the chart. If the “Excluded” flag appears in the status column for a data point, that data
point will not appear in the chart. To toggle the exclude/include status of a data point, double-click the
data point, or select the data point and click Exclude/Include in the Options menu.
Printing Data
The data table can be printed by clicking Print in the Options menu. A print dialog box will be displayed to allow printer selection and setup.
20
Creating A Chart
To chart the selected data, click the Chart Data button, or select Chart Data from the Options menu.
The chart will be displayed in a new window.
Printing a Chart
A chart can be printed using the Print Chart option in the File menu. A print dialog box will be displayed to allow printer selection and setup.
Exporting a Chart
A chart can be exported to other applications using the Copy Chart option in the File menu. This will
copy both the chart and the raw data to the Windows® Clipboard. The chart can then be inserted into
other applications using the Paste function. Note: In some applications, using the Paste function will
insert the raw data instead of the chart. In this case, use the Paste Special function, then select Picture
to insert the chart.
Chart Tools
•
Statistical Data
The Statistical Data tab at the bottom of the Data Chart window will display a page with statistical
information about the chart data. If the Statistical Data page is visible, this information can be
printed by clicking Print Statistical Data in the File menu.
21
•
Finding A Data Points Value
While viewing the chart, the value of any data point can be determined by simply clicking it. The
value will be displayed in the charts tool-tip box (a small text box that is displayed near the mouse
pointer). If the tool-tip box does not appear immediately after clicking the data point, hold the
mouse pointer stationary over the chart background for a moment.
•
The Tools Menu
The Tools menu contains a collection of utilities for viewing and manipulating the chart. The Tools
menu can be accessed by clicking Tools on the menu bar, or by right-clicking anywhere on the
chart.
o Data Markers
Show Data Markers toggles the data markers on and off.
o Mean Value
Show Mean Value toggles the mean value line on and off.
22
o Trend Line
Show Trend Line toggles the trend line on and off.
o Title/Footnote Setup
Title/Footnote Setup displays a window that allows the chart title and footnotes to be
toggled on and off, and to be modified.
o Plot Setup
Plot Setup displays a window that allows configuration of Y-axis scaling, and of the chart
type.
The Y-axis can be scaled to default values by checking the Auto Scaling option box. The
Y-axis can be scaled to manual values by un-checking the Auto Scaling box, then entering
the desired values in the Minimum and Maximum fields.
The chart type can be set to Line Chart, Bar Chart, or Area Chart by selecting the
appropriate button in the Chart Type box. The default chart type is Line Chart.
o Data Series Color
Data Series Color displays a color selection box, which allows the user to select the brush
color for the plot line. The default color for the plot line is Blue.
o Zoom In
Zoom In allows a region of the chart to be enlarged so that it may be viewed in greater
detail. To enlarge a region of the chart, click on the two data points that define the left and
right boundaries of the region.
In zoom mode, the mouse pointer will change to a cross-hair. When zoom mode ends, the
mouse pointer will return to its normal state.
To cancel zoom mode, click Cancel Zoom In from the Tools menu, or simply press the Esc
key.
23
o Zoom Out
Zoom Out restores the initial view of the chart, which displays the full data set.
o Calculate Corrosion Rate
If the chart contains ER data, the Calculate Corrosion Rate option will become available
under the Tools menu. This option allows the corrosion rate to be calculated between any
two data points on the chart. To calculate the corrosion rate click Calculate Corrosion
Rate, then click two data points. The corrosion rate between those two data points will be
displayed.
In calculate mode, the mouse pointer will change to an arrow/question mark. When
calculate mode ends, the mouse pointer will return to its normal state.
To cancel a calculation, click Cancel Calculate from the Tools menu, or simply press the
Esc key.
24
2. Upload to MS1500E
The user must first connect the IN3500-2 Optilink cable between the Optilink connector on the
MS3500E/3510E and the phone jack connection on the MS1500E.
Once the communication connection is made between the MS3500E and the MS1500E instruments,
switch on the MS1500E and select a probe ID that corresponds to the probe ID of the MS3500E/
3510E in question. The user must now scroll to the communication menu on the MS1500E, and press
enter.
The MS1500E communications submenu has the following screen sequence for MS3500E/3510E
download operations:
*Before executing this command, set MS3500E to “Waiting for Link Up” mode.
After selecting the MS3500E/3510E “DOWNLOAD” option on the MS1500E communications menu,
the communications mode should be selected on the MS3500E/3510E instrument. This is achieved by
scrolling through the main functions menu, using KEY 1, until the “UPLOAD TO MS1500E” screen is
reached. The submenu is accessed using KEY 2. The MS3500E/3510E screen will now display
“WAITING FOR LINK UP”, and a KEY 1 exit option. The MS3500E/3510E is now waiting for the
download instruction from the MS1500E. This instruction is given by pressing enter on the MS1500E
unit. The MS1500E screen will now display the probe ID and type for the MS3500E/3510E in question, plus an option to use “EXIT” to abort the transfer. Data transfer is now in progress.
Upon completion of data transfer, the MS3500E/3510E screen will display “TRANSFER COMPLETE” and the MS1500E screen will automatically exchange the “EXIT TO ABORT” option for
“ENTER TO CONTINUE” option. At this point the MS1500E can be disconnected, and the client
may download data from the next MS3500E/3510E or upload data from the MS1500E to the PC.
25
G. System Shutdown Function
This function allows the user to suspend the logging process for any period of time without data
loss. The menu screen sequence to operate the function is as shown below:
To activate the “SYSTEM SHUTDOWN” function, the user should scroll through the main function
screens using KEY 1 until the “SYSTEM SHUTDOWN” function screen is reached. The user can now
use KEY 2 to access the submenu. The screen will now ask for confirmation. KEY 2 will activate
system shutdown; KEY 1 will return the user to the main function screens. If KEY 2 is used to activate
“SYSTEM SHUTDOWN”, data logging will cease but all existing data will be retained in memory.
When the user wishes to reactivate the logging process, either key can be used to access the screen,
and KEY 1 will then resume the logging process.
H. Test Mode Function
The test mode function is used for factory trouble shooting of faulty instruments returned for repair and
in initial quality assessment of newly manufactured instruments. This function is not required for
normal instrument operation.
26
I. Data Interpretation
The MS3500E supplies corrosion data in several formats:
• Probe Reading (‘Probe Life Units’)
• Metal Loss
• Corrosion Rate
• 4-20 mA (MS3510E)
1. Probe Reading
This information is available through the “MEASURE PROBE” (see p. 13) menu for current reading,
and through the “VIEW STORED DATA” (see p. 14) for historical readings. The probe reading,
commonly known as ‘probe life units’ (PLU), is an integer between 0-1000 and represents the percentage of the effective probe element thickness consumed since the probe was inserted into the corrosive
system. This value is most commonly used to calculate metal loss and/or corrosion rate, as shown
below:
ML =
CR =
ML
X
X2
X1
T
CR
K
=
=
=
=
=
=
=
XxK
1000
..............................................(1)
(X2 - X1) x K x 365
1000 x T
........................(2)
METAL LOSS IN MILS
INSTRUMENT READING AT ANY GIVEN TIME
INSTRUMENT READING AT TIME t2
INSTRUMENT READING AT TIME t1
TIME LAPSE (DAYS) BETWEEN READINGS X1 AND X2
CORROSION RATE IN MILS PER YEAR
PROBE CONSTANT
Table 1 gives probe constants for most common probe element geometries:
27
Table 1. Probe Constant
2. Metal Loss
The metal loss value is available both through the “MEASURE PROBE” and “VIEW STORED DATA”
functions, and is shown as MILS (1 MIL = 0.001 inches). The instrument automatically performs the
calculation shown in equation 1, p. 27, and displays the result on the MS3500E/3510E screen.
The metal loss value shown is the total metal loss since the probe was new. Consequently, this
value is only valid when the probe used is initially installed as new. If a partially consumed probe
is attached to an MS3500E/3510E to perform a logging sequence, the MILS value shown will be an
overestimation of metal loss at the present locations by an amount equivalent to the thickness loss prior
to the commencement of logging operations.
3. Corrosion Rate
This value is also available through the “MEASURE PROBE” and “VIEW STORED DATA” functions
and is expressed as MPY (1 MPY = 0.001 inches per year). This value is calculated on the basis of
equation 2, p.27.
Again, the calculation is an average corrosion rate assuming an as new condition for the probe
element at the beginning of the logging sequence.
28
4. 4-20mA Output
The current loop on the MS3510E unit will send a continuous measure of the current probe reading.
This is a linearized signal that can easily be converted to ‘probe life units’ (PLU) at the receiving
device by applying the following simple algorithm:
PLU =
(A-4) 1000
16
.............................. (3)
A = Loop Current in mA
Total metal loss (ML) may be derived from:
ML =
(A - 4) K
16
................................................... (4)
A = Loop Current in mA
K = Probe Constant
Corrosion rate (CR) may also be derived as:
CR =
(A2 - A1) K x 365
16 (T2 - T1)
................................................ (5)
A2 = Loop Current at Time T2
A1 = Loop Current at Time T1
T2 = End Time (Days)
T1 = Start Time (Days)
K = Probe Constant
29
IV. ER Technique - General
A. Measurement Theory
The reduction in cross-sectional area of an element of metal or alloy as it corrodes is accompanied by a
corresponding increase in the electrical resistance of the element. The relationship is given by:
R = p x L/A .......................................(6)
R = element resistance
P = specific resistivity of the element alloy
A = element cross-sectional area
L = element length
Consequently, periodic resistance measurements of a metal/alloy element that is continuously exposed to
a corrosive environment, will provide data on the rate and extent of corrosion for that alloy/environment
combination.
In practice, resistance is also a function of temperature. Therefore, electrical resistance corrosion probes
need some means to compensate for the spurious effects of temperature change. This is achieved by
constructing the probes with an exposed element that freely corrodes and a reference element that is
protected within the body of the probe and not subject to corrosion. Such a construction is illustrated in
Figure 5.
30
Figure 5. Temperature Compensated Element
The resistance of both the exposed element (RExp) and reference element (RRef) are equally influenced by
temperature. Consequently, the resistance ratio of the exposed to reference elements is a function only
of the loss in metal thickness on the exposed element, and therefore of corrosion.
This resistance ratio (RExp / RRef) is measured either periodically with a portable instrument, or continuously with a variety of continuous, automatic recording/data logging instruments and read as percentage
thickness loss. Thus, total metal loss versus time is directly available, and corrosion rate is indirectly
available as the slope of the line for metal loss versus time.
Figure 6. Typical Data
31
B. ER Sensing Elements
Electrical resistance probe elements are offered in a variety of thicknesses and geometries. The most
common are illustrated below:
Wire Loop
Cylindrical
Tube Loop
Flush
Figure 7. Element Styles
Tubular loop elements are constructed from thin-walled tubing. Their small cross-section allows fast
response at low corrosion rates.
Wire loop elements, constructed of solid wire, provide a good compromise between sensitivity and long
life. They are typically used for systems exhibiting moderate corrosion rates (5-20 mpy).
Cylindrical elements are made from hollow cylinders and are extremely robust. They are widely used in
high temperatures and high flow rate conditions. They tend to be sensitive to noise and somewhat
sluggish in response. Consequently, they are only recommended for moderate to high corrosion rates
(20-50 mpy).
Flush elements are designed to be located flush with the corroding surface of the vessel/pipe, consequently, most closely simulating true corrosion rates. The flush element is useful in high flow regimens
and operating conditions where internal obstructions are not permissible, e.g., pigged pipelines.
32
The mechanism for sealing elements into probe bodies varies. For example, the cylindrical type elements
are sealed with an all metal weld, whereas flush elements are sealed with an epoxy seal. The sealing
mechanism of the element is a primary factor in determining the temperature and pressure rating of an
ER probe.
Table 2 provides a guide to temperature and pressure limitations for various element designs.
Table 2. Element Temperature and Pressure Ratings
Note: The temperature and pressure limitations given above may be subject to modification according to
the probe body design. This is discussed later in this manual.
A final issue with respect to sensing elements is material of construction. Generally, this should be
selected to most nearly match that of the plant or equipment under consideration. Almost any geometric
configuration and thickness of element can be made in any commercially available alloy. However, some
alloys, particularly in the glass sealed loop version, may be costly and have a considerable delivery time.
33
C. ER Element Performance
The basic ER measurement gives percentage of metal thickness loss and is a function of the original
element thickness. Essentially, total metal loss and corrosion rate are given by the following functions:
ML =
CR =
ML
X
X2
X1
t
CR
K
=
=
=
=
=
=
=
XxK
1000
........................................................ (7)
(X2 - X1) x K x 365
1000 t
............................................ (8)
METAL LOSS IN MILS
INSTRUMENT READING AT ANY GIVEN TIME
INSTRUMENT READING AT TIME t2
INSTRUMENT READING AT TIME t1
TIME LAPSE (DAYS) BETWEEN READINGS X1 AND X2
CORROSION RATE IN MILS PER YEAR
PROBE CONSTANT
The probe constant K is a function of the element thickness and geometry. Table 3 lists the K factors
for various common elements.
34
Table 3. K Factors
Some of the newer instruments, the MS1500E and MS3500E/3510E in particular, perform metal loss
and corrosion rate calculations automatically and display these as a direct reading. These instruments
contain a selectable library of element geometries that, once selected, are automatically fed into metal
loss corrosion rate calculations. Should the user not find the element geometry specific for the
probe in use, he can select any geometry (except wire) of the same thickness in order to
obtain valid results.
Two key performance characteristics for a particular element style are element life and response time.
The element life is directly proportional to its thickness, whereas response time, which is the time
required to obtain a significant reading change at a given corrosion rate, is inversely proportional to
element thickness. Thus, the user must make some compromise between life and response time when
selecting a sensing element. Figures 8 and 9 provide a general guide for selecting optimum life and
response time combinations.
The other major performance characteristic related to element geometry is measurement reproducibility.
Under ideal circumstances the measurement reproducibility will match the instrument resolution, which is
+0.1% for most commercially available units. However, low resistance elements in systems exhibiting
frequent (30-60 minute cycle), and comparatively large (±10-15°F), temperature fluctuation may only
achieve a reproducibility of +0.5%. Such low resistance elements should be avoided when temperature
instability is anticipated, unless high corrosion rates are expected (20+ mpy).
35
Figure 8. Element Selection Guide (Element Life)
36
37
Figure 9. Element selection guide (response time)
D. ER Probe Body Design
ER probe bodies may be made in almost any design and material. Metal Samples frequently supplies
custom probe designs for atypical applications. However, a standard range of designs are available that
will cover the majority of uses. These standard designs are discussed in the following paragraphs.
The fixed length probe, which has a body constructed in 316L stainless steel, is a general purpose
probe construction. The probe comprises a welded flange or NPT pipe plug entry on a cylindrical shaft.
The probe is available in a variety of insertion lengths, although no length adjustment is available; hence
the name “fixed-length” probe.
Wire, Tube or Strip
Loop Element
Figure 10. Fixed Length ER Probe
This probe is available in all element styles, but for pipe plug entry, the flush element varieties can only
be accommodated on bushing sizes of 1½" NPT or greater. Pressure and temperature ratings are 3000
PSI and 500°F for pipe plug entries, whereas flanged entries are controlled by the flange rating. The
major limitation of this design is that the system needs depressurization prior to insertion or removal of
the probe.
38
Retractable probes are the industry standard in refinery and petrochemical plants. The probe body is
constructed in 316L stainless steel and compromises a one inch FNPT packing gland with a cylindrical
probe shaft. Four basic probe lengths are available: 18", 24", 30", and 36". The actual insertion depth
into the system varies depending on the mating pipe.
However, the insertion is adjustable through the packing gland to provide any desired insertion. The
retractable probe is inserted into the system through a customer supplied ball valve and can be inserted
or removed from pressurized systems without shutdown. Retractable probes can be operated at
pressures to 1500 psi and 500°F. Metal Samples' Easy Tool is recommended for probe insertion or
retraction in systems with pressure over 150 pounds.
All element configurations are available for retractable probes and most can be accommodated through
a 1" full-port valve. Flush element probes, however, require a 1½" full-port valve.
Safety Chain
Packing Gland
Assembly
Nipple
Bleed Valve
Retractable ER Probe
1” Full Port
Valve
Velocity Shield
(Optional)
Safety Nut
Figure 11. Retractable ER Probe
39
The retrievable probe is widely used in the oil and gas production and transmission industry and is part
of a specially designed retrievable system. The probe is carried on a specially designed plug and inserted through a welded or flanged access fitting as shown in Figure 12.
The retrievable probe, which is normally constructed in AISI 316L stainless steel, can be inserted and
removed from systems operating up to 3600 psi without system shutdown. This is achieved by using a
portable valve and retrieval tool that can be moved from probe location to probe location as insertion or
removal is required.
Probe Adapter
Cover
HP Hollow Plug
Assembly
HP Access Fitting
Retrievable ER Probe
(Shown with Velocity Shield)
Figure 12. Retrievable ER Probe
40
Appendix A - MS3500E Specifications
Model
MS3500E - Remote ER Data Logger (Ordering # IN3500)
MS3510E - Remote ER Data Logger w/ 4-20mA Current Loop Output (Ordering # IN3510)
Physical Data
Instrument Weight:
Total Weight w/ Accessories:
Instrument Dimensions:
Case Specifications:
Mounting Specifications:
Operating Temperature:
Storage Temperature:
Performance Data
Measurement Type:
Range:
Resolution:
Cycle Time:
Electrical Data
Power Requirements:
Max. Probe Cable Distance:
Output Specifications:
11.94 lb. (5.42 Kg)
13.64 lb. (6.19 Kg)
11.50"H x 8.94"W x 4.00"D (29.21cm x 22.71cm x 10.16cm)
NEMA-4
10.75"H x 6"W (27.31cm x 15.24cm) Bolt Pattern
0.3" (0.76cm) Diameter Bolt Holes
32° to 122°F (0° to 50°C)
-4° to 158°F (-20° to 70°C)
ER measurement using any standard ER probe type (Wire Loop,
Tube Loop, Cylindrical, Flush, Strip, etc.)
0-1000 digits representing 0-100% of probe life
1 digit
1 Hour to 99 Days
Six 1.5V AA Batteries
10 ft (3.05 m)
RS-232 Output in Comma-Delimited ASCII Text Format
4-20mA Current Loop Output (MS3510E Only)
Class I, Division 1Groups A, B, C, and D
Temperature Code T3C
Class I, Zone 0,
Group IIC, T3C
Conforms to ANSI/UL Std. 913
Special Features
• Microprocessor-based electronics
• Data storage capacity of 3100 readings, with battery backup
• Menu-driven interface using a 2-key keypad and a 2-line LCD display
• Low-battery detection
Accessory Items
10' Probe Cable, Meter Prover, Communications Cable and Connector, Current Loop Connector
(MS3510E only), Operation Manual
41
Appendix B - Testing the MS3500E/MS3510E
with the ER Meter Prover
An ER Meter Prover is provided to allow routine checks of the MS3500E/MS3510E instrument. The
ER Meter Prover simulates a Wire Loop type ER probe at a fixed value which is printed on the Meter
Prover label (as shown below.)
The Meter Prover can be used to test the instrument and the probe cable simultaneously. To test the
instrument and probe cable:
1) Connect the probe cable to the instrument, and then connect the ER Meter
Prover to the end of the probe cable.
2) Select “MEASURE METER PROVER” from the main menu of the
instrument and press ENTER.
3) Allow the measurement to finish. The measured value should be close to
the value printed on the ER Meter Prover label (+/- 10 probe units is
typical, but may vary more depending on ambient conditions at the time.)
If the instrument measures close to the printed value on the Meter Prover label
then the instrument and cable are both working properly and no further testing
is required. If there is a significant difference in the measured value, or if you
get an error, continue testing as follows:
4) Disconnect the ER Meter Prover from the probe cable.
5) Disconnect the probe cable from the instrument.
6) Connect the ER Meter Prover directly to the instrument as shown to the
right.
7) Repeat steps 2 and 3 above.
8) If the instrument measures the ER Meter Prover correctly during this test
then there is likely a problem with the probe cable and it should be tested
further, or replaced.
9) If the reading still shows a significant difference compared to the printed
Meter Prover value, or still reads an error, then there may be a problem
with the instrument and further troubleshooting may be required.
42
It is important to note that the ER Meter Prover is only a check probe used to verify general instrument
operation. It is not a calibration standard. The measured value may differ from the listed value as
explained in step 3 above.
It is also important to note that each ER Meter Prover is serialized to match the instrument it is shipped
with, and its measured value may differ if it is used with another meter. If it is necessary to use an ER
Meter Prover with another meter, it is recommended that you establish a baseline value for the ER
Meter Prover with the other meter.
43
Appendix C - MS1500E Select Probe ID
Select a probe before you run a function
In order for you to make measurements, compute mil/mpy or recall or delete readings, you must select a
probe that is currently in memory.
The MS1500E provides you with a list of probes in memory; use the arrow key to select on and press
enter. Now you’re ready to run any other function.
The “SELECT PROBE ID” function allows you three options:
• select a probe already in memory for which you wish to run any other feature of the
MS1500E (Make Measurement, Compute mil/mpy, Recall Readings, or Delete
Readings);
• enter into memory the identification of a new probe
• delete from memory the identification of a probe
To run any of these three options, choose SELECT PROBE ID from the Main Menu. The next screen
allows you to choose the functions to ENTER or DELETE a probe ID or to select a probe ID from
those already in memory for which you wish to make measurements. When transferring data from an
MS3500E unit, the user will invariably select a new Probe ID.
SELECT PROBE ID
MAKE MEASUREMENT
COMPUTE MIL / MPY
RECALL READINGS
To assist you with selecting a probe ID, the screen displays a list of all probe IDs currently in memory.
Select from the list of probes in memory the probe for which you wish to run a function (Make Measurement, Compute mil/mpy, Recall Readings, Delete Readings) or enter a new probe ID.
44
Entering information
To enter a number, type it using the keypad numbers. If you make an error, press the down arrow which
allows you to type the number again. Pressing the up arrow retains the ID number you typed in.
Entering probe type
The MS1500E has a list of probe types in memory. Select one by pressing the arrow keys. (See
p. 28 for a list of probe types supported by the MS1500E.)
ENTER NEW PROBE
DELETE PROBE
1234 WIRE 40
4567 FLUSH 20
1. Press the arrow key to select a probe ID.
2. Press ENTER.
To enter the ID of a new probe, select ENTER NEW PROBE; the next screen allows you to enter the
ID number and the type.
1.
2.
3.
4.
Enter the probe ID - use the number keys (press the DOWN arrow if you make an error).
Press the UP arrow when you’ve entered the correct ID number.
Enter probe TYPE.
Press ENTER.
45
Deleting Probes
It’s necessary to delete a probe when you replace one. Note that when you delete a probe, you also
delete all the readings for that probe.
You might want to transfer the readings to a computer before deleting them by using the COMMUNICATIONS option in the Main Menu (see COMMUNICATIONS in the MS1500E manual).
PROBE ID
:D385
PROBE TYPE :WIRE 40
USE ARROW KEYS
It is occasionally necessary to remove the ID of a probe from memory, for example:
• when the memory bank is full
• when a probe is no longer used
• when MS3500E/3510E probe data has been downloaded from the MS1500E to a PC
To delete the ID of a probe in memory, select DELETE PROBE.
DELETE PROBE
PROBE ID
:
UP ARROW WHEN DONE
1. Enter the probe ID - use the number keys (press the DOWN arrow if you make an error).
2. Press the UP arrow when you’ve entered the correct ID number.
The instrument will confirm your choice of probe ID before deleting it from memory.
46
Appendix D - Returning the Instrument for Repair
A. Returning an Instrument for Repair
If it is necessary to return any Metal Samples instrument for repair, the following procedure is recommended to ensure the fastest possible repair and return cycle. You may contact Metal Samples to verify
that returning the instrument is necessary.
1. If possible, pack the instrument in the original shipping carton. If the original carton is not available,
pack the instrument in a rigid cardboard or wood carton. Surround the instrument with a minimum
of three inches of resilient packing material such as foam rubber or shredded newspaper.
2. Ship the instrument prepaid via air freight or air express to:
Metal Samples
152 Metal Samples Rd.
Munford, AL 36268
3. Contact Metal Samples by telephone (256) 358-4202 or fax (256) 358-4515 and tell them:
a. the name of the airline carrying the instrument
b. the flight number
c. the estimated time of arrival
d. the waybill number and delivery instructions
4. When the instrument is packed, include a copy of the form on the next page, filled in as required to
expedite the repairs.
47
Maintenance and Repair Instructions
This form may be photocopied for use when returning instruments to Metal Samples for repair.
Please fill in all known information. Enclose a copy of the filled in form with the instrument.
1. Check one:
Repair this instrument under warranty.
Repair this instrument regardless of problem or cost of repair.
Inspect the instrument and advise the customer of the approximate cost of repairs if the
instrument is not covered under warranty. (Note: This procedure may delay the return of the instrument to you.)
2. Instrument Identification:
Instrument Model #
Serial #_________________
Date and Location of Purchase_____________________________________
Company’s Purchase Order # for Original Sale_________________________
3. Return the Instrument to:
Company Name ________________________________________________
_____________________________________________________________
Address/Location ______________________________________________
____________________________________________________________
Telephone Number:____________________________________
4. Description of Trouble: (a clear description of the problem may shorten repair
time)_______________________________________________________
___________________________________________________________
___________________________________________________________
5. Urgency of Repairs: ___________________________________________
___________________________________________________________
___________________________________________________________
48
Appendix E - Warranty
Metal Samples warrants that any part of their corrosion rate instruments and accessories which proves
to be defective in material or workmanship within one year of the date of original shipment to Purchaser
will be repaired or replaced, at the option of Metal Samples, free of charge. This warranty does not
cover (1) probe assemblies, (2) items expendable in nature, or (3) items subject to damage from normal
wear, misuse or abuse, or failure to follow use and care instructions.
All damaged items are to be shipped at Purchaser’s expense to and from Metal Samples. Metal
Samples shall have the right to final determination as to the existence and cause of the defect.
The foregoing shall constitute the sole and exclusive remedy of any purchaser of Metal Samples
products for breach of warranty and is exclusive and in lieu of all other warranties, expressed, implied
or statutory, including the implied warranties or merchantability and fitness. In no event shall Metal
Samples be liable for special or consequential damages or for any delay in the performance of this
warranty due to causes beyond its control.
Orders or requests for additional information should be addressed to:
Metal Samples
152 Metal Samples Rd.
Munford, AL 36268
Telephone: (256) 358-4202
Fax: (256) 358-4515
E-mail: [email protected]
The technical information and suggestions contained herein are believed to be reliable, but they are not
to be construed as warranties since conditions of use are beyond our control.
49
152 Metal Samples Rd., Munford, AL 36268
Phone: (256) 358-4202 Fax: (256) 358-4515
ALABAMA
SPECIALTY
PRODUCTS, INC.
Installation Drawing
of MS3500E in
Hazardous Location