1
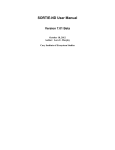
User’s Manual for Resinosa
An Interactive Density Management Diagram for Red Pine in the Lake States
Prepared by
Timothy J. Mack and Thomas E. Burk
Staff Paper Series Number 158
Department of Forest Resources
College of Natural Resources
and
Minnesota Agricultural Experiment Station
University of Minnesota
St. Paul, Minnesota
Research supported by Minnesota Agricultural Experiment Station
project 042-44 and the Hugo J. and Helen K. Pawek Graduate Fellowship.
Authors are Graduate Research Assitant and Professor, Department of Forest Resources,
University of Minnesota, St. Paul, MN 55108
Table of Contents
Table of Contents............................................................................................................................ 2
Overview......................................................................................................................................... 3
Requirements .................................................................................................................................. 3
Downloading Resinosa ................................................................................................................... 3
Getting Started with Resinosa......................................................................................................... 3
Specifying the Management Assumptions...................................................................................... 6
The Establishment Panel............................................................................................................. 7
The Economics and Utilization Menu ........................................................................................ 8
The Button Controls.................................................................................................................... 9
Modeling Price Appreciation........................................................................................................ 10
Defining Stand Management Regimes ......................................................................................... 11
Thin Within Stand Density Ranges........................................................................................... 11
Defining Custom Thinning Regimes ........................................................................................ 12
Outputs.......................................................................................................................................... 14
DMD with Trajectory ............................................................................................................... 14
Graphs ....................................................................................................................................... 15
Model Details............................................................................................................................ 16
Economics................................................................................................................................. 18
References..................................................................................................................................... 21
Appendix: Application of a density management diagram for Lake States red pine management.
....................................................................................................................................................... 22
2
Overview
Resinosa is an interactive Density Management Diagram (DMD) designed to assist foresters with
the evaluation of red pine management alternatives. Unlike traditional DMDs, Resinosa is a
model based DMD incorporated within a Microsoft Excel workbook. The chief advantage to
this approach is that it frees the forester from the tedium and inaccuracies of the pencil and paper
approach necessary with the traditional DMD. Management scenarios can be tested quickly and
easily using a set of menus designed with Excel’s Visual Basic for Applications tools. Data
input is aided by menus, allowing those unfamiliar with Excel to quickly take advantage of
Resinosa’s capabilities. This manual was written under the assumption that readers already
possess basic knowledge of general forestry and economic analysis.
Requirements
Resinosa works with any version of Microsoft Excel 2000 or later. Users are strongly
discouraged from attempting to run Resinosa with earlier versions of Excel.
Downloading Resinosa
If you haven’t done so already, you can download Resinosa from
http://mallit.fr.umn.edu/burk/resinosa. Because Resinosa is not a stand-alone executable
program like many conventional growth and yield models, it does not require installation or
registration with your operating system. When downloading, simply save Resinosa to the
directory where you will use it.
Getting Started with Resinosa
Once downloaded and saved, Resinosa can be opened like any ordinary Excel workbook. It is a
highly automated workbook built around the Visual Basic for Applications language. Because of
this, when Resinosa is first opened you may be prompted to enable macros. Should this prompt
appear on your screen you should choose Enable Macros; Resinosa will not work otherwise.
Resinosa will also not work when Excel’s macro security is set too high. If this is the case,
choose Tools / Macro / Security from Excel’s menu bar and set the security level to Medium or
Low.
Resinosa works best when Excel’s application window is maximized. Setting your screen
resolution to 1024 x 768 or higher is recommended for best display of the interactive menu
system. It is also recommended that Resinosa be run without any other Excel workbooks open.
Failure to do may result in Visual Basic run-time errors.
3
Figure 1. Resinosa’s opening screen.
Resinosa is a workbook composed of five worksheets: DMD with Trajectory, Graphs, Model
Details, Economics, and Price Appreciation (Figure 1). A brief description of each follows:
DMD with Trajectory: This is the first thing you will see after opening Resinosa
(Figure 1). It is Resinosa’s main output screen. This is the interactive DMD.
Graphs: Resinosa offers additional graphs besides the DMD. These graphs are stored in
the Graphs worksheet.
Model Details: This worksheet contains the workings of the growth and yield model.
All growth and yield data produced by Resinosa originate from here.
Economics: This worksheet contains a detailed discounted cash flow analysis for the
current management scenario.
Price Appreciation: This worksheet is used to model price appreciation trends for
economic analyses.
4
Figure 2. Accessing Resinosa’s Forestry menu.
Resinosa is controlled through a set of menu windows. The menu system is accessed from a
special pull down menu called Forestry, located at the top of Excel’s application window.
Forestry will not appear if your macro security level is set too high. Refer to the Getting
Started with Resinosa section for instruction to fix this. Forestry appears between Excel’s
standard Chart and Window menus (Figure 2). Forestry contains three items: Management
Assumptions, Grow Bounded, and Grow Custom. Selecting Management Assumptions
brings up a window that allows you to enter starting stand conditions and any economic
assumptions you might wish to model. Grow Bounded allows you to set up a thinning schedule
for your stand and project it using the DMD approach to thinning. Refer to the appendix for an
example of this approach. Grow Custom allows you to interactively define a management
regime for your stand.
One advantage to the workbook approach is that Resinosa can be renamed or copied to as many
places on your computer as you wish. This is especially useful when comparing multiple
management scenarios that you may wish to refer to again in the future.
5
Specifying the Management Assumptions
Before you can run a simulation in Resinosa you must first provide some basic starting
assumptions. The minimum requirements for a growth and yield simulation include site index,
establishment age, trees per acre, and quadratic mean DBH. If you wish to perform an economic
analysis, you must also enter information pertaining to the timing of silvicultural prescriptions,
costs, revenues, and any price appreciation trends you wish to model. Most of this is handled
within the Management Assumptions Window, which can be displayed by choosing
Management Assumptions from the Forestry menu.
The Management Assumptions window contains two tabbed panels for entering starting stand
conditions and economic assumptions; the panels are entitled Establishment and Economics
and Utilization (Figure 3). The panels appear stacked upon each other within the Management
Assumptions window. To activate one or the other simply click on its tab near the top of the
window. You enter the starting conditions for a stand, as well as any silvicultural assumptions
associated with its establishment in the Establishment panel. Note that all input and output
values from Resinosa are on a per acre basis. The second panel is entitled Economics and
Utilization (Figure 4). This is where additional economic assumptions are specified for
economic analyses. This panel is also where you enter merchantability limits for up to two
product types.
Figure 3. The Establishment panel within the Management
Assumptions window.
6
The Establishment Panel
Planting Assumptions: This is the first section appearing in the Establishment panel. Data
entered in this section are required solely for economic analyses. This is where you specify
planting costs and the number of trees per acre to be planted. The value you provide for Trees
Planted per Acre is not used by the growth model. The stems per acre value used in the growth
model is provided under the section of the panel entitled Starting Assumptions. Any cost
assumption entered here or elsewhere in Resinosa should always be entered in current dollars.
Timing and Costs: This section allows you to specify the timing and costs for up to seven
different silvicultural activities. For each activity you must specify the name of the activity, the
age when it occurs, and its per acre cost. The names of any activities specified here also appear
elsewhere in Resinosa. Resinosa assumes all activities, costs, and returns occur at the end of the
year in which they are scheduled. For example, the stand defined in Figure 3 is to be raked in the
beginning of year one, then trenched and planted at the end of year one, and released at the end
of year two.
Starting Assumptions: The four items provided here represent the minimum required amount
of information needed to run Resinosa. Here you must provide Resinosa with the starting age
and condition of the stand to be projected. Site index is required for the modeling of height
growth. It is also used to calculate quadratic mean DBH when you specify the Default DBH
option. All site indices are base age 50 years.
The starting age specified here is used by the growth model to project the stand. Like many
growth models, Resinsoa is not calibrated to model young stands. The model works best when
provided with starting conditions for stands 20 years or older. Resinosa automatically matches
starting age from the growth model with that of any economic analyses you start at younger ages.
This ensures that all yields from the model are matched correctly within the cash flow worksheet.
As with age, the number of stems per acre specified here is used by the growth model as a
starting condition. This number represents the number of surviving trees per acre present at the
starting age. It should generally be less than the number provided under the Planting
Assumptions section. You must also provide the model with a starting quadratic mean DBH. If
you are unsure of the proper DBH to use, press the Default DBH button and Resinosa will
calculate diameter for you. Mean diameter is calculated as described by Benzie (1977). Basal
area is calculated automatically as a guide and updated each time the stems per acre or diameter
text boxes are changed.
7
The Economics and Utilization Menu
Other Costs: This section of the Economics and Utilization panel allows you to specify
additional management costs. Overhead per acre represents the sum of any yearly costs
associated with management. Property tax per acre allows you to include the effects of any
yearly property taxes the stand may incur. Both items are assumed to occur for every year in the
planning horizon. If applicable, severance taxes are modeled on a percentage basis. For
example, entering 10 percent in the severance tax textbox causes a 10 percent tax to be assessed
on all harvest revenues.
Percentage Rates: Here is where you enter assumptions regarding the discount and inflation
rates used for the economic analysis. If you choose to model inflation be sure to also provide a
nominal discount rate. Resinosa will not automatically add inflation to your discount rate.
Land Value: Resinosa uses land value in the calculation of the soil expectation value (SEV).
The land is assumed to be sold upon completion of the rotation.
Figure 4. The Economics and Utilization panel within the Management
Assumptions window.
8
Timing: The default starting age for an economic analysis is age zero. To use a different age,
simply enter it under the Timing section. Resinosa will automatically reconcile yields from the
growth model with the times used within the planning horizon. Note that the economic starting
age may not exceed the model starting age.
Stumpage Revenues: Resinosa allows for the merchandizing of two products. Cords and
thousand board feet (MBF) are the default products. To use a different set, simply enter a new
set of names and prices under Stumpage Revenues and change the corresponding utilization
limits under the Utilization section. Changing the product names here also changes them
throughout the rest of Resinosa.
Utilization: This section allows you to define the merchantability limits for the two products
Resinosa is capable of tracking. Specify diameter outside bark for the DBH limits and diameter
inside bark for the top limits. Resinosa reports all volumes on a tree-length basis. No attempt is
made to handle the effects of bucking on realized yield. Also, all yields are reported as gross
volumes. No attempt is made to consider cull. The conversion factors define the number of
cubic feet of solid wood per unit of product. The factors can be changed to match any product
you might define. The default conversion factor for merchantable cubic foot volume to cords is
79 cubic feet per cord. Default MBF volume is calculated in the same manner, with a conversion
factor of 176.2 cubic feet per MBF1.
The Button Controls
Save: The Save button at the bottom of the Management Assumption window saves any
changes you have made to the Establishment or Economics and Utilization panels. Pressing
Save will save any changes made to both panels, regardless of the menu currently active.
Close: The Close button closes the Management Assumptions window. Close does not save
any changes made to the window since the last save.
Reset Defaults: The Reset Defaults button resets all of the information found in the
Management Assumptions window to Resinosa’s default settings. Any changes made to the
settings in the window are automatically saved each time you press Save. If you save Resinosa
to disk before closing the workbook the last changes will be in effect the next time you open that
copy of Resinosa.
1
176 board per cubic feet per MBF is derived from Table 4-3 “Number of rough cords per thousand board feet,
Lake States” of Avery and Burkhart (1983). A simple average of 2.23 cords per MBF was calculated from the
conversion factors listed in the table and multiplied by 79 cubic feet of solid wood per cord, resulting in 176.17
cubic feet per MBF.
9
Modeling Price Appreciation
The Price Appreciation worksheet can be used for economic analyses when you wish to model
real price appreciation or depreciation for any of the costs or revenues you have provided.
Nearly all of Resinosa’s data entry is handled through the menu system. This worksheet is the
sole exception. Price appreciation can be modeled for overhead, property tax, all of the
silvicultural activities, product revenues, and the price of land. When entering prices for any cost
or revenue, always enter current dollars. Resinosa will automatically adjust prices to reflect
inflation and any real appreciation or depreciation you specify in this worksheet.
Figure 5 shows a sample portion of the Price Appreciation worksheet for twenty years of
revenue data. Three revenues appear in the sample. They are cords, board feet, and the price of
land. Under each of the revenue headings appears a column for the real rate of appreciation, the
nominal rate, the real price of the revenue, and the nominal price. The real rate, in blue text, is
the column you can change to include the effects of real appreciation. Adjusting this rate causes
price to appreciate or depreciate above or below the specified inflation rate. The Nominal Rate
column reports the inflation rate specified in the Economics and Utilization panel from the
Management Assumptions window. The Real Dollars column reports the yearly price of a cost
or revenue, including the real price appreciation assumption minus the effects of inflation. The
Nominal Dollars column shows the predicted price of a cost or revenue including the effects of
real appreciation and inflation.
Price trends can be modeled for 100 years. All prices are reported for the end of year, including
the effects of compounding for that year. You can use the price appreciation graph found on the
Graphs worksheet to graphically analyze any real or nominal trend for any of the costs or
7revenues modeled on the Price Appreciation worksheet.
Figure 5. A sample portion from a Price Appreciation worksheet.
10
Defining Stand Management Regimes
Resinosa provides two methods for projecting management regimes. The first involves the
traditional DMD approach to thinning. For this approach, upper and lower relative density lines
are defined as boundaries on the DMD. Stands are then managed to stay within the boundaries
until final harvest. This method is advantageous when attempting to maximize yield for a
particular product. Refer to the appendix for a more detailed description of this approach.
Choose Grow Bounded from the Forestry menu to apply this method. When you do so, the
Thin Within Stand Density Ranges window will appear on your screen (Figure 6). This
window allows you to set the management boundaries for thinning, select a final harvest method,
and choose the type of thinnings you wish to implement.
Thin Within Stand Density Ranges
Relative Density Ranges for Thinning: This section of the window allows you to define the
management boundaries Resinosa will use for scheduling thinnings. The upper and lower
management lines define a region on the DMD parallel to the maximum density line, within
which the stand is maintained through thinnings until final harvest. The density lines are defined
as relative densities, specified as percentages. For example, in Figure 6 the upper management
line is set at a relative density of 50 percent. This means that at no time will the stand be allowed
to exceed 50 percent of the maximum, as defined by the maximum density line on the DMD.
The lower limit for this example prevents the stand from falling below 38% of maximum density
following any thinning.
Figure 6. An example of the Thin Within Stand Density Ranges
window.
11
Final Harvest: This section to specify the final harvest. Check No Final Harvest and the stand
will be managed through the end of the planning horizon without harvest. Specified Age allows
you to set the rotation age to a fixed year. Checking Predefined DBH will manage the stand
until its mean tree size first exceeds the specified DBH. Finally, if you check At Maximum
NPV, Resinosa will choose the rotation age, within the allowable planning horizon, which
maximizes net present value.
Thinning Preference: You can specify the type of thinning Resinosa is to perform under the
Thinning Preference section. The number you enter in the Percent Diameter Change textbox
determines how stand mean tree diameter will be affected by a thinning. A positive change
simulates a thinning from below, while a negative changes simulate thinning from above. The
percent change you enter applies for all thinnings over the course of the rotation. You do not
have the option of varying thinning type between thinnings. The exception is the first thinning,
which can be a row thinning. Be cautious when specifying diameter changes of more than five
percent, as the implied post-thin diameter distribution may be unrealistic.
Run Simulation: This button runs a simulation using all of the assumptions pertaining to the
stand, its establishment, and management regime you have defined. The resulting stand
trajectory is displayed on the DMD with Trajectory worksheet and Resinosa’s remaining
graphs and reports are updated to reflect the new management scenario.
Close: The Close button closes the window without running a simulation or saving any of the
changes you have made to the window.
Reset Defaults: The Reset Defaults button resets the default values for the window. Any
changes made to the settings in the window are automatically saved each time you run a
simulation. If you save Resinosa before closing the workbook ,changes will be in effect the next
time you open Resinosa
Defining Custom Thinning Regimes
The second method for developing thinning regimes in Resinsoa is interactive, allowing you to
define your own management scenario. Choose Grow Custom from the Forestry menu to
apply this method. When you do so, the Custom Management window will appear on your
screen along with a DMD for an unmanaged stand (Figure 7). A dark green dot appears on the
trajectory indicating the initial size-density condition of the stand. To create a custom
management regime you move this dot along the stand’s trajectory, specifying when and how
management should occur. This is done with the help of the Custom Management panel
appearing to the right of the DMD. A description of the panel’s workings follows.
Stand Age: Use the Stand Age controls to move backwards and forwards along the stand’s
trajectory. This can be done by adjusting the scrollbar control to the left of the age textbox, or by
directly updating the age textbox with an age. The location of the dark green dot on the DMD is
updated to reflect the size-density condition corresponding to the current age in the age text box.
12
Figure 7. Simulating management using the Custom Management window.
Management Options: You can specify a thinning or final harvest at any point in the stand’s
trajectory. When thinning, you have the option of thinning to a residual basal area or number of
stems per acre. Simply select the method you prefer by clicking its radio button. Doing so
activates the controls for adjusting residual basal area or stems per acre. These controls are
adjusted in the same way as the Stand Age controls. The stand trajectory is automatically
updated in the DMD to reflect any changes in condition due to thinning. If you wish to simulate
the effects of thinning from below, row thinning, or thinning from above you may do so by
changing the post-thin mean diameter in the textbox above the Close button. The trajectory in
the DMD is adjusted to reflect any changes to this box as well. If you decide against thinning,
simply check the Do Nothing option and the stand trajectory will be restored to its original
condition before thinning. Choose Final Harvest whenever the stand is ready for final harvest.
Like the thinning options, a final harvest can be reversed by selecting Do Nothing.
Harvest Information: The harvest information box displays harvest information for the current
position on the stand’s trajectory in terms of total cubic foot volume and the two user defined
products . This box is helpful for determining the amount and type of product that is being
removed during a harvest operation.
13
Close: The Close button closes the
Custom Management window. You
cannot make any adjustment to the current
stand trajectory after the window is
closed.
Graph Options: The Graph Options
button opens the Graph Options window
(Figure 8), which allows you to turn on
the upper and lower management lines, or
a series of basal area lines on the DMD.
Additionally, you can specify the location
of the upper and lower DMD management
lines the same way as you would using the
Thin Within Stand Density Ranges
window for the traditional DMD approach
to thinning. Click the Close button to
return to the Custom Management
window after you are done adjusting the
line settings.
Figure 8. The Graph Options window.
Outputs
Resinosa is capable of reporting simulation results in several different ways. The first is in the
form of a stand trajectory plotted on the DMD in the DMD with Trajectory worksheet.
Additional graphs of various stand characteristics and price trends are produced in the Graphs
worksheet. The Model Details worksheet provides a detailed yearly description of stand
condition for the entire simulation period. Finally, the Economics page includes a detailed
discounted cash flow analysis for the economic life of the simulation. A description of each
follows.
DMD with Trajectory
The focal point of Resinosa’s output capabilities is its interactive DMD (Figure 9). A stand
trajectory for each management regime produced by Resinosa is plotted on the DMD in the
DMD with Trajectory sheet. A Stand Detail window appears to the left of the DMD. It
provides detailed point-in-time descriptions of stand conditions, including mean tree size, stand
density, and yields. To see the condition of a stand at any point on the trajectory, position the
mouse point on the trajectory line and stand detail for that point in time appears in the Stand
Detail window.
Crown ratio is calculated using the equations developed by Holdaway and others (1979).
Current annual increment is calculated from yearly differences reported in the Model Detail
worksheet.
14
Figure 9. Resinosa’s interactive DMD.
Graphs
The Graphs worksheet contains graphs of various stand attributes plotted over time. The
attributes include DBH, density, basal area, height, yield, and increment. Graphs also contains a
graph for the price trends modeled in the economic analysis. The stand yield, stand increment,
and price appreciation graphs are interactive. They contain pull-down menus that allow you to
select the nature of the item plotted. Figure 10 demonstrates this for the stand yield graph. Here
you have the choice of plotting total cubic foot volume or one of the two user-defined products
in terms of standing volume or cumulative yield. The increment graph allows you to plot total
stand volume or one of the two user-defined products. The price appreciation graph contains two
pull-down menus, allowing the comparison of any two price trends in either real or nominal
dollars. All information used for the graphs on the Graphs worksheet is derived from the Model
Details sheet. You can also create your own custom graphs using Excel’s chart capabilities and
the information from the Model Details sheet.
15
Figure 10. Using Resinosa’s interactive graphs.
Model Details
The Model Details worksheet contains a detailed yearly summary of stand conditions for each
year in the simulation. The sheet’s print area is set to the boxed area on the sheet. By default,
this is the printed portion of the sheet. Additional model information appears to the right of the
boxed area, some of which is used elsewhere in Resinosa. This page contains the
implementation of the growth model. Unlike traditional models, which rely solely on lines of
computer code, much of Resinosa’s growth model is implemented in spreadsheet form through
the use of formulas. For this reason, users are advised not to modify or protect any formulas or
cells in this worksheet. Doing so could easily result in Resinosa’s failure to function properly.
A sample Model Details report appears on the next page.
16
17
Economics
The Economics sheet contains a detailed discounted cash flow analysis for the current stand trajectory. All of the modeled costs and revenues are itemized
for the length of the economic planning horizon. Net present value (NPV) and internal rate of return (IRR) for the current rotation are reported at the top of
the sheet. Neither NPV nor IRR contain the effects of selling the land at the end of the rotation. Two forms of SEV are also reported. The first adds the
discounted value of selling the land at rotation age to the NPV, while the second ignores the sale of land, assuming a perpetual series of the returns resulting
from the current management regime. Note that SEV is only applicable for stands grown from bare soil. A detailed summary of the assumptions used with
the current stand trajectory also appears at the bottom of the sheet. The Economics sheet is formatted to fit three printed pages. A sample report follows.
18
19
20
References
Avery, T.E., Burkhart, H.E. 1983. Forest Measurements. Third Edition. McGraw-Hill Book
Company.
Benzie, J.W. 1977. Manager’s handbook for red pine in the North-Central States. General
Technical Report NC-33. USDA North Central Forest Experiment Station.
Holdaway, M.R, R.A. Leary, and J.L Thompson. 1979 Estimating mean stand crown ratio from
stand variables. In A generalized forest growth projection system applied to the Lake States
region. pp. 27-30. General Technical Report NC-49. USDA North Central Forest Experiment
Station.
Long, J. N. 1985. A practical approach to density management. Forestry Chronicle. 61: 23-27.
Lundgren, A. L. 1981. The effect of initial number of trees per acre and thinning densities on
timber yields from red pine plantations in the Lake States. North Central Forest Experiment
Station. Research Paper NC-193.
Reineke, R.L. 1933. Perfecting a stand-density index for even-aged forests. Journal of
Agricultural Research. 46: 627-638.
Smith, D. J., and M. E. Woods. 1997. Red Pine and White Pine Density Management Diagrams
for Ontario. Ontario Ministry of Natural Resources Southcentral Sciences Section. Technical
Report No. 48.
Smith, N.J., and D.G. Brand. 1987. Compatible growth models and stand density diagrams. In:
A.R. Ek, S.R Shifley and T.E. Burk (Editors). Forest Growth Modeling and Prediction. USDA
Forest Service General Technical Report No. NC-120. pp. 636-643.
21
Appendix: Application of a density management diagram
for Lake States red pine management.
The Density Management Diagram
Foresters manage stands to meet a variety of management objectives. Often times these
objectives involve the production of one or more types of merchantable yield such as pulpwood,
poles, or sawlogs. In cases where timber production is the objective, management often focuses
on maximizing volume production for the product or products being considered. This usually
involves encouraging growth on some collection of desirable trees, while capturing mortality
from the less vigorous trees. Density control is the primary means by which this is
accomplished.
Density Management Diagrams (DMDs) are popular tools for developing management
prescriptions for even-aged stands. Their popularity stems from their ability to easily incorporate
the ecological principle of self-thinning, or competition induced mortality, which provides a
stimulus for thinning. Reineke (1933) was one of the first to introduce the concept of selfthinning. He showed that stands of a given average diameter do not exceed a corresponding
maximum density. When graphed in log/log scale (Figure 11), this relationship can be
approximated by a straight line, which forms the upper boundary for maximum density. Stands
within a region parallel to and just below the maximum density line are said be self-thinning.
That is, they are experiencing competition induced mortality.
The focus of management, or density control, is to
100
100
Quadratic Mean DBH
Quadratic Mean DBH
Maximum Density Line
10
Management Region
10
Canopy Closure
Stand Trajectory
1
100
1000
10000
Stems/Acre
Figure 11. The diameter-density relation ship
for red pine stand from across the Lake States.
1
100
1000
Stems/Acre
Figure 12. The development of a 60 year old
managed red pine stand .
22
prevent stands from reaching the zone where self-thinning can occur. Typically, with a DMD
the strategy is to maintain stands below the region of self-thinning, within a “management
region” parallel to the maximum density line, but above the point of canopy closure (Figure 12).
100
Tree Growth (% of potential)
Stand Growth (% of potential)
Management objectives dictate the placement of management regions, which in turn determine
how stands grow and develop. When deriving management regions, foresters must consider the
trade-off between overall stand growth and individual tree growth. Both types of growth are
density dependent, but with opposite trends. Stands maintained at higher relative densities,
closer to maximum density, exhibit higher overall stand growth (Figure 13), while stands
maintained at low relative densities exhibit higher individual tree growth (Figure 14), at the
expense of overall stand growth. With the DMD approach, stands managed for maximum fiber
production, or pulpwood, are carried higher on the chart, whereas stands managed for sawlogs
are carried lower on the chart in order to maximize individual tree growth.
75
50
25
0
0
10 20 30 40 50 60 70 80 90 100
Relative Density (%)
Figure 13. The relationship between overall stand
growth and stand relative density. Adapted from
Long (1985).
100
75
50
25
0
0
10 20 30 40 50 60 70 80 90 100
Relative Density (%)
Figure 14. The relationship between individual tree
growth and stand relative density. Adapted from
Long (1985).
Problems with Traditional DMDs
While DMDs are effective tools, the traditional approach to their application has several
drawbacks. First, the traditional DMD approach fails to account for mortality, which occurs at
all stages of stand development. Traditional applications assume no competition-based
mortality. While this assumption is practical if stands are constantly managed at lower densities,
it becomes unrealistic for stands carried at higher densities.
Second, a traditional DMD directly tracks the relationship between average tree size and density,
independent of age. This means that age must be indirectly derived from average size and
density. This is typically done through a system of equations that predict age, given mean tree
size, stand density, and site index. These, typically static system of equations, typically result in
inconsistent age prediction.
23
Third, management decisions require predictions of merchantable product volume. Like age,
volume must be predicted indirectly with the traditional DMD approach.
Finally, most DMDs are designed to account for single product yields. Typically they will
provide an estimate of pulpwood or sawlog yield, but not both. This is a drawback since many
species, such as red pine in the Lake States, are merchandized for multiple products.
Furthermore, product merchantability standards are usually fixed, preventing the user from
defining merchantability standards of particular interest to them.
An Alternative Approach to DMD Implementation
While the DMD presented here is not the first attempt for red pine (cf. Smith and Brand, 1989;
Smith and Woods, 1997), it is the first red pine DMD to circumvent the problems described
above. Resinosa is a spreadsheet based DMD for Lake States red pine which allows the forester
to interactively compare various management options. Resinosa’s strength is that it is a modelbased approach. Mortality, age, product volumes, and merchantability standards are handled
directly by a system of equation that make up the growth and yield model. Potential
inconsistencies between management scenarios are avoided.
Minimum required inputs for a simulation include trees per acre, average stand DBH, and site
index. User defined merchantability specifications for up to two products are allowed. The user
also specifies the upper and lower management lines for the management region, as well as the
point at which final harvest occurs. Another option bypasses the use of management regions
completely, allowing users to run fully customized management scenarios.
Red Pine Management Examples
Simulations were conducted examining various pulpwood and sawlog management regimes to
demonstrate Resinosa’s capabilities. Three alternatives were simulated for 60 year pulpwood
rotations. The first involved a constant basal area approach, where the stand was maintained
between set upper and lower basal areas of 160 and 120 square feet, respectively. The second
followed a method described by Lundgren (1981) in which the stand is thinned back to 120
square feet every ten years until final harvest. The third utilized the traditional DMD approach
in which the stand was maintained within a management region, bounded by relative densities of
47% and 60%. Overall pulpwood yield results were similar (Table 1), with the DMD approach
producing slightly less cordwood volume but larger trees.
A second comparison was made between two 60 year sawlog regimes. Here, both stands were
managed using a DMD approach in which the management region was bounded by relative
densities of 40% and 52%. The first stand assumed an establishment density of 800 trees per
acre, while the second assumed 400 trees per acre. Both scenarios produce cordwood volumes
similar to the pulpwood scenarios (Table 2), but with much larger diameters. The stand
established with 400 trees per acre produced trees nearly one inch larger in size at 60 years. In
24
terms of sawlog production, it outperformed the higher density stand by 50 board feet per year,
for a total difference of 3000 board feet over the rotation.
Table 1. Results from the comparison of various
thinning regimes for a 60 year pulpwood objective.
Stand
BA 120-160
Comparison
Table 2. Results from the comparison of various
thinning regimes for a 60 year sawlog objective.
Lundgren
120 BA
DMD
Approach
Stand
Comparison
800 Trees
400 Trees
DBH
(inches)
10.3
9.9
11.5
DBH (inches)
13.2
14.0
Trees/Acre
270
309
206
Trees/Acre
143
134
Stem Wood 60
Year MAI (cuft)
122
123
118
Stem Wood Age 60
MAI (cuft)
114
106
Pulpwood 60
Year MAI
(Cords)
1.36
1.36
1.31
Pulpwood Age 60
MAI (Cords)
1.3
1.3
Sawtimber 60
Year MAI (BF)
360
370
400
Sawtimber Age 60
MAI (BF)
420
470
25